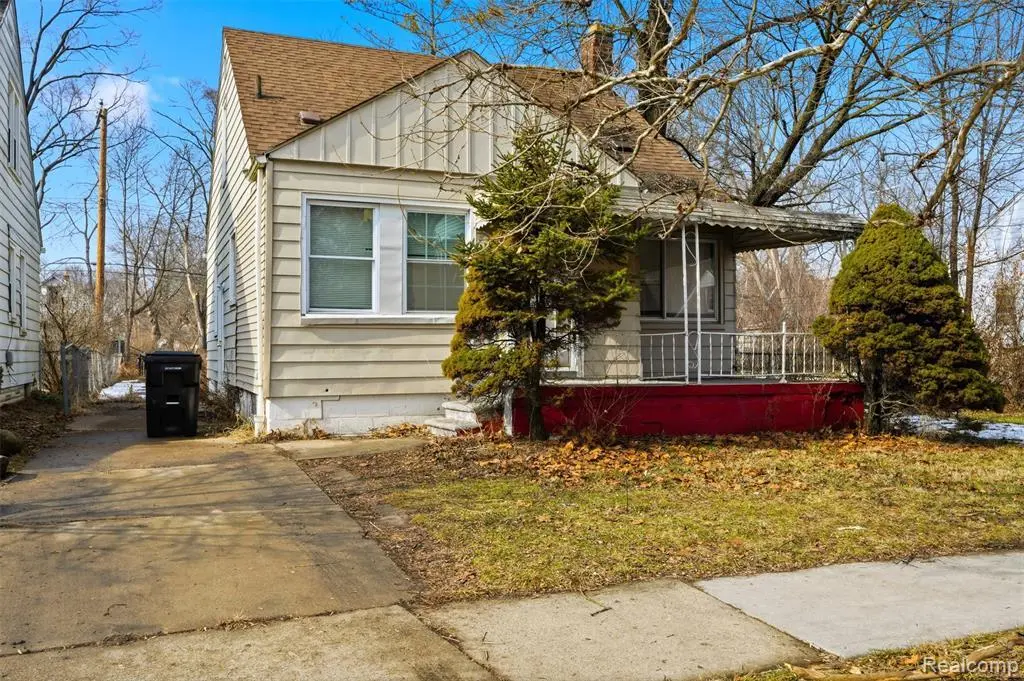
7261 Auburn St · Detroit, MI
Flood risk 3/10 · Minor
- FEMA flood zone
- X (unshaded)
- Chance of flooding over 30 yrs
- 0.2%
- Est. flood insurance / yr
- $473 – $860
Fire risk 1/10 · Minimal
- Est. fire insurance / yr
- $784 – $1,456
Heat risk 3/10 · Minor
- Hot days now (above 99°F)
- 7 days/yr
- Hot days in 30 yrs
- 15 days/yr
Wind risk 2/10 · Minimal
- Chance of severe wind over 30 yrs
- —
Air-quality risk 3/10 · Minor
- Unhealthy air days now
- 2 days/yr
- Unhealthy air days in 30 yrs
- 4 days/yr
Risk factors via First Street. Map © Google.
Why this score? — see what drove the C grade
The composite is a weighted blend of 9 inputs, each scored 0–100. Each bar is that input's sub-score; the figure is the points it added to the 100-point composite (weight × sub-score).
- Cash flow +30.0/30.0
- 1% rule +10.0/10.0
- DSCR +10.0/10.0
- Livability +3.7/5.0
- Condition / age +2.5/5.0
- Rent growth +1.9/5.0
- Schools +1.3/10.0
- ARV discount +0.1/15.0
- Appreciation +0.0/10.0
$86,000
🖨 Deal sheet (PDF) 📄 Offer letter ✓ Due diligence
Listing remarks MLS
Great investment opportunity for a beginner investor looking to purchase a cash flowing property or for a seasoned investor looking to add to their portfolio. Add this tenant occupied home to your portfolio. Home was fully rehabbed in February 2022 with new roof, updated electric and plumbing. New Kitchen, bathrooms and flooring throughout. Has been professionally managed since. Please do not disturb tenants.
Key facts
- Fully rehabbed
- New kitchen
- Updated electric
Tags
Neighborhood map
What this means for you Summary
Snapshot
- This is a 3-bed/1.0-bath single-family listed at $86k.
Deal economics
- At list price, monthly cash flow is $490 ($6k/yr) — positive.
- The deal already cash-flows at list — no discount required.
- Meets the 1% rule at list price ($1k rent vs $86k).
- Recommended offer: $81k (6.0% below list) — sets the bar for market timing.
- Cap rate 13.1% vs local median 10.0% in Detroit — top-decile yield for the area; either an underpriced asset or a hidden risk that comps aren't pricing in. Stress-test before assuming the spread holds.
Location & tenants
- Location reads 73/100 on livability (#218 in MI) — a middle-class / working-renter tenant base. Strengths: amenities A+, commute A+, cost of living A+; Watch: crime F, employment F.
- Detroit Public Schools Community District (urban): math 10% / reading 24% proficiency, ranked #499 of 540 in MI (top 92%) — low school quality limits family demand, transient renter base, plan for 1-2y turnover; 90% free/reduced lunch — lower-income household profile, screen leases tightly.
- Zoned schools: Neinas Dual Language Learning Academy (math 8% / reading 8%, grade F, #1,300 of 1,397 statewide, top 94%, 400 students, 85% FRL); Cody High School (math 24% / reading 24%, grade F, #481 of 713 statewide, top 81%, 466 students, 88% FRL) — zoned schools at 86% FRL track the district average.
- Market conditions: Rents soft (-2.3%/yr); 367 active listings in the ZIP; 30 comparable units currently listed for rent nearby; rentals lingering (median 46d on market — plan ~5-8 weeks vacancy on turnover, expect pricing pressure); 57% of comp listings sitting > 30 days — soft ceiling on asking rent; lower-income renter base — watch delinquency; 2,639 units permitted in Wayne County in 2024 (1,216 in 5+ unit buildings).
- At $1,350/mo this rent would consume 53% of the median local household income ($31k/yr) (locally 4144% of renters already pay >50% of income on rent) — very limited rent-growth headroom before tenants either downsize or default.
Forward outlook
- Local home prices are declining (-3.0%/yr); year-one equity from $595 of loan paydown is wiped out by about $3k of value loss. Plan a longer hold.
- Wayne County population projected at -17% by 2050 — secular population decline; favor cash flow + early exit over multi-decade hold.
- At projected returns (-3.0% appreciation + 0.0% rent growth), your $24k cash investment doubles in ~6 years — after that, you're playing with house money.
Negotiation context
- It's been on market 65 days — a 6% lower offer ($81k) is reasonable based on typical stale-listing flexibility.
- 22 sale attempts since 30y ago with the ask held roughly flat each time — persistent listings suggest the price (not the market) is what's stuck; bring a comps-based counter.
- Current owner paid $52k; list at $86k implies a 65% gain — meaningful room to come down on a strong offer.
Risks & watch-outs
- Watch-outs: built in 1949 — expect roof / HVAC / electrical / plumbing capex.
Questions for the listing agent
- It's been on market 65 days. Have you received any prior offers? Is the seller open to a 6% concession, seller financing, or rate buy-down credit?
- Built in 1949 — when were the roof, HVAC, electrical panel, plumbing, and water heater last replaced?
- Why hasn't it sold? Are there any deal-killer items the seller is aware of (foundation, flood, title, zoning, code violations)?
- Is there a deadline driving the sale (1031 exchange, divorce, estate, relocation)? That informs how much negotiation room exists.
- Schools are F-rated, which usually means shorter tenancies and higher turnover. Who's the typical renter profile here, and what's been the actual vacancy rate?
- Crime grade is F in this area — have there been break-ins, vandalism, or insurance claims at this property in the last 3 years? What carrier currently insures it and at what premium?
- What's the average days-on-market for RENTAL listings here right now (not sales)? A rising rental-DOM trend means longer vacancies and softer asking-rent achievability than the comps imply.
- What's the recent tenant-quality profile in this submarket — average credit score on applications, eviction rate, late-payment / NSF rate, and stable-employment percentage? A property-management company in the area should have these aggregated.
- How much new for-sale + rental construction is in the pipeline within 1–3 miles? Heavy new supply typically softens prices + rents 12–24 months out; constrained supply supports both.
Investment metrics
- 1% rule
- 1.57% ✓
- Cap rate
- 13.13%
- Cash-on-cash
- 24.43%
- DSCR
- 2.09
- GRM
- 5.3
CMA / ARV
- ARV (median comp)
- $73,870
- List price
- $86,000
- Delta
- 16.42%
- Verdict
- OVERPRICED
- Comps
- 20 within 1.0 mi
Show comp detail 12 sales within ~0.75 mi
| Address | Dist | Beds/Ba | Sqft | Sold | Price | $/sf | Match |
|---|---|---|---|---|---|---|---|
| 7683 Warwick St | 0.41mi | 2/1.0 (-1) | 1,200 (+2%) | 4mo | $60,000 | $50 | 70 |
| 7601 Stout St | 0.37mi | 3/1.0 | 1,100 (-7%) | 3mo | $140,000 | $127 | 69 |
| 6782 Evergreen Ave | 0.26mi | 3/1.0 | 1,041 (-12%) | 3mo | $120,000 | $115 | 66 |
| 6427 Artesian St | 0.58mi | 3/1.0 | 1,118 (-5%) | 0mo | $100,000 | $89 | 64 |
| 7690 Heyden St | 0.35mi | 3/1.0 | 1,019 (-14%) | 1mo | $73,000 | $72 | 60 |
| 7716 Artesian St | 0.50mi | 3/1.0 | 1,286 (+9%) | 4mo | $70,000 | $54 | 59 |
| 8418 Grandville Ave | 0.73mi | 3/1.0 | 1,229 (+4%) | 2mo | $60,000 | $49 | 57 |
| 8201 Heyden St | 0.62mi | 3/1.0 | 1,306 (+11%) | 1mo | $59,999 | $46 | 53 |
| 7816 Fielding St | 0.53mi | 3/1.0 | 1,022 (-13%) | 2mo | $57,000 | $56 | 51 |
| 7633 Faust Ave | 0.66mi | 3/1.0 | 1,045 (-11%) | 3mo | $60,000 | $57 | 48 |
| 8234 Patton St | 0.72mi | 3/1.0 | 1,010 (-14%) | 2mo | $60,000 | $59 | 41 |
| 6530 Brace St | 0.63mi | 2/2.0 (-1) | 1,330 (+13%) | 0mo | $69,000 | $52 | 40 |
Match score weights: distance 35% · size 25% · config 20% · recency 20%. Top-matched comps best support the ARV.
Projected returns pro-forma
-3.0% appreciation · 0.0% rent growth · sell at horizon
- IRR
- 14.4%
- Equity multiple
- 1.55×
- Total profit
- $13,340
- Equity at exit
- $12,823
- IRR
- 20.8%
- Equity multiple
- 2.52×
- Total profit
- $36,568
- Equity at exit
- $7,436
Cash invested: $24,080 (down + closing). Projections, not guarantees.
Landlord ↔ Tenant lean methodology
- Overall (STATE)
- 62 Landlord-Friendly
- State Michigan
- 62 Landlord-Friendly · EVEN
- County
- — inherits STATE
- City
- — inherits STATE
ZIP-level market 48228
- Rents YoY
- -2.3%
- Active inventory
- 367
- Price-to-rent
- 5.3×
Monthly cashflow live
- Estimated rent
- $1,350 high interval (Pro) →
- Mortgage (P&I)
- −$451
- Tax from tax record
- −$90 /mo · $1,074/yr
- Insurance
- −$36
- HOA
- −$0
- Vacancy / Maint / Mgmt
- −$284
- Net cashflow
- $490
Break-even live
Sensitivity live
| Price | -10% $539 | -5% $515 | +0% $490 | +5% $466 | +10% $442 |
|---|---|---|---|---|---|
| Rent | -10% $384 | -5% $437 | +0% $490 | +5% $544 | +10% $597 |
| Rate | -1.0pp $534 | -0.5pp $512 | base $490 | +0.5pp $468 | +1.0pp $445 |
UW: 25.0% down · 7.5% · 30yr · 1.5% tax · 5.0% vac · 8.0% maint · 8.0% mgmt
Financing live
Cash to close
- Down payment
- $21,500
- Closing costs
- $2,580
- Reserves months
- —
- Total cash needed
- —
Loan-product check · same deal, 3 products live
Conventional
25% down · 7.5% · 30yr
- Down + closing
- —
- Monthly P&I
- —
- Monthly cashflow
- —
- DSCR
- —
- Eligible?
- —
Personal DTI + credit; lowest rate.
DSCR
20% down · 8.5% · 30yr
- Down + closing
- —
- Monthly P&I
- —
- Monthly cashflow
- —
- DSCR
- —
- Eligible?
- —
No personal income docs; deal must DSCR.
Hard money
10% down · 12.0% · 12mo
- Down + closing
- —
- Monthly P&I
- —
- Monthly cashflow
- —
- DSCR
- —
- Eligible?
- —
Short-term bridge; refi at stabilization.
Rent comps 30 comps
| Address | Beds | Baths | Sqft | Rent | $/sqft | DOM | Units | Dist |
|---|---|---|---|---|---|---|---|---|
| 7411 Stout St Detroit, MI | 3.0 | 1.0 | 888 | $1,428 | $1.61 | 14d | 1 | 0.36mi |
| 7794 Vaughan St Detroit, MI | 3.0 | 1.0 | 1000 | $1,450 | $1.45 | 18d | 1 | 0.43mi |
| 6874 Country Ln Dearborn Heights, MI | 2.0 | 1.5 | 1400 | $1,500 | $1.07 | 45d | 1 | 0.43mi |
| 20431 Tireman St Detroit, MI | 3.0 | 1.0 | 1020 | $1,350 | $1.32 | 19d | 1 | 0.55mi |
| 6490 Stahelin Ave Detroit, MI | 3.0 | 1.0 | 960 | $1,299 | $1.35 | 18d | 1 | 0.59mi |
| 20571 Brooklawn Dr Dearborn Heights, MI | 3.0 | 2.0 | 1254 | $1,850 | $1.48 | 45d | 1 | 0.62mi |
| 8283 Vaughan St Detroit, MI | 3.0 | 1.0 | 1058 | $1,294 | $1.22 | 6d | 1 | 0.68mi |
| 5965 Evergreen Rd Dearborn Heights, MI | 1.0–2.0 | 1.0 | 825 | $1,350 | $1.64 | 7d | 1 | 0.83mi |
| 8270 Trinity St Detroit, MI | 3.0 | 1.0 | 806 | $1,528 | $1.90 | 45d | 1 | 0.92mi |
| 19301 Joy Rd Apt 1 Detroit, MI | 2.0 | 1.0 | 750 | $1,100 | $1.47 | 45d | 1 | 0.94mi |
| 8262 Rosemont Ave Detroit, MI | 3.0 | 1.0 | 836 | $1,200 | $1.44 | 6d | 1 | 0.98mi |
| 8451 Rosemont Ave Detroit, MI | 3.0 | 1.0 | 867 | $1,150 | $1.33 | 45d | 1 | 1.05mi |
| 5777 Southfield Fwy Detroit, MI | 2.0 | 1.0–2.0 | 667 | $1,530 | $2.29 | 0d | 7 | 1.11mi |
| 6761 Memorial Ave Detroit, MI | 3.0 | 1.0 | 1060 | $1,100 | $1.04 | 26d | 1 | 1.14mi |
| 9090 Stahelin Ave Detroit, MI | 2.0 | 1.0 | 787 | $1,250 | $1.59 | 45d | 1 | 1.24mi |
| 5521 Fairlane Woods Dr Dearborn, MI | 1.0–3.0 | 1.0–2.0 | 1164 | $2,430 | $2.09 | 0d | 10 | 1.24mi |
| 8850 Rosemont Ave Detroit, MI | 3.0 | 1.0 | 933 | $1,100 | $1.18 | 19d | 1 | 1.25mi |
| 22330 W Warren Ave Redford Charter Twp, MI | 2.0 | 1.0 | 750 | $1,200 | $1.60 | 45d | 1 | 1.28mi |
| 9059 Burt Rd Detroit, MI | 3.0 | 1.0 | 980 | $1,400 | $1.43 | 45d | 1 | 1.29mi |
| 19449 W Chicago St Detroit, MI | 3.0 | 1.5 | 950 | $1,500 | $1.58 | 45d | 1 | 1.42mi |
| 19440 W Chicago St Detroit, MI | 3.0 | 1.5 | 1200 | $1,225 | $1.02 | 19d | 1 | 1.45mi |
| 19440 W Chicago St Detroit, MI | 3.0 | 1.5 | 1200 | $1,225 | $1.02 | 23d | 1 | 1.45mi |
| 9401 Fielding St Detroit, MI | 2.0 | 1.0 | 1000 | $900 | $0.90 | 45d | 1 | 1.47mi |
| 9410 Patton St Detroit, MI | 2.0 | 1.0 | 1000 | $900 | $0.90 | 45d | 1 | 1.47mi |
| 9404 Patton St Detroit, MI | 2.0 | 1.0 | 1000 | $900 | $0.90 | 45d | 1 | 1.47mi |
| 20529 W Chicago Detroit, MI | 2.0 | 1.0 | 1000 | $900 | $0.90 | 45d | 1 | 1.48mi |
| 20541 W Chicago Detroit, MI | 2.0 | 1.0 | 1000 | $900 | $0.90 | 45d | 1 | 1.48mi |
| 20545 W Chicago Detroit, MI | 2.0 | 1.0 | 1000 | $900 | $0.90 | 45d | 1 | 1.48mi |
| 20547 W Chicago Detroit, MI | 2.0 | 1.0 | 1000 | $900 | $0.90 | 45d | 1 | 1.48mi |
| 20619 W Chicago Detroit, MI | 2.0 | 1.0 | 950 | $1,200 | $1.26 | 45d | 1 | 1.49mi |
Listing history 50 events
-
2026-06-21days on market $86,000 Active 65 DOM
-
2026-06-18days on market $86,000 Active 62 DOM
-
2026-06-17days on market $86,000 Active 61 DOM
-
2026-06-15days on market $86,000 Active 59 DOM
-
2026-06-13days on market $86,000 Active 57 DOM
-
2026-06-13days on market $86,000 Active 56 DOM
-
2026-06-09days on market $86,000 Active 53 DOM
-
2026-06-08days on market $86,000 Active 52 DOM
-
2026-06-07days on market $86,000 Active 51 DOM
-
2026-06-04days on market $86,000 Active 48 DOM
-
2026-06-03days on market $86,000 Active 47 DOM
-
2026-06-02days on market $86,000 Active 46 DOM
-
2026-06-01days on market $86,000 Active 45 DOM
-
2026-05-31days on market $86,000 Active 44 DOM
-
2026-04-17$86,000 Active 412-char remark
Show marketing remark (412 chars)
Great investment opportunity for a beginner investor looking to purchase a cash flowing property or for a seasoned investor looking to add to their portfolio. Add this tenant occupied home to your portfolio. Home was fully rehabbed in February 2022 with new roof, updated electric and plumbing. New Kitchen, bathrooms and flooring throughout. Has been professionally managed since. Please do not disturb tenants.
-
2026-04-01historical
-
2026-04-01historical
-
2026-03-07status Active
-
2026-03-07historical
-
2026-02-26$88,000 Active
-
2026-02-26$88,000 Active
-
2025-01-24historical $1,250
-
2024-10-24$1,250
-
2022-05-23price $1,150
-
2021-12-21soldstatus $52,000 Sold
-
2021-12-21soldstatus $52,000
-
2021-12-21soldstatus $52,000 Closed
-
2021-11-29status Pending
-
2021-11-29status Pending
-
2021-08-13status Active
-
2021-08-13status Active
-
2021-07-15status Pending
-
2021-07-15status Pending
-
2021-06-29$58,000 Active
-
2021-06-29$58,000
-
2021-06-29$58,000 Active
-
2014-03-21historical
-
2014-03-21historical
-
2013-08-26$12,900
-
2013-08-26$12,900
-
2012-06-12historical
-
2012-06-12historical
-
2011-12-12$18,500
-
2011-12-12$18,500
-
2008-01-10soldstatus $16,000
-
2008-01-10soldstatus $16,000
-
2008-01-10soldstatus $16,000
-
2007-12-18historical
-
2007-10-25$20,100
ⓘ Source: listings_history table (triggers on properties + properties_extension) + one-shot
backfill from property_details.listing_events for pre-trigger history.
Tax reassessment forecast MI · Partial reset (capped growth)
- Current annual tax
- $1,074 · $90/mo
- Projected year-2 tax
- $1,199 · $100/mo
- Expected delta
- +$125/yr (+$10/mo · 11.6%)
ⓘ Screening estimate from a state-policy table — verify with the county assessor before closing.
Climate risk First Street
- Flood 3/10 Moderate FEMA zone X (unshaded) · 20% chance over 30 yrs
- Wildfire 1/10 Low
- Heat 3/10 Moderate 7 d/yr ≥99°F today · 15 d/yr by 30 yrs out
- Wind 2/10 Low
- Air quality 3/10 Moderate 2 unhealthy d/yr today · 4 by 30 yrs out
Nearby sold comps map
Loading sold comps map…
Walkable amenities ~0.75 mi
Loading nearby amenities…
Taxation est. · year 1
- Rental income
- $16,201
- − Mortgage interest
- −$4,817
- − Property taxes
- −$1,074
- − Insurance
- −$430
- − Repairs & maintenance
- −$1,296
- − Management
- −$1,296
- − Depreciation
- −$2,502
- Taxable income
- $4,786
- Est. tax owed @ 24.0%
- −$1,149
- After-tax cash flow
- $4,734/yr
For passive investors: Depreciation is non-cash, so a rental often shows a tax loss while cash-flowing — sheltering income. Rental losses are passive: they offset passive income freely, and up to $25,000/yr can offset ordinary (W-2) income if you actively participate and your MAGI is under $100k (phasing out to $0 by $150k); unused losses carry forward. On sale, claimed depreciation is recaptured at up to 25%, and gains may owe capital-gains tax (a 1031 exchange can defer both). Figures are a year-1 estimate at your 24.0% rate — not tax advice; consult a CPA.
Schools (NCES district)
- District
- Detroit Public Schools Community District
- NCES district ID
- 2601103
- Math proficiency
- 10% ▼ -2.00%
- Reading proficiency
- 24% ▲ 6.00%
- Median HH income
- $25,815
- Composite
- 13.06/100
- National rank
- #9564
- State rank
- #499 of 540 in MI
Livability — Detroit
- Score
- 73/100
- State rank
- #218
- US rank
- #5427
Category grades
Schools grade is shown separately in the Schools card above.
Census & demographics
- Census place
- Detroit, MI
- County
- Wayne County · 1,562,939 people
- City population
- 572,865
- Metro
- Detroit-Warren-Dearborn, MI
- Population (ZIP)
- 50,117
- Household income
- $30,680
- Rent vs Own
- Severe rent burden
- 4144.0
Population outlook (Wayne County) Hauer SSP2
- Today (2025)
- 1,675,273 people
- By 2030
- 1,620,300 · -3.3%
- By 2040
- 1,502,341 · -10.3%
- By 2050
- 1,384,039 · -17.4%
- By 2075
- 1,124,592 · -32.9%
- By 2100
- 881,193 · -47.4%
Race, ethnicity, and origin ACS 2023
- Neighborhood character
- Predominantly Black (71%)
- Race & ethnicity
- Black 71% White 16% Two or more races 7% Hispanic / Latino 6%
- Hispanic origin (detail)
- Mexican 3% Puerto Rican 2%
- Common ancestry
- Arab 2% Romanian 2% Lithuanian 1%
- Foreign-born
- 11% · Canada
- Languages at home
- 82% English-only · Arabic 11% Spanish 5%
Political lean MEDSL · Wayne
- 2024 margin
- Strong D (+29.0) · D 62.7% · R 33.7% · Other 3.6%
- 2008→2024 swing
- -20.5pp toward R · 2008: 49.5pp · 2024: 29.0pp
- All cycles
- 2024: D+29.0 2020: D+38.1 2016: D+37.3 2012: D+46.9 2008: D+49.5
Not yet ingested
- Civics
- —
Market trends
- HPI YoY
- ▼ -160.81%
- Current HPI
- 168.6843
- Rent YoY
- ▼ -2.30%
- Metro
- Detroit-Warren-Dearborn, MI
- State GDP YoY
- ▲ 1.37%
- F500 in state
- 28
Industry mix (Fortune 500 HQ in MI)
| Industry | F500 HQs | Revenue |
|---|---|---|
| Automotive Parts | 3 | $48B |
|
||
| Automotive | 2 | $372B |
|
||
| Chemicals | 1 | $45B |
|
||
| Automotive Retail | 1 | $29B |
|
||
| Healthcare / Medical Devices | 1 | $23B |
|
||
| Automotive Technology | 1 | $20B |
|
||
Price history
+161.4% since first listed49 events — show timeline
- 2026-04-17 Listed $86,000 MiRealSource-MiMLS
- 2026-04-17 Listed $86,000 REALCOMP
- 2026-04-01 Listing Removed — REALCOMP
- 2026-04-01 Listing Removed — MiRealSource-MiMLS
- 2026-03-07 Relisted — REALCOMP
- 2026-03-07 Listing Removed — REALCOMP
- 2026-02-26 Listed $88,000 REALCOMP
- 2026-02-26 Listed $88,000 MiRealSource-MiMLS
- 2025-01-24 Rental Removed $1,250 BUILDIUM
- 2024-10-24 Listed for Rent $1,250 BUILDIUM
- 2022-05-23 Price Changed $1,150 BUILDIUM
- 2021-12-21 Sold (MLS) $52,000 MiRealSource-MiMLS
- 2021-12-21 Sold (MLS) $52,000 MiRealSource-MiMLS
- 2021-12-21 Sold (MLS) $52,000 REALCOMP
- 2021-11-29 Pending — MiRealSource-MiMLS
- 2021-11-29 Pending — REALCOMP
- 2021-08-13 Relisted — MiRealSource-MiMLS
- 2021-08-13 Relisted — REALCOMP
- 2021-07-15 Pending — MiRealSource-MiMLS
- 2021-07-15 Pending — REALCOMP
- 2021-06-29 Listed $58,000 MiRealSource-MiMLS
- 2021-06-29 Listed $58,000 MiRealSource-MiMLS
- 2021-06-29 Listed $58,000 REALCOMP
- 2014-03-21 Listing Removed — REALCOMP
- 2014-03-21 Listing Removed — MiRealSource-MiMLS
- 2013-08-26 Listed $12,900 REALCOMP
- 2013-08-26 Listed $12,900 MiRealSource-MiMLS
- 2012-06-12 Listing Removed — REALCOMP
- 2012-06-12 Listing Removed — MiRealSource-MiMLS
- 2011-12-12 Listed $18,500 REALCOMP
- 2011-12-12 Listed $18,500 MiRealSource-MiMLS
- 2008-01-10 Sold (MLS) $16,000 REALCOMP
- 2008-01-10 Sold (MLS) $16,000 REALCOMP
- 2008-01-10 Sold (MLS) $16,000 MiRealSource-MiMLS
- 2007-12-18 Listing Removed — MiRealSource-MiMLS
- 2007-10-25 Listed $20,100 REALCOMP
- 2007-10-24 Listing Removed — REALCOMP
- 2007-07-23 Listed $36,900 REALCOMP
- 2007-07-23 Listed $20,100 REALCOMP
- 2007-07-23 Listed $20,100 MiRealSource-MiMLS
- 2006-03-17 Sold (Public Records) $110,000 Public Records
- 2001-01-02 Listing Removed — REALCOMP
- 2000-10-31 Listing Removed — REALCOMP
- 2000-10-31 Listed $84,900 REALCOMP
- 2000-10-09 Listed $89,900 REALCOMP
- 1996-11-20 Sold (Public Records) $42,900 Public Records
- 1996-10-31 Sold (MLS) $42,900 REALCOMP
- 1996-08-15 Listed $42,900 REALCOMP
- 1993-07-01 Sold (Public Records) $32,900 Public Records
Property tax history
+1.8%/yrLatest (2025): $1,074 · -36.9% YoY. Source: county tax records.
Cash-flow waterfall
monthlySold comps — $/sqft
last 12 mo · ≤1 miLoading sold comps…