2322 Palos Verdes Dr W #206 · Palos Verdes Estates, CA
Flood risk 1/10 · Minimal
- FEMA flood zone
- X (unshaded)
- Chance of flooding over 30 yrs
- 0.0%
- Est. flood insurance / yr
- $507 – $1,088
Fire risk 2/10 · Minimal
- Est. fire insurance / yr
- $659 – $1,223
Heat risk 2/10 · Minimal
- Hot days now (above 83°F)
- 7 days/yr
- Hot days in 30 yrs
- 21 days/yr
Wind risk 1/10 · Minimal
- Chance of severe wind over 30 yrs
- —
Air-quality risk 4/10 · Minor
- Unhealthy air days now
- 6 days/yr
- Unhealthy air days in 30 yrs
- 6 days/yr
Risk factors via First Street. Map © Google.
Why this score? — see what drove the D- grade
The composite is a weighted blend of 9 inputs, each scored 0–100. Each bar is that input's sub-score; the figure is the points it added to the 100-point composite (weight × sub-score).
- ARV discount +7.5/15.0
- Schools +7.1/10.0
- Cash flow +5.6/30.0
- Appreciation +5.0/10.0
- Livability +3.4/5.0
- Rent growth +2.9/5.0
- Condition / age +2.5/5.0
- 1% rule +1.1/10.0
- DSCR +0.0/10.0
$799,000
🖨 Deal sheet (PDF) 📄 Offer letter ✓ Due diligence
Listing remarks
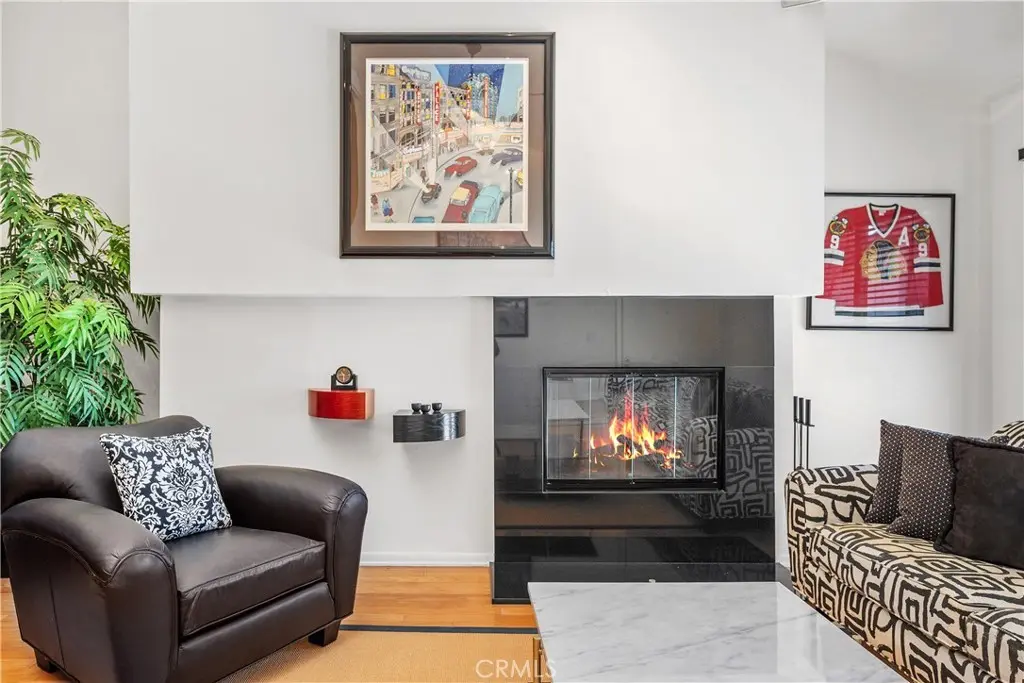
TOP FLOOR, and all on ONE LEVEL once inside, this contemporary style condominium with its functional layout offers a great sense of space. Some key features of this comfortable 2 BEDROOM, 2 BATH residence include vaulted ceilings throughout, a wood burning fireplace in the living room, a separate open dining area adjacent to the kitchen, and the convenience of an inside laundry (washer-dryer included). Recently installed essentials include a tankless water heater (2026) and an upgraded electric subpanel. Enjoy the peek-a-boo ocean VIEW from your exclusive-use BALCONY. The Unit also comes with 2 designated side-by-side parking spaces in the HOA gated garage + 2 storage units. Lunada Terrace
Key facts
- Open dining area
- Vaulted ceilings
- Inside laundry
Tags
Property features AI
Finance
- Financial info: Special assessments
- HOA & community: Part of homeowners association; Monthly association fee; Association pays insurance, water, trash, grounds maintenance; Onsite property management; Community of 18 units; Community features include sidewalks and a park
Exterior
- Parking: Assigned community garage; Front-entry garage, side-by-side configuration; 2 garage spaces (2 total parking spaces)
- Security: Automatic gate
- Utilities: Public sewer; District/public water; Sewer connected; Cable connected; Electricity connected; Water connected
- Home design: Condominium; Multi-family structure; Attached property; Two total stories; One level (unit); Entry on level 2; Unit has a view; 2+ common walls
- Construction: No ADU
- Exterior features: Landscaped; No pool; No fencing
Interior
- Kitchen: Garbage disposal; Microwave; Refrigerator; Electric range; Dishwasher; Corian counters; Dining ell; Tankless water heater
- Bedrooms: Primary bedroom (main level)
- Flooring: Tile; Carpet; Wood
- Bathrooms: One full bathroom; One 3/4 bathroom; Shower in tub; Shower
- Heating & cooling: Radiant heating; Electric heating
- Interior features: Living room balcony; Wired for sound; Cathedral/vaulted ceilings; Sliding glass door(s); Automatic gate; No interior steps
- Laundry & utility: Stackable washer and dryer included
Neighborhood map
What this means for you Summary
Snapshot
- This is a 2-bed/2.0-bath condo listed at $799k.
Deal economics
- At list price, monthly cash flow is $-2k ($-20k/yr) — negative.
- To cash-flow at today's rent, offer at most $503k (37.1% below list).
- To meet the 1% rule (rent ≥ 1% of price), the offer needs to be $485k (39.3% below list).
- Recommended offer: $485k (39.3% below list) — sets the bar for 1% rule.
- Cap rate 3.8% vs local median 1.1% in Palos Verdes Estates — top-decile yield for the area; either an underpriced asset or a hidden risk that comps aren't pricing in. Stress-test before assuming the spread holds.
Location & tenants
- Location reads 68/100 on livability (#271 in CA) — a middle-class / working-renter tenant base. Strengths: schools A+, crime A+, employment A+; Watch: commute C-, amenities F, cost of living F.
- Palos Verdes Peninsula Unified (suburban): math 72% / reading 76% proficiency, ranked #51 of 1,400 in CA (top 4%) — strong family-tenant draw, lease renewals of 3-5y typical; only 3% free/reduced lunch — higher-income household profile.
- Market conditions: Rents rising (+1.8%/yr); 130 active listings in the ZIP; 1 comparable units currently listed for rent nearby; high-income renter base; 19,697 units permitted in Los Angeles County in 2024 (9,426 in 5+ unit buildings).
Forward outlook
- In year one you build about $6k of equity ($6k loan paydown + $409 appreciation (0.1% local appreciation)).
- Los Angeles County population projected at +9% by 2050 — modest demand growth; plan on rents tracking national, not racing it.
- By year 7, paydown + projected appreciation supports a ~$51k cash-out refi (75% LTV) — recoverable capital for the next deal without selling this one.
Negotiation context
- It's been on market 49 days — a 3% lower offer ($775k) is reasonable based on typical stale-listing flexibility.
- 4 sale attempts since 20y ago with the ask held roughly flat each time — persistent listings suggest the price (not the market) is what's stuck; bring a comps-based counter.
- Current owner paid $225k; list at $799k implies a 255% gain — meaningful room to come down on a strong offer.
Questions for the listing agent
- What do current leases actually rent for vs. the listed asking? Can we see a recent rent roll and the last 12 months of T-12 income?
- It's been on market 49 days. Have you received any prior offers? Is the seller open to a 39% concession, seller financing, or rate buy-down credit?
- Built in 1973 — when were the roof, HVAC, electrical panel, plumbing, and water heater last replaced?
- What does the HOA fee cover, when was the last increase, and are there any pending special assessments or reserve-fund shortfalls?
- Any open or pending special assessments — roof, HVAC, plumbing, elevator, façade? What's the per-unit balance and payoff schedule, and is the seller paying it off at close or rolling it to the buyer?
- Is there a deadline driving the sale (1031 exchange, divorce, estate, relocation)? That informs how much negotiation room exists.
- Schools are A-rated — typically a magnet for longer-tenancy family renters. What's the average tenant stay here, and is there a school-zone premium baked into asking?
- The area grade is low — what's the realistic commute time and amenity access for the typical tenant pool here? Any planned neighborhood developments (good or bad) we should know about?
- What's the average days-on-market for RENTAL listings here right now (not sales)? A rising rental-DOM trend means longer vacancies and softer asking-rent achievability than the comps imply.
- What's the recent tenant-quality profile in this submarket — average credit score on applications, eviction rate, late-payment / NSF rate, and stable-employment percentage? A property-management company in the area should have these aggregated.
- How much new apartment / multifamily construction is in the pipeline within 1–3 miles? Heavy new supply (>2% of stock underway) typically softens rents 12–24 months out; light construction supports rent growth.
Investment metrics
- 1% rule
- 0.61% ✗
- Cap rate
- 3.77%
- Cash-on-cash
- -9.00%
- DSCR
- 0.60
- GRM
- 13.7
CMA / ARV
No comps found within radius.
Projected returns pro-forma
0.05% appreciation · 1.78% rent growth · sell at horizon
- IRR
- -12.9%
- Equity multiple
- 0.40×
- Total profit
- $-134,139
- Equity at exit
- $234,053
- IRR
- -7.3%
- Equity multiple
- 0.24×
- Total profit
- $-170,706
- Equity at exit
- $282,981
Cash invested: $223,720 (down + closing). Projections, not guarantees.
Landlord ↔ Tenant lean methodology
- Overall (STATE)
- 18 Strongly Tenant-Friendly
- State California
- 18 Strongly Tenant-Friendly · D+13
- County
- — inherits STATE
- City
- — inherits STATE
ZIP-level market 90274
- Home prices YoY
- 0.0%
- Rents YoY
- 1.8%
- Active inventory
- 130
- Price-to-rent
- 13.7×
Monthly cashflow live
- Estimated rent
- $4,848 medium interval (Pro) →
- Mortgage (P&I)
- −$4,190
- Tax from tax record
- −$489 /mo · $5,871/yr
- Insurance
- −$333
- HOA
- −$496
- Vacancy / Maint / Mgmt
- −$1,018
- Net cashflow
- $-1,678
Break-even live
Sensitivity live
| Price | -10% $-1,226 | -5% $-1,452 | +0% $-1,678 | +5% $-1,904 | +10% $-2,130 |
|---|---|---|---|---|---|
| Rent | -10% $-2,061 | -5% $-1,870 | +0% $-1,678 | +5% $-1,487 | +10% $-1,295 |
| Rate | -1.0pp $-1,276 | -0.5pp $-1,475 | base $-1,678 | +0.5pp $-1,885 | +1.0pp $-2,096 |
UW: 25.0% down · 7.5% · 30yr · 1.5% tax · 5.0% vac · 8.0% maint · 8.0% mgmt
Financing live
Cash to close
- Down payment
- $199,750
- Closing costs
- $23,970
- Reserves months
- —
- Total cash needed
- —
Loan-product check · same deal, 3 products live
Conventional
25% down · 7.5% · 30yr
- Down + closing
- —
- Monthly P&I
- —
- Monthly cashflow
- —
- DSCR
- —
- Eligible?
- —
Personal DTI + credit; lowest rate.
DSCR
20% down · 8.5% · 30yr
- Down + closing
- —
- Monthly P&I
- —
- Monthly cashflow
- —
- DSCR
- —
- Eligible?
- —
No personal income docs; deal must DSCR.
Hard money
10% down · 12.0% · 12mo
- Down + closing
- —
- Monthly P&I
- —
- Monthly cashflow
- —
- DSCR
- —
- Eligible?
- —
Short-term bridge; refi at stabilization.
Rent comps 1 comps
| Address | Beds | Baths | Sqft | Rent | $/sqft | DOM | Units | Dist |
|---|---|---|---|---|---|---|---|---|
| 2400 Palos Verdes Dr W Palos Verdes Estates, CA | 1.0–2.0 | 1.0–2.0 | 936 | $3,750 | $4.01 | 26d | 1 | 0.06mi |
HOA detail condo
- Monthly dues
- $496 · $5,952/yr
- Likely covers
- waterelectricsecurity
- Assessments
- None detected in remarks — confirm with the listing agent.
Listing history 19 events
-
2026-06-21days on market $799,000 Active 49 DOM
-
2026-06-13days on market $799,000 Active 47 DOM
-
2026-06-13days on market $799,000 Active 46 DOM
-
2026-06-09days on market $799,000 Active 43 DOM
-
2026-06-08days on market $799,000 Active 42 DOM
-
2026-06-07days on market $799,000 Active 41 DOM
-
2026-06-04days on market $799,000 Active 38 DOM
-
2026-06-03days on market $799,000 Active 37 DOM
-
2026-06-02days on market $799,000 Active 36 DOM
-
2026-06-01days on market $799,000 Active 35 DOM
-
2026-05-31days on market $799,000 Active 34 DOM
-
2026-04-24$799,000 Active 1162-char remark
-
2007-04-25historical
-
2007-03-30price $639,000
-
2007-02-06historical
-
2007-01-30$649,000
-
2006-10-09$649,000
-
1992-12-15soldstatus $225,000
-
1976-09-13soldstatus $16,000
ⓘ Source: listings_history table (triggers on properties + properties_extension) + one-shot
backfill from property_details.listing_events for pre-trigger history.
Tax reassessment forecast CA · Resets to sale price
- Current annual tax
- $5,871 · $489/mo
- Projected year-2 tax
- $6,072 · $506/mo
- Expected delta
- +$202/yr (+$17/mo · 3.4%)
ⓘ Screening estimate from a state-policy table — verify with the county assessor before closing.
Climate risk First Street
- Flood 1/10 Low FEMA zone X (unshaded) · 0% chance over 30 yrs
- Wildfire 2/10 Low
- Heat 2/10 Low 7 d/yr ≥83°F today · 21 d/yr by 30 yrs out
- Wind 1/10 Low
- Air quality 4/10 Moderate 6 unhealthy d/yr today · 6 by 30 yrs out
Nearby sold comps map
Loading sold comps map…
Walkable amenities ~0.75 mi
Loading nearby amenities…
Taxation est. · year 1
- Rental income
- $58,179
- − Mortgage interest
- −$44,756
- − Property taxes
- −$5,871
- − Insurance
- −$3,995
- − Repairs & maintenance
- −$4,654
- − Management
- −$4,654
- − HOA
- −$5,952
- − Depreciation
- −$23,244
- Taxable loss
- −$34,947
- Est. tax savings @ 24.0%
- +$8,387
- After-tax cash flow
- $-11,749/yr
For passive investors: Depreciation is non-cash, so a rental often shows a tax loss while cash-flowing — sheltering income. Rental losses are passive: they offset passive income freely, and up to $25,000/yr can offset ordinary (W-2) income if you actively participate and your MAGI is under $100k (phasing out to $0 by $150k); unused losses carry forward. On sale, claimed depreciation is recaptured at up to 25%, and gains may owe capital-gains tax (a 1031 exchange can defer both). Figures are a year-1 estimate at your 24.0% rate — not tax advice; consult a CPA.
Schools (NCES district)
- District
- Palos Verdes Peninsula Unified
- NCES district ID
- 0629700
- Math proficiency
- 72% ▲ 1.00%
- Reading proficiency
- 76% ▼ -1.00%
- Median HH income
- $130,734
- Composite
- 71.42/100
- National rank
- #460
- State rank
- #51 of 1400 in CA
Livability — Palos Verdes Estates
- Score
- 68/100
- State rank
- #271
- US rank
- #9184
Category grades
Schools grade is shown separately in the Schools card above.
Census & demographics
- Census place
- Palos Verdes Estates, CA
- County
- Los Angeles County · 9,444,647 people
- Metro
- Los Angeles-Long Beach-Anaheim, CA
- Population (ZIP)
- 25,059
- Household income
- $215,925
- Rent vs Own
- Severe rent burden
- 300.0
Population outlook (Los Angeles County) Hauer SSP2
- Today (2025)
- 10,940,515 people
- By 2030
- 11,256,481 · +2.9%
- By 2040
- 11,729,929 · +7.2%
- By 2050
- 11,948,407 · +9.2%
- By 2075
- 11,818,114 · +8.0%
- By 2100
- 10,842,928 · -0.9%
Race, ethnicity, and origin ACS 2023
- Neighborhood character
- Diverse neighborhood (Simpson 0.58)
- Race & ethnicity
- White 60% Asian 24% Two or more races 9% Hispanic / Latino 6% Black 3%
- Hispanic origin (detail)
- Mexican 4%
- Common ancestry
- Romanian 2% Lithuanian 2% Scotch-Irish 2%
- Foreign-born
- 22% · China, South Korea, Canada
- Languages at home
- 73% English-only · Chinese 8% Other Asian/Pacific 5% Other Indo-European 4%
Political lean MEDSL · Los Angeles
- 2024 margin
- Solid D (+32.9) · D 64.8% · R 31.9% · Other 3.3%
- 2008→2024 swing
- -7.4pp toward R · 2008: 40.4pp · 2024: 32.9pp
- All cycles
- 2024: D+32.9 2020: D+44.2 2016: D+48.0 2012: D+40.0 2008: D+40.4
Not yet ingested
- Civics
- —
Market trends
- HPI YoY
- ▲ 0.05%
- Current HPI
- 331.1402
- Rent YoY
- ▲ 1.78%
- Metro
- Los Angeles-Long Beach-Anaheim, CA
- State GDP YoY
- ▲ 3.21%
- F500 in state
- 116
Industry mix (Fortune 500 HQ in CA)
| Industry | F500 HQs | Revenue |
|---|---|---|
| Technology | 27 | $1,492B |
|
||
| Financial Services | 3 | $174B |
|
||
| Retail | 3 | $44B |
|
||
| Insurance | 3 | $26B |
|
||
| Media / Entertainment | 2 | $115B |
|
||
| Pharmaceuticals / Biotech | 2 | $62B |
|
||
Price history
+4893.8% since first listed9 events — show timeline
- 2026-05-29 Relisted — CRMLS
- 2026-04-24 Listed $799,000 CRMLS
- 2007-04-25 Listing Removed — CRMLS
- 2007-03-30 Price Changed $639,000 CRMLS
- 2007-02-06 Listing Removed — CRMLS
- 2007-01-30 Listed $649,000 CRMLS
- 2006-10-09 Listed $649,000 CRMLS
- 1992-12-15 Sold (Public Records) $225,000 Public Records
- 1976-09-13 Sold (Public Records) $16,000 Public Records
Property tax history
+2.2%/yrLatest (2025): $5,871 · +7.1% YoY. Source: county tax records.
Cash-flow waterfall
monthlySold comps — $/sqft
last 12 mo · ≤1 miLoading sold comps…