 Fourplex
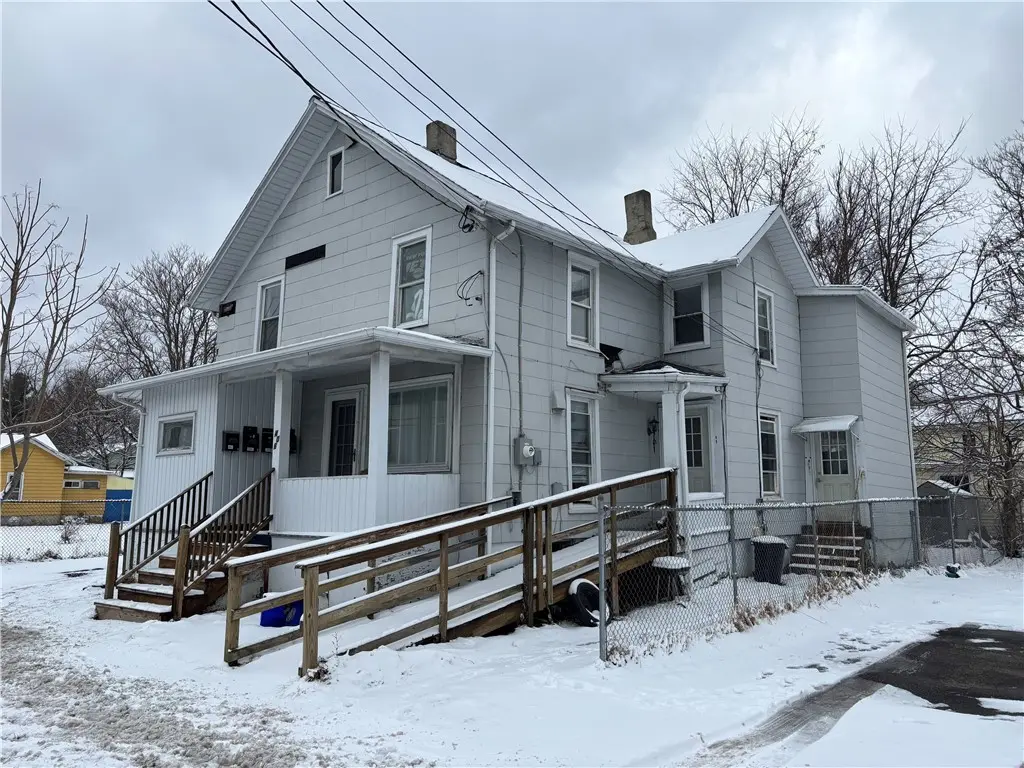
406 Dewitt Ave · Elmira, NY
Flood risk No data
- FEMA flood zone
- —
- Chance of flooding over 30 yrs
- —
- Est. flood insurance / yr
- —
Fire risk No data
- Est. fire insurance / yr
- —
Heat risk No data
- Hot days now (above threshold)
- —
- Hot days in 30 yrs
- —
Wind risk No data
- Chance of severe wind over 30 yrs
- —
Air-quality risk No data
- Unhealthy air days now
- —
- Unhealthy air days in 30 yrs
- —
Risk factors via First Street. Map © Google.
Why this score? — see what drove the B+ grade
The composite is a weighted blend of 9 inputs, each scored 0–100. Each bar is that input's sub-score; the figure is the points it added to the 100-point composite (weight × sub-score).
- Cash flow +30.0/30.0
- 1% rule +10.0/10.0
- DSCR +10.0/10.0
- Appreciation +10.0/10.0
- ARV discount +7.5/15.0
- Livability +3.1/5.0
- Rent growth +2.5/5.0
- Condition / age +2.5/5.0
- Schools +2.4/10.0
$129,900
🖨 Deal sheet (PDF) 📄 Offer letter ✓ Due diligence
Multi-family units
County records classify this as Multi-Family (2-4 Unit). Listing-text estimate: 4 units. confirmed
Listing remarks
Potential for $3,800 per month gross rents! Excellent opportunity to acquire a well-maintained mixed-use 4-unit property in Elmira featuring three residential apartments and one commercial space. The building has been recently updated with modern flooring, refreshed interiors, and overall well-maintained units, making it ideal for both seasoned investors and owner-operators. The residential portion consists of one 1-bedroom apartment renting for $900/month (utilities included except garbage), one 2-bedroom/1-bath apartment renting for $1,200/month (utilities included except garbage), and one 2-bedroom/1-bath apartment renting for $900/month plus gas and garbage. One unit features a beaut
Key facts
- Income potential
- Commercial space
- Updated interiors
Tags
Property features AI
Finance
- Other: Owner pays: other/see remarks; Rent includes: see remarks
- Financial info: Four total units in the building; Unit rents shown for some units: $900, $1,200 (unit-level rent information provided); Operating expense details: see remarks
Exterior
- Parking: Garage with 2 spaces; Additional parking with two or more spaces
- Utilities: Public water connected; Sewer connected
- Home design: Two-story building; Existing/resale property; Composite siding
- Construction: Composite siding construction
- Exterior features: Rectangular lot with 50 x 94 dimensions; Main thoroughfare road frontage
Interior
- Kitchen: Gas water heater (appliance noted)
- Bedrooms: Units include 1-bedroom and 2-bedroom layouts
- Flooring: Luxury vinyl flooring
- Bathrooms: Three full bathrooms and one half bathroom (building total)
- Heating & cooling: Gas heating; Forced air heating; Wall furnaces
- Interior features: Full basement
- Laundry & utility: Multiple separate utility meters (2 gas meters, 1 electric meter)
Neighborhood map
What this means for you Summary
Snapshot
- This is a 4 × 1-bed/?-bath units multifamily listed at $130k.
Deal economics
- At list price, monthly cash flow is $2k ($25k/yr) — positive. Per door: $511/mo.
- The deal already cash-flows at list — no discount required.
- Meets the 1% rule at list price ($4k rent vs $130k).
- Recommended offer: $128k (1.5% below list) — sets the bar for market timing.
- Cap rate 25.2% vs local median 10.1% in Elmira — top-decile yield for the area; either an underpriced asset or a hidden risk that comps aren't pricing in. Stress-test before assuming the spread holds.
Location & tenants
- Location reads 62/100 on livability (#832 in NY) — a middle-class / working-renter tenant base. Strengths: cost of living A+, housing A+, health & safety A+; Watch: crime F, amenities F, commute F.
- Elmira City School District (urban): math 23% / reading 35% proficiency, ranked #580 of 590 in NY (top 98%) — low school quality limits family demand, transient renter base, plan for 1-2y turnover.
- Zoned schools: Ernie Davis Academy (math 5% / reading 31%, grade F, #691 of 729 statewide, top 95%, 802 students, 66% FRL).
- Market conditions: 81 active listings in the ZIP; 4 comparable units currently listed for rent nearby; rentals lingering (median 45d on market — plan ~5-8 weeks vacancy on turnover, expect pricing pressure); 100% of comp listings sitting > 30 days — soft ceiling on asking rent; 91 units permitted in Chemung County in 2024 (63 in 5+ unit buildings).
Forward outlook
- In year one you build about $14k of equity ($898 loan paydown + $13k appreciation (10.0% local appreciation)).
- Chemung County population projected at -17% by 2050 — secular population decline; favor cash flow + early exit over multi-decade hold.
- At projected returns (10.0% appreciation + 3.0% rent growth), your $36k cash investment doubles in ~1 year — after that, you're playing with house money.
- By year 3, paydown + projected appreciation supports a ~$35k cash-out refi (75% LTV) — recoverable capital for the next deal without selling this one.
Negotiation context
- It's been on market 17 days — a 2% lower offer ($128k) is reasonable based on typical stale-listing flexibility.
- 2 sale attempts; this cycle's ask has dropped $20k (13%) from the opening price — seller is motivated, your offer sets the floor, not the list.
- Current owner paid $80k; list at $130k implies a 62% gain — meaningful room to come down on a strong offer.
Risks & watch-outs
- Watch-outs: built in 1910 — expect roof / HVAC / electrical / plumbing capex.
Questions for the listing agent
- Can we see the unit-by-unit rent roll, current vacancy, and any below-market leases? What's the average tenancy length?
- What capital expenditures (roof, boiler, parking lot, exteriors) have been made in the last 5 years, and what's planned in the next 2?
- Built in 1910 — when were the roof, HVAC, electrical panel, plumbing, and water heater last replaced?
- Is there a deadline driving the sale (1031 exchange, divorce, estate, relocation)? That informs how much negotiation room exists.
- Schools are F-rated, which usually means shorter tenancies and higher turnover. Who's the typical renter profile here, and what's been the actual vacancy rate?
- Crime grade is F in this area — have there been break-ins, vandalism, or insurance claims at this property in the last 3 years? What carrier currently insures it and at what premium?
- What's the average days-on-market for RENTAL listings here right now (not sales)? A rising rental-DOM trend means longer vacancies and softer asking-rent achievability than the comps imply.
- What's the recent tenant-quality profile in this submarket — average credit score on applications, eviction rate, late-payment / NSF rate, and stable-employment percentage? A property-management company in the area should have these aggregated.
- How much new apartment / multifamily construction is in the pipeline within 1–3 miles? Heavy new supply (>2% of stock underway) typically softens rents 12–24 months out; light construction supports rent growth.
Investment metrics
- 1% rule
- 2.88% ✓
- Cap rate
- 25.19%
- Cash-on-cash
- 67.50%
- DSCR
- 4.00
- GRM
- 2.9
CMA / ARV
- ARV (median comp)
- $52,654
- List price
- $129,900
- Delta
- 171.59%
- Verdict
- OVERPRICED
- Comps
- 20 within 1.0 mi
Show comp detail 2 sales within ~0.75 mi
| Address | Dist | Beds/Ba | Sqft | Sold | Price | $/sf | Match |
|---|---|---|---|---|---|---|---|
| 503 Lake St | 0.24mi | 4/2.0 (+1) | 2,386 (-3%) | 11mo | $111,340 | $47 | 66 |
| 303 W Clinton St | 0.67mi | 4/2.0 (+1) | 2,191 (-11%) | 15mo | $40,000 | $18 | 30 |
Match score weights: distance 35% · size 25% · config 20% · recency 20%. Top-matched comps best support the ARV.
Projected returns pro-forma
10.0% appreciation · 3.0% rent growth · sell at horizon
- IRR
- 78.8%
- Equity multiple
- 6.53×
- Total profit
- $201,119
- Equity at exit
- $117,024
- IRR
- 72.9%
- Equity multiple
- 14.47×
- Total profit
- $489,918
- Equity at exit
- $252,367
Cash invested: $36,372 (down + closing). Projections, not guarantees.
Landlord ↔ Tenant lean methodology
- Overall (STATE)
- 15 Strongly Tenant-Friendly
- State New York
- 15 Strongly Tenant-Friendly · D+10
- County
- — inherits STATE
- City
- — inherits STATE
ZIP-level market 14901
- Home prices YoY
- 15.9%
- Active inventory
- 81
- Price-to-rent
- 11.6×
Monthly cashflow live
- Estimated rent
- $3,743 medium interval (Pro) →
- Mortgage (P&I)
- −$681
- Tax from tax record
- −$176 /mo · $2,108/yr
- Insurance
- −$54
- HOA
- −$0
- Vacancy / Maint / Mgmt
- −$786
- Net cashflow
- $2,046
Break-even live
Sensitivity live
| Price | -10% $2,119 | -5% $2,083 | +0% $2,046 | +5% $2,009 | +10% $1,972 |
|---|---|---|---|---|---|
| Rent | -10% $1,750 | -5% $1,898 | +0% $2,046 | +5% $2,194 | +10% $2,342 |
| Rate | -1.0pp $2,111 | -0.5pp $2,079 | base $2,046 | +0.5pp $2,012 | +1.0pp $1,978 |
4-unit breakdown (identical units grouped — click to expand)
| Units | Beds | Baths | Est. rent |
|---|---|---|---|
| 4× units | 1 | — | $3,744 |
| #1 | 1 | — | $936 |
| #2 | 1 | — | $936 |
| #3 | 1 | — | $936 |
| #4 | 1 | — | $936 |
| Total (4 units) | $3,743 | ||
UW: 25.0% down · 7.5% · 30yr · 1.5% tax · 5.0% vac · 8.0% maint · 8.0% mgmt
Financing live
Cash to close
- Down payment
- $32,475
- Closing costs
- $3,897
- Reserves months
- —
- Total cash needed
- —
Loan-product check · same deal, 3 products live
Conventional
25% down · 7.5% · 30yr
- Down + closing
- —
- Monthly P&I
- —
- Monthly cashflow
- —
- DSCR
- —
- Eligible?
- —
Personal DTI + credit; lowest rate.
DSCR
20% down · 8.5% · 30yr
- Down + closing
- —
- Monthly P&I
- —
- Monthly cashflow
- —
- DSCR
- —
- Eligible?
- —
No personal income docs; deal must DSCR.
Hard money
10% down · 12.0% · 12mo
- Down + closing
- —
- Monthly P&I
- —
- Monthly cashflow
- —
- DSCR
- —
- Eligible?
- —
Short-term bridge; refi at stabilization.
Rent comps 4 comps
| Address | Beds | Baths | Sqft | Rent | $/sqft | DOM | Units | Dist |
|---|---|---|---|---|---|---|---|---|
| 355 W Clinton St Unit 1 Elmira, NY | 3.0 | 1.5 | 1650 | $1,400 | $0.85 | 45d | 1 | 0.74mi |
| 357 W Clinton St Unit 1 Elmira, NY | 2.0 | 1.5 | 1650 | $1,500 | $0.91 | 45d | 1 | 0.75mi |
| 160 Boardman St Unit B Elmira, NY | 2.0 | 1.0 | 1727 | $800 | $0.46 | 45d | 1 | 0.93mi |
| 715 W Water St Unit A Elmira, NY | 2.0 | 1.0 | 2246 | $1,100 | $0.49 | 45d | 1 | 1.40mi |
Listing history 21 events
-
2026-06-21days on market $129,900 Active 17 DOM
-
2026-06-19days on market $129,900 Active 15 DOM
-
2026-06-18price $129,900 Active 14 DOM
-
2026-06-18days on market $139,900 Active 14 DOM
-
2026-06-17days on market $139,900 Active 13 DOM
-
2026-06-16days on market $139,900 Active 12 DOM
-
2026-06-16price $139,900 Active 11 DOM
-
2026-06-15days on market $149,900 Active 11 DOM
-
2026-06-14days on market $149,900 Active 9 DOM
-
2026-06-12days on market $149,900 Active 8 DOM
-
2026-06-09days on market $149,900 Active 5 DOM
-
2026-06-08days on market $149,900 Active 4 DOM
-
2026-06-07days on market $149,900 Active 3 DOM
-
2026-06-05pricestatusdays on market $149,900 Active 1 DOM
-
2026-05-04status Pending 1736-char remark
-
2026-04-23price $143,000 1736-char remark
-
2026-03-24price $159,900 1736-char remark
-
2026-03-03price $189,900 1736-char remark
-
2026-02-23$199,900 Active 1736-char remark
-
2022-10-03soldstatus $80,000
-
1992-04-22soldstatus $31,000
ⓘ Source: listings_history table (triggers on properties + properties_extension) + one-shot
backfill from property_details.listing_events for pre-trigger history.
Tax reassessment forecast NY · Partial reset (capped growth)
- Current annual tax
- $2,108 · $176/mo
- Projected year-2 tax
- $2,152 · $179/mo
- Expected delta
- +$44/yr (+$4/mo · 2.1%)
ⓘ Screening estimate from a state-policy table — verify with the county assessor before closing.
Nearby sold comps map
Loading sold comps map…
Walkable amenities ~0.75 mi
Loading nearby amenities…
Taxation est. · year 1
- Rental income
- $44,916
- − Mortgage interest
- −$7,276
- − Property taxes
- −$2,108
- − Insurance
- −$650
- − Repairs & maintenance
- −$3,593
- − Management
- −$3,593
- − Depreciation
- −$3,779
- Taxable income
- $23,916
- Est. tax owed @ 24.0%
- −$5,740
- After-tax cash flow
- $18,811/yr
For passive investors: Depreciation is non-cash, so a rental often shows a tax loss while cash-flowing — sheltering income. Rental losses are passive: they offset passive income freely, and up to $25,000/yr can offset ordinary (W-2) income if you actively participate and your MAGI is under $100k (phasing out to $0 by $150k); unused losses carry forward. On sale, claimed depreciation is recaptured at up to 25%, and gains may owe capital-gains tax (a 1031 exchange can defer both). Figures are a year-1 estimate at your 24.0% rate — not tax advice; consult a CPA.
Schools (NCES district)
- District
- Elmira City School District
- NCES district ID
- 3610560
- Math proficiency
- 23% ▼ -7.00%
- Reading proficiency
- 35% ▲ 7.00%
- Median HH income
- $40,180
- Composite
- 24.39/100
- National rank
- #7688
- State rank
- #580 of 590 in NY
Livability — Elmira
- Score
- 62/100
- State rank
- #832
- US rank
- #16139
Category grades
Schools grade is shown separately in the Schools card above.
Census & demographics
- Census place
- Elmira, NY
- City population
- 14,276
- Population (ZIP)
- 14,430
Population outlook (Chemung County) Hauer SSP2
- Today (2025)
- 82,931 people
- By 2030
- 80,356 · -3.1%
- By 2040
- 74,745 · -9.9%
- By 2050
- 69,012 · -16.8%
- By 2075
- 55,689 · -32.8%
- By 2100
- 41,428 · -50.0%
Race, ethnicity, and origin ACS 2023
- Neighborhood character
- Predominantly White (70%)
- Race & ethnicity
- White 70% Black 15% Two or more races 7% Hispanic / Latino 7% Asian 1%
- Hispanic origin (detail)
- Mexican 1% Puerto Rican 3%
- Common ancestry
- Romanian 4% Slovak 3% Iranian 2%
- Foreign-born
- 4% · Canada, China
- Languages at home
- 93% English-only · Spanish 3% Russian/Polish/Slavic 1% Chinese 1%
Political lean MEDSL · Chemung
- 2024 margin
- R (+16.8) · D 41.6% · R 58.4%
- 2008→2024 swing
- -15.6pp toward R · 2008: -1.2pp · 2024: -16.8pp
- All cycles
- 2024: R+16.8 2020: R+13.4 2016: R+20.0 2012: R+2.9 2008: R+1.2
Not yet ingested
- Civics
- —
Market trends
- HPI YoY
- ▲ 32.34%
- Current HPI
- 236.2674
- Rent YoY
- —
- Metro
- —
- State GDP YoY
- ▲ 2.60%
- F500 in state
- 92
Industry mix (Fortune 500 HQ in NY)
| Industry | F500 HQs | Revenue |
|---|---|---|
| Financial Services | 10 | $950B |
|
||
| Consumer Goods | 9 | $162B |
|
||
| Insurance | 4 | $225B |
|
||
| Telecommunications | 2 | $144B |
|
||
| Pharmaceuticals | 2 | $112B |
|
||
| Media / Entertainment | 2 | $69B |
|
||
Price history
+319.0% since first listed11 events — show timeline
- 2026-06-18 Price Changed $129,900 UNYREIS
- 2026-06-15 Price Changed $139,900 UNYREIS
- 2026-06-04 Listed $149,900 UNYREIS
- 2026-05-04 Pending — UNYREIS
- 2026-04-29 Listing Removed — UNYREIS
- 2026-04-23 Price Changed $143,000 UNYREIS
- 2026-03-24 Price Changed $159,900 UNYREIS
- 2026-03-03 Price Changed $189,900 UNYREIS
- 2026-02-23 Listed $199,900 UNYREIS
- 2022-10-03 Sold (Public Records) $80,000 Public Records
- 1992-04-22 Sold (Public Records) $31,000 Public Records
Property tax history
+5.1%/yrLatest (2025): $2,108 · -39.4% YoY. Source: county tax records.
Cash-flow waterfall
monthlySold comps — $/sqft
last 12 mo · ≤1 miLoading sold comps…