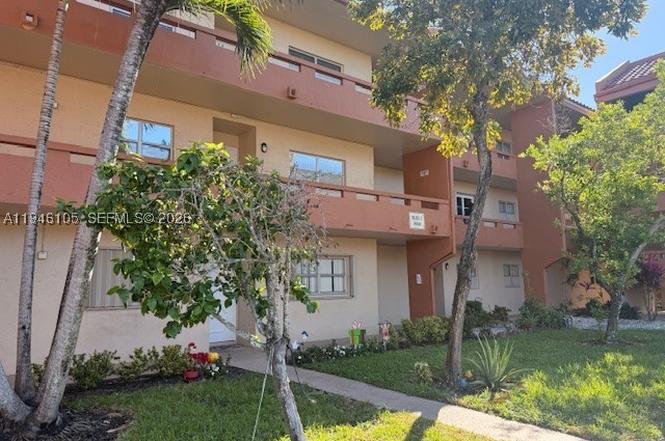
8818 W Mcnab Rd #206 · Tamarac, FL
Flood risk No data
- FEMA flood zone
- —
- Chance of flooding over 30 yrs
- —
- Est. flood insurance / yr
- —
Fire risk No data
- Est. fire insurance / yr
- —
Heat risk No data
- Hot days now (above threshold)
- —
- Hot days in 30 yrs
- —
Wind risk No data
- Chance of severe wind over 30 yrs
- —
Air-quality risk No data
- Unhealthy air days now
- —
- Unhealthy air days in 30 yrs
- —
Risk factors via First Street. Map © Google.
Why this score? — see what drove the C+ grade
The composite is a weighted blend of 9 inputs, each scored 0–100. Each bar is that input's sub-score; the figure is the points it added to the 100-point composite (weight × sub-score).
- Cash flow +24.1/30.0
- 1% rule +10.0/10.0
- DSCR +7.8/10.0
- ARV discount +7.5/15.0
- Schools +4.1/10.0
- Livability +3.8/5.0
- Condition / age +2.5/5.0
- Rent growth +2.0/5.0
- Appreciation +0.0/10.0
$100,000
🖨 Deal sheet (PDF) 📄 Offer letter ✓ Due diligence
Listing remarks
PRICE ADJUSTED for a quick sale. 2/2 condo in original condition- perfect for your personal touch. Balcony enclosed with windows for added living space. This spacious 2/2 offers a fantastic opportunity for those looking to customize their living space to fit their unique style and preferences. Amenities include clubhouse, pool, barbecue area, common laundry, ample guest parking. Over 55 community. Credit score of 680 required by HOA. No rentals permitted
Key facts
- Clubhouse
- Barbecue area
- Common laundry
Tags
Property features AI
Finance
- Financial info: Pets not allowed
- HOA & community: Monthly association fee; Association fee covers amenities, common areas, cable TV, insurance, laundry, grounds maintenance, structure maintenance, parking, sewer, trash, and water; Community amenities: Clubhouse, laundry facilities, barbecue, picnic area, pool, shuffleboard court, elevators; Senior community
Exterior
- Parking: Guest parking; One designated parking space
- Utilities: Cable available
- Home design: Attached property; 3 stories; Entry on level 2
- Construction: Block construction; Year built: Unknown
- Exterior features: Association pool; Association-maintained common areas
Interior
- Kitchen: Dishwasher; Electric range; Microwave
- Flooring: Carpet; Tile
- Bathrooms: 2 full bathrooms
- Heating & cooling: Central heating (electric); Central air conditioning; Ceiling fans
- Interior features: Breakfast bar; Living/Dining room; Bedroom on main level
- Laundry & utility: Common area laundry
Neighborhood map
What this means for you Summary
Snapshot
- This is a 2-bed/2.0-bath condo listed at $100k.
Deal economics
- At list price, monthly cash flow is $198 ($2k/yr) — positive.
- The deal already cash-flows at list — no discount required.
- Meets the 1% rule at list price ($2k rent vs $100k).
- Recommended offer: $88k (12.0% below list) — sets the bar for market timing.
- Cap rate 8.7% vs local median 3.9% in Tamarac — top-decile yield for the area; either an underpriced asset or a hidden risk that comps aren't pricing in. Stress-test before assuming the spread holds.
Location & tenants
- Location reads 76/100 on livability (#239 in FL, #3,785 nationally) — a middle-class / working-renter tenant base. Strengths: housing A+, health & safety A+, cost of living A-; Watch: employment C-, amenities F, commute F.
- Broward (suburban): math 42% / reading 53% proficiency, ranked #46 of 73 in FL (top 63%) — families likely to look elsewhere, expect single-tenant / working-renter base with shorter leases.
- Market conditions: Rents soft (-1.9%/yr); 594 active listings in the ZIP; 40 comparable units currently listed for rent nearby; rentals at typical pace (median 21d on market — plan ~3-4 weeks tenant-placement turnaround); 2,111 units permitted in Broward County in 2024 (1,265 in 5+ unit buildings).
- This rent runs 40% of the median local income ($62k/yr) — at the standard rent-burdened threshold; future hikes will face affordability resistance.
Forward outlook
- Local home prices are declining (-3.0%/yr); year-one equity from $691 of loan paydown is wiped out by about $3k of value loss. Plan a longer hold.
- Broward County population projected at +34% by 2050 — long-run rental-demand tailwind backs the buy-and-hold thesis.
Negotiation context
- It's been on market 157 days — a 12% lower offer ($88k) is reasonable based on typical stale-listing flexibility.
- 2 sale attempts since 10y ago; this cycle's ask has dropped $30k (23%) from the opening price — seller is motivated, your offer sets the floor, not the list.
- Current owner paid $52k; list at $100k implies a 92% gain — meaningful room to come down on a strong offer.
Risks & watch-outs
- Watch-outs: property tax is 3.4% of price; HOA is 29% of rent.
Questions for the listing agent
- It's been on market 157 days. Have you received any prior offers? Is the seller open to a 12% concession, seller financing, or rate buy-down credit?
- Built in 1978 — when were the roof, HVAC, electrical panel, plumbing, and water heater last replaced?
- Property tax is high relative to price — has the assessment been appealed recently, and will the sale trigger a re-assessment?
- What does the HOA fee cover, when was the last increase, and are there any pending special assessments or reserve-fund shortfalls?
- Any open or pending special assessments — roof, HVAC, plumbing, elevator, façade? What's the per-unit balance and payoff schedule, and is the seller paying it off at close or rolling it to the buyer?
- Why hasn't it sold? Are there any deal-killer items the seller is aware of (foundation, flood, title, zoning, code violations)?
- Is there a deadline driving the sale (1031 exchange, divorce, estate, relocation)? That informs how much negotiation room exists.
- Schools are B-rated — typically a magnet for longer-tenancy family renters. What's the average tenant stay here, and is there a school-zone premium baked into asking?
- What's the average days-on-market for RENTAL listings here right now (not sales)? A rising rental-DOM trend means longer vacancies and softer asking-rent achievability than the comps imply.
- What's the recent tenant-quality profile in this submarket — average credit score on applications, eviction rate, late-payment / NSF rate, and stable-employment percentage? A property-management company in the area should have these aggregated.
- How much new apartment / multifamily construction is in the pipeline within 1–3 miles? Heavy new supply (>2% of stock underway) typically softens rents 12–24 months out; light construction supports rent growth.
Investment metrics
- 1% rule
- 2.09% ✓
- Cap rate
- 8.67%
- Cash-on-cash
- 8.50%
- DSCR
- 1.38
- GRM
- 4.0
CMA / ARV
No comps found within radius.
Projected returns pro-forma
-3.0% appreciation · 0.0% rent growth · sell at horizon
- IRR
- -9.5%
- Equity multiple
- 0.67×
- Total profit
- $-9,186
- Equity at exit
- $14,910
- IRR
- -10.7%
- Equity multiple
- 0.52×
- Total profit
- $-13,341
- Equity at exit
- $8,646
Cash invested: $28,000 (down + closing). Projections, not guarantees.
Landlord ↔ Tenant lean methodology
- Overall (STATE)
- 87 Strongly Landlord-Friendly
- State Florida
- 87 Strongly Landlord-Friendly · R+3
- County
- — inherits STATE
- City
- — inherits STATE
ZIP-level market 33321
- Home prices YoY
- -30.4%
- Rents YoY
- -1.9%
- Active inventory
- 594
- Price-to-rent
- 4.0×
Monthly cashflow live
- Estimated rent
- $2,087 high interval (Pro) →
- Mortgage (P&I)
- −$524
- Tax from tax record
- −$286 /mo · $3,435/yr
- Insurance
- −$42
- HOA
- −$598
- Vacancy / Maint / Mgmt
- −$438
- Net cashflow
- $198
Break-even live
Sensitivity live
| Price | -10% $255 | -5% $227 | +0% $198 | +5% $170 | +10% $142 |
|---|---|---|---|---|---|
| Rent | -10% $34 | -5% $116 | +0% $198 | +5% $281 | +10% $363 |
| Rate | -1.0pp $249 | -0.5pp $224 | base $198 | +0.5pp $172 | +1.0pp $146 |
UW: 25.0% down · 7.5% · 30yr · 1.5% tax · 5.0% vac · 8.0% maint · 8.0% mgmt
Financing live
Cash to close
- Down payment
- $25,000
- Closing costs
- $3,000
- Reserves months
- —
- Total cash needed
- —
Loan-product check · same deal, 3 products live
Conventional
25% down · 7.5% · 30yr
- Down + closing
- —
- Monthly P&I
- —
- Monthly cashflow
- —
- DSCR
- —
- Eligible?
- —
Personal DTI + credit; lowest rate.
DSCR
20% down · 8.5% · 30yr
- Down + closing
- —
- Monthly P&I
- —
- Monthly cashflow
- —
- DSCR
- —
- Eligible?
- —
No personal income docs; deal must DSCR.
Hard money
10% down · 12.0% · 12mo
- Down + closing
- —
- Monthly P&I
- —
- Monthly cashflow
- —
- DSCR
- —
- Eligible?
- —
Short-term bridge; refi at stabilization.
Rent comps 40 comps
| Address | Beds | Baths | Sqft | Rent | $/sqft | DOM | Units | Dist |
|---|---|---|---|---|---|---|---|---|
| 9091 Lime Bay Blvd #212 Tamarac, FL | 1.0 | 1.0 | 700 | $1,500 | $2.14 | 11d | 1 | 0.23mi |
| 8601 W McNab Rd Tamarac, FL | 3.0 | 1.0–2.0 | 993 | $2,586 | $2.60 | 0d | 12 | 0.26mi |
| 8310 Sands Point Blvd Unit L305 Tamarac, FL | 1.0 | 1.5 | 825 | $1,600 | $1.94 | 9d | 1 | 0.29mi |
| 9315 Wedgewood Dr Unit B19 Tamarac, FL | 2.0 | 2.0 | 1060 | $2,495 | $2.35 | 25d | 1 | 0.36mi |
| 8311 Sands Point Blvd Unit 106 Tamarac, FL | 1.0 | 1.5 | 825 | $1,750 | $2.12 | 9d | 1 | 0.40mi |
| 9234 Wedgewood Ln Unit D7 Tamarac, FL | 2.0 | 2.0 | 1060 | $2,500 | $2.36 | 25d | 1 | 0.41mi |
| 9311 Wedgewood Dr Unit A19 Tamarac, FL | 2.0 | 2.0 | 1060 | $2,500 | $2.36 | 25d | 1 | 0.43mi |
| 8301 Sands Point Blvd Tamarac, FL | 1.0–2.0 | 1.5–2.0 | 937 | $1,800 | $1.92 | 0d | 2 | 0.44mi |
| 8650 NW 61st St Tamarac, FL | 2.0 | 1.0 | 925 | $3,870 | $4.18 | 25d | 1 | 0.45mi |
| 8650 NW 61st St Tamarac, FL | 2.0 | 1.0 | 925 | $2,881 | $3.11 | 20d | 1 | 0.45mi |
| 8650 NW 61st St Tamarac, FL | 1.0–2.0 | 1.0 | 866 | $2,446 | $2.82 | 0d | 16 | 0.45mi |
| 9301 Lime Bay Blvd Tamarac, FL | 1.0–2.0 | 1.5–2.0 | 850 | $1,800 | $2.12 | 25d | 2 | 0.47mi |
| 9330 Lime Bay Blvd #301 Tamarac, FL | 2.0 | 2.0 | 950 | $1,650 | $1.74 | 25d | 1 | 0.48mi |
| 9360 Lime Bay Blvd #314 Tamarac, FL | 1.0 | 1.5 | 750 | $1,640 | $2.19 | 16d | 1 | 0.50mi |
| 7435 Woodmont Ter #202 Tamarac, FL | 2.0 | 2.0 | 926 | $1,850 | $2.00 | 18d | 1 | 0.51mi |
| 8405 NW 61st St Unit D305 Tamarac, FL | 2.0 | 2.0 | 1040 | $1,770 | $1.70 | 9d | 1 | 0.53mi |
| 7410 Woodmont Ter #204 Tamarac, FL | 2.0 | 2.0 | 926 | $1,880 | $2.03 | 16d | 1 | 0.53mi |
| 9401 Lime Bay Blvd #305 Tamarac, FL | 2.0 | 2.0 | 950 | $1,850 | $1.95 | 25d | 1 | 0.55mi |
| 9065 Preston Pl Unit 16202 Tamarac, FL | 2.0 | 2.0 | 1036 | $2,650 | $2.56 | 25d | 1 | 0.62mi |
| 9499 W McNab Rd #208 Tamarac, FL | 2.0 | 2.0 | 820 | $1,950 | $2.38 | 0d | 1 | 0.62mi |
| 9499 W McNab Rd #208 Tamarac, FL | 2.0 | 2.0 | 820 | $2,050 | $2.50 | 23d | 1 | 0.62mi |
| 8060 Colony Cir N Tamarac, FL | 1.0 | 1.5 | 750 | $1,600 | $2.13 | 19d | 2 | 0.63mi |
| 8060 Colony Cir N #208 Tamarac, FL | 1.0 | 1.5 | 750 | $1,700 | $2.27 | 16d | 1 | 0.64mi |
| 8051 S Colony Cir Apt S205 Tamarac, FL | 2.0 | 2.0 | 949 | $1,750 | $1.84 | 0d | 1 | 0.64mi |
| 9070 Preston Pl #9070 Tamarac, FL | 2.0 | 2.0 | 1036 | $2,500 | $2.41 | 23d | 1 | 0.64mi |
| 8050 W McNab Rd #206 Tamarac, FL | 2.0 | 2.0 | 1040 | $1,890 | $1.82 | 15d | 1 | 0.66mi |
| 8050 W McNab Rd #206 Tamarac, FL | 2.0 | 2.0 | 1040 | $1,890 | $1.82 | 9d | 1 | 0.66mi |
| 5819 Hampton Hills Blvd Tamarac, FL | 2.0 | 2.0 | 1077 | $2,450 | $2.27 | 21d | 1 | 0.69mi |
| 9064 Plymouth Pl #9064 Tamarac, FL | 2.0 | 2.0 | 1036 | $2,550 | $2.46 | 22d | 1 | 0.69mi |
| 8000 Lagos De Campo Blvd Unit A-307 Tamarac, FL | 2.0 | 2.0 | 1078 | $2,250 | $2.09 | 22d | 1 | 0.70mi |
| 8000 Lagos De Campo Blvd Unit A-303 Tamarac, FL | 1.0 | 1.5 | 746 | $1,775 | $2.38 | 25d | 1 | 0.70mi |
| 8205 NW 61st St Unit B202 Tamarac, FL | 2.0 | 2.0 | 1100 | $2,000 | $1.82 | 25d | 1 | 0.71mi |
| 8000 Colony Cir S #305 Tamarac, FL | 2.0 | 2.0 | 949 | $1,800 | $1.90 | 9d | 1 | 0.73mi |
| 8000 S Colony Cir Apt S305 Tamarac, FL | 2.0 | 2.0 | 949 | $1,750 | $1.84 | 0d | 1 | 0.73mi |
| 8000 Colony Cir S Tamarac, FL | 2.0 | 2.0 | 949 | $1,875 | $1.98 | 21d | 2 | 0.73mi |
| 8000 Colony Cir S #309 Tamarac, FL | 2.0 | 2.0 | 949 | $1,950 | $2.05 | 25d | 1 | 0.73mi |
| 9608 W McNab Rd #103 Tamarac, FL | 2.0 | 2.0 | 820 | $1,750 | $2.13 | 23d | 1 | 0.73mi |
| 8002 Lagos de Campo Blvd Unit 101B Tamarac, FL | 2.0 | 2.0 | 1078 | $2,200 | $2.04 | 25d | 1 | 0.74mi |
| 8040 Colony Cir N #207 Tamarac, FL | 1.0 | 1.5 | 750 | $1,475 | $1.97 | 25d | 1 | 0.75mi |
| 7960 Colony Cir N #206 Tamarac, FL | 2.0 | 2.0 | 949 | $1,800 | $1.90 | 25d | 1 | 0.75mi |
HOA detail condo
- Monthly dues
- $598 · $7,176/yr
- Likely covers
- pool
- Assessments
- None detected in remarks — confirm with the listing agent.
Listing history 21 events
-
2026-06-21days on market $100,000 Active 157 DOM
-
2026-06-18days on market $100,000 Active 154 DOM
-
2026-06-17days on market $100,000 Active 153 DOM
-
2026-06-16days on market $100,000 Active 152 DOM
-
2026-06-15days on market $100,000 Active 151 DOM
-
2026-06-13days on market $100,000 Active 149 DOM
-
2026-06-09days on market $100,000 Active 145 DOM
-
2026-06-07days on market $100,000 Active 143 DOM
-
2026-06-04days on market $100,000 Active 140 DOM
-
2026-06-03days on market $100,000 Active 139 DOM
-
2026-06-02days on market $100,000 Active 138 DOM
-
2026-06-01days on market $100,000 Active 137 DOM
-
2026-05-31days on market $100,000 Active 136 DOM
-
2026-03-05price $100,000
-
2026-02-17price $120,000
-
2026-01-15$130,000 Active
-
2016-09-13historical
-
2016-08-08price $70,000
-
2016-04-19$75,000 Active
-
2002-12-04soldstatus $52,000
-
1977-10-01soldstatus $26,000
ⓘ Source: listings_history table (triggers on properties + properties_extension) + one-shot
backfill from property_details.listing_events for pre-trigger history.
Tax reassessment forecast FL · Resets to sale price
- Current annual tax
- $3,435 · $286/mo
- Projected year-2 tax
- $3,435 · $286/mo
- Expected delta
- $0/yr ($0/mo · 0.0%)
ⓘ Screening estimate from a state-policy table — verify with the county assessor before closing.
Nearby sold comps map
Loading sold comps map…
Walkable amenities ~0.75 mi
Loading nearby amenities…
Taxation est. · year 1
- Rental income
- $25,043
- − Mortgage interest
- −$5,602
- − Property taxes
- −$3,435
- − Insurance
- −$500
- − Repairs & maintenance
- −$2,003
- − Management
- −$2,003
- − HOA
- −$7,176
- − Depreciation
- −$2,909
- Taxable income
- $1,415
- Est. tax owed @ 24.0%
- −$340
- After-tax cash flow
- $2,041/yr
For passive investors: Depreciation is non-cash, so a rental often shows a tax loss while cash-flowing — sheltering income. Rental losses are passive: they offset passive income freely, and up to $25,000/yr can offset ordinary (W-2) income if you actively participate and your MAGI is under $100k (phasing out to $0 by $150k); unused losses carry forward. On sale, claimed depreciation is recaptured at up to 25%, and gains may owe capital-gains tax (a 1031 exchange can defer both). Figures are a year-1 estimate at your 24.0% rate — not tax advice; consult a CPA.
Schools (NCES district)
- District
- Broward
- NCES district ID
- 1200180
- Math proficiency
- 42% ▼ -18.00%
- Reading proficiency
- 53% ▼ -5.00%
- Median HH income
- $52,139
- Composite
- 40.88/100
- National rank
- #3621
- State rank
- #46 of 73 in FL
Livability — Tamarac
- Score
- 76/100
- State rank
- #239
- US rank
- #3785
Category grades
Schools grade is shown separately in the Schools card above.
Census & demographics
- Census place
- Tamarac, FL
- County
- Broward County · 1,963,430 people
- City population
- 105,666
- Metro
- Miami-Fort Lauderdale-Pompano Beach, FL
- Population (ZIP)
- 51,216
- Household income
- $62,066
- Rent vs Own
- Severe rent burden
- 1394.0
Population outlook (Broward County) Hauer SSP2
- Today (2025)
- 2,207,033 people
- By 2030
- 2,360,704 · +7.0%
- By 2040
- 2,661,208 · +20.6%
- By 2050
- 2,946,698 · +33.5%
- By 2075
- 3,602,273 · +63.2%
- By 2100
- 3,970,984 · +79.9%
Race, ethnicity, and origin ACS 2023
- Neighborhood character
- Highly diverse neighborhood (Simpson 0.70)
- Race & ethnicity
- Hispanic / Latino 34% White 33% Black 27% Two or more races 20% Asian 3%
- Hispanic origin (detail)
- Mexican 2% Puerto Rican 5% Cuban 5% Dominican 3%
- Common ancestry
- Romanian 3% Hispanic 3% Scotch-Irish 2%
- Foreign-born
- 38% · Canada, Jamaica, Dominican Republic
- Languages at home
- 63% English-only · Spanish 29% French/Haitian/Cajun 4% Other Indo-European 1%
Political lean MEDSL · Broward
- 2024 margin
- D (+17.0) · D 58.0% · R 41.0%
- 2008→2024 swing
- -17.8pp toward R · 2008: 34.7pp · 2024: 17.0pp
- All cycles
- 2024: D+17.0 2020: D+29.8 2016: D+35.0 2012: D+34.9 2008: D+34.7
Not yet ingested
- Civics
- —
Market trends
- HPI YoY
- ▼ -158.63%
- Current HPI
- 362.2989
- Rent YoY
- ▼ -1.86%
- Metro
- Miami-Fort Lauderdale-Pompano Beach, FL
- State GDP YoY
- ▲ 3.28%
- F500 in state
- 36
Industry mix (Fortune 500 HQ in FL)
| Industry | F500 HQs | Revenue |
|---|---|---|
| Industrial Technology | 2 | $29B |
|
||
| Insurance | 2 | $17B |
|
||
| Retail | 1 | $60B |
|
||
| Technology Distribution | 1 | $58B |
|
||
| Homebuilding | 1 | $35B |
|
||
| Technology Manufacturing | 1 | $35B |
|
||
Price history
+284.6% since first listed8 events — show timeline
- 2026-03-05 Price Changed $100,000 MARMLS
- 2026-02-17 Price Changed $120,000 MARMLS
- 2026-01-15 Listed $130,000 MARMLS
- 2016-09-13 Listing Removed — MARMLS
- 2016-08-08 Price Changed $70,000 MARMLS
- 2016-04-19 Listed $75,000 MARMLS
- 2002-12-04 Sold (Public Records) $52,000 Public Records
- 1977-10-01 Sold (Public Records) $26,000 Public Records
Property tax history
+20.1%/yrLatest (2025): $3,435 · +160.8% YoY. Source: county tax records.
Cash-flow waterfall
monthlySold comps — $/sqft
last 12 mo · ≤1 miLoading sold comps…