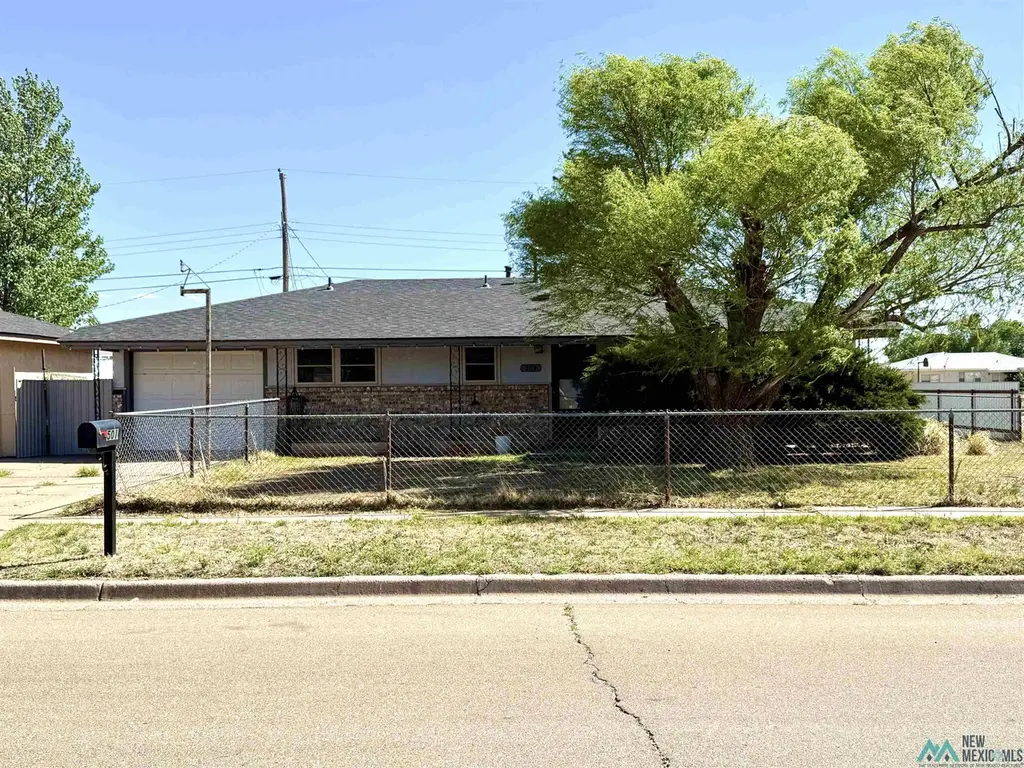
501 Circle Dr · Clovis, NM
Flood risk 1/10 · Minimal
- FEMA flood zone
- X (unshaded)
- Chance of flooding over 30 yrs
- 0.0%
- Est. flood insurance / yr
- $507 – $1,088
Fire risk 5/10 · Moderate
- Est. fire insurance / yr
- $706 – $1,312
Heat risk 4/10 · Minor
- Hot days now (above 97°F)
- 7 days/yr
- Hot days in 30 yrs
- 20 days/yr
Wind risk 2/10 · Minimal
- Chance of severe wind over 30 yrs
- —
Air-quality risk 1/10 · Minimal
- Unhealthy air days now
- 0 days/yr
- Unhealthy air days in 30 yrs
- 0 days/yr
Risk factors via First Street. Map © Google.
Why this score? — see what drove the D grade
The composite is a weighted blend of 9 inputs, each scored 0–100. Each bar is that input's sub-score; the figure is the points it added to the 100-point composite (weight × sub-score).
- Cash flow +15.1/30.0
- ARV discount +7.5/15.0
- DSCR +4.6/10.0
- Rent growth +3.9/5.0
- Schools +3.4/10.0
- 1% rule +3.2/10.0
- Livability +2.8/5.0
- Condition / age +2.5/5.0
- Appreciation +0.0/10.0
$154,900
🖨 Deal sheet (PDF) 📄 Offer letter ✓ Due diligence
Listing remarks MLS
Cute updated 3 bedroom 2 bath home with a single car garage that sits on a large corner lot. Updates include a new roof installed in May of 2022, new flooring in bathrooms, bedrooms and living area, fresh interior and exterior paint, new free-standing range, windows and HVAC. Large fenced backyard with a storage shed.
Key facts
- Gorgeous vanities
- Stainless appliances
- Tile showers
Tags
Property features AI
Exterior
- Parking: Attached garage with automatic opener (1 covered space, 1 total garage space)
- Utilities: Public water; Sewer connected; Electricity connected; Natural gas connected; Natural gas available
- Home design: Single-family residence; One story; Slab foundation
- Construction: Shingle roof; Slab foundation
- Exterior features: Fenced backyard; Shed(s); Shingle roof
Interior
- Kitchen: Dishwasher; Free‑standing range; Refrigerator
- Flooring: Carpet; Laminate; Tile
- Bathrooms: 2 full bathrooms
- Heating & cooling: Forced air heating; Central air; Electric cooling; Ceiling fans
- Interior features: Ceiling fans
- Laundry & utility: Washer; Dryer; Gas water heater; Water heater
Neighborhood map
What this means for you Summary
Snapshot
- This is a 3-bed/2.0-bath other listed at $155k.
Deal economics
- At list price, monthly cash flow is $50 ($598/yr) — positive.
- The deal already cash-flows at list — no discount required.
- To meet the 1% rule (rent ≥ 1% of price), the offer needs to be $127k (17.8% below list).
- Recommended offer: $127k (17.8% below list) — sets the bar for 1% rule.
Location & tenants
- Location reads 56/100 on livability (#171 in NM) — a working-class tenant base; expect higher turnover. Strengths: cost of living A+, housing A+; Watch: health & safety C-, crime F, amenities F.
- Clovis Municipal Schools (town): math 31% / reading 49% proficiency, ranked #13 of 29 in NM (top 45%) — families likely to look elsewhere, expect single-tenant / working-renter base with shorter leases; 66% free/reduced lunch — lower-income household profile, screen leases tightly.
- Zoned schools: Sandia Elementary (329 students, 100% FRL); Marshall Middle (519 students, 100% FRL); Clovis High (math 31% / reading 49%, grade F, #60 of 110 statewide, top 54%, 1,544 students, 0% FRL) — zoned schools at 67% FRL track the district average.
- Market conditions: Rents rising fast (+5.5%/yr); 471 active listings in the ZIP; 9 comparable units currently listed for rent nearby; rentals lingering (median 46d on market — plan ~5-8 weeks vacancy on turnover, expect pricing pressure); 100% of comp listings sitting > 30 days — soft ceiling on asking rent; 169 units permitted in Curry County in 2024 (0 in 5+ unit buildings).
Forward outlook
- Local home prices are declining (-3.0%/yr); year-one equity from $1k of loan paydown is wiped out by about $5k of value loss. Plan a longer hold.
- Curry County population projected at -13% by 2050 — secular population decline; favor cash flow + early exit over multi-decade hold.
Negotiation context
- Only 8 days on market — expect competitive offers; lowballing is unlikely to land.
- 2 sale attempts since 4y ago with the ask held roughly flat each time — persistent listings suggest the price (not the market) is what's stuck; bring a comps-based counter.
Risks & watch-outs
- Climate carrying-cost: moderate wildfire risk — expect insurance premiums to compound above CPI over the hold.
Questions for the listing agent
- Built in 1963 — when were the roof, HVAC, electrical panel, plumbing, and water heater last replaced?
- Is there a deadline driving the sale (1031 exchange, divorce, estate, relocation)? That informs how much negotiation room exists.
- Schools are F-rated, which usually means shorter tenancies and higher turnover. Who's the typical renter profile here, and what's been the actual vacancy rate?
- Crime grade is F in this area — have there been break-ins, vandalism, or insurance claims at this property in the last 3 years? What carrier currently insures it and at what premium?
- The area grade is low — what's the realistic commute time and amenity access for the typical tenant pool here? Any planned neighborhood developments (good or bad) we should know about?
- What's the average days-on-market for RENTAL listings here right now (not sales)? A rising rental-DOM trend means longer vacancies and softer asking-rent achievability than the comps imply.
- What's the recent tenant-quality profile in this submarket — average credit score on applications, eviction rate, late-payment / NSF rate, and stable-employment percentage? A property-management company in the area should have these aggregated.
- How much new for-sale + rental construction is in the pipeline within 1–3 miles? Heavy new supply typically softens prices + rents 12–24 months out; constrained supply supports both.
Investment metrics
- 1% rule
- 0.82% ✗
- Cap rate
- 6.68%
- Cash-on-cash
- 1.38%
- DSCR
- 1.06
- GRM
- 10.1
CMA / ARV
No comps found within radius.
Projected returns pro-forma
-3.0% appreciation · 5.54% rent growth · sell at horizon
- IRR
- -11.6%
- Equity multiple
- 0.57×
- Total profit
- $-18,641
- Equity at exit
- $23,096
- IRR
- 0.6%
- Equity multiple
- 1.05×
- Total profit
- $2,067
- Equity at exit
- $13,393
Cash invested: $43,372 (down + closing). Projections, not guarantees.
Landlord ↔ Tenant lean methodology
- Overall (STATE)
- 55 Moderately Landlord-Leaning
- State New Mexico
- 55 Moderately Landlord-Leaning · D+3
- County
- — inherits STATE
- City
- — inherits STATE
ZIP-level market 88101
- Rents YoY
- 5.5%
- Active inventory
- 471
- Price-to-rent
- 10.1×
Monthly cashflow live
- Estimated rent
- $1,273 high interval (Pro) →
- Mortgage (P&I)
- −$812
- Tax from tax record
- −$79 /mo · $947/yr
- Insurance
- −$65
- HOA
- −$0
- Vacancy / Maint / Mgmt
- −$267
- Net cashflow
- $50
Break-even live
Sensitivity live
| Price | -10% $138 | -5% $94 | +0% $50 | +5% $6 | +10% $-38 |
|---|---|---|---|---|---|
| Rent | -10% $-51 | -5% $0 | +0% $50 | +5% $100 | +10% $150 |
| Rate | -1.0pp $128 | -0.5pp $89 | base $50 | +0.5pp $10 | +1.0pp $-31 |
UW: 25.0% down · 7.5% · 30yr · 1.5% tax · 5.0% vac · 8.0% maint · 8.0% mgmt
Financing live
Cash to close
- Down payment
- $38,725
- Closing costs
- $4,647
- Reserves months
- —
- Total cash needed
- —
Loan-product check · same deal, 3 products live
Conventional
25% down · 7.5% · 30yr
- Down + closing
- —
- Monthly P&I
- —
- Monthly cashflow
- —
- DSCR
- —
- Eligible?
- —
Personal DTI + credit; lowest rate.
DSCR
20% down · 8.5% · 30yr
- Down + closing
- —
- Monthly P&I
- —
- Monthly cashflow
- —
- DSCR
- —
- Eligible?
- —
No personal income docs; deal must DSCR.
Hard money
10% down · 12.0% · 12mo
- Down + closing
- —
- Monthly P&I
- —
- Monthly cashflow
- —
- DSCR
- —
- Eligible?
- —
Short-term bridge; refi at stabilization.
Rent comps 9 comps
| Address | Beds | Baths | Sqft | Rent | $/sqft | DOM | Units | Dist |
|---|---|---|---|---|---|---|---|---|
| 532 Circle Dr Clovis, NM | 3.0 | 1.5 | 1114 | $1,100 | $0.99 | 45d | 1 | 0.08mi |
| 1509 W Llano Estacado Blvd Unit b Clovis, NM | 2.0 | 2.0 | 912 | $1,250 | $1.37 | 45d | 1 | 0.26mi |
| 513 Tucker Ave Clovis, NM | 3.0 | 2.0 | 1168 | $1,150 | $0.98 | 45d | 1 | 0.55mi |
| 3205 N Main St Unit 301 Clovis, NM | 3.0 | 2.0 | 1017 | $1,350 | $1.33 | 45d | 1 | 0.72mi |
| 2100 Mitchell St Unit 14 Clovis, NM | 2.0 | 1.0 | 743 | $750 | $1.01 | 45d | 1 | 0.96mi |
| 109 State Ave Clovis, NM | 2.0 | 1.0 | 816 | $2,000 | $2.45 | 45d | 1 | 1.09mi |
| 1500 Echols Ave Clovis, NM | 2.0 | 1.0–2.0 | 912 | $948 | $1.04 | 45d | 5 | 1.29mi |
| 2517 Ross St Clovis, NM | 2.0 | 1.0 | 991 | $950 | $0.96 | 45d | 1 | 1.37mi |
| 1808 Debra St Clovis, NM | 3.0 | 2.5 | 1412 | $1,400 | $0.99 | 45d | 1 | 1.38mi |
Listing history 5 events
-
2026-05-02status Pending
-
2026-04-23$154,900 Active
-
2022-09-12soldstatus
-
2022-09-09soldstatus 319-char remark
Show marketing remark (319 chars)
Cute updated 3 bedroom 2 bath home with a single car garage that sits on a large corner lot. Updates include a new roof installed in May of 2022, new flooring in bathrooms, bedrooms and living area, fresh interior and exterior paint, new free-standing range, windows and HVAC. Large fenced backyard with a storage shed.
-
2022-07-20$138,500 319-char remark
Show marketing remark (319 chars)
Cute updated 3 bedroom 2 bath home with a single car garage that sits on a large corner lot. Updates include a new roof installed in May of 2022, new flooring in bathrooms, bedrooms and living area, fresh interior and exterior paint, new free-standing range, windows and HVAC. Large fenced backyard with a storage shed.
ⓘ Source: listings_history table (triggers on properties + properties_extension) + one-shot
backfill from property_details.listing_events for pre-trigger history.
Tax reassessment forecast NM · Resets to sale price
- Current annual tax
- $947 · $79/mo
- Projected year-2 tax
- $1,239 · $103/mo
- Expected delta
- +$292/yr (+$24/mo · 30.8%)
ⓘ Screening estimate from a state-policy table — verify with the county assessor before closing.
Climate risk First Street
- Flood 1/10 Low FEMA zone X (unshaded) · 0% chance over 30 yrs
- Wildfire 5/10 Major
- Heat 4/10 Moderate 7 d/yr ≥97°F today · 20 d/yr by 30 yrs out
- Wind 2/10 Low
- Air quality 1/10 Low 0 unhealthy d/yr today · 0 by 30 yrs out
Nearby sold comps map
Loading sold comps map…
Walkable amenities ~0.75 mi
Loading nearby amenities…
Taxation est. · year 1
- Rental income
- $15,276
- − Mortgage interest
- −$8,677
- − Property taxes
- −$947
- − Insurance
- −$774
- − Repairs & maintenance
- −$1,222
- − Management
- −$1,222
- − Depreciation
- −$4,506
- Taxable loss
- −$2,073
- Est. tax savings @ 24.0%
- +$498
- After-tax cash flow
- $1,096/yr
For passive investors: Depreciation is non-cash, so a rental often shows a tax loss while cash-flowing — sheltering income. Rental losses are passive: they offset passive income freely, and up to $25,000/yr can offset ordinary (W-2) income if you actively participate and your MAGI is under $100k (phasing out to $0 by $150k); unused losses carry forward. On sale, claimed depreciation is recaptured at up to 25%, and gains may owe capital-gains tax (a 1031 exchange can defer both). Figures are a year-1 estimate at your 24.0% rate — not tax advice; consult a CPA.
Schools (NCES district)
- District
- Clovis Municipal Schools
- NCES district ID
- 3500570
- Math proficiency
- 31% ▲ 6.00%
- Reading proficiency
- 49% ▲ 14.00%
- Median HH income
- $40,532
- Composite
- 33.52/100
- National rank
- #5435
- State rank
- #13 of 29 in NM
Livability — Clovis
- Score
- 56/100
- State rank
- #171
- US rank
- #22374
Category grades
Schools grade is shown separately in the Schools card above.
Census & demographics
- Census place
- Clovis, NM
- County
- Curry County · 44,846 people
- City population
- 44,846
- Metro
- Clovis, NM
- Population (ZIP)
- 44,846
- Household income
- $56,587
- Rent vs Own
- Severe rent burden
- 1724.0
Population outlook (Curry County) Hauer SSP2
- Today (2025)
- 48,742 people
- By 2030
- 47,759 · -2.0%
- By 2040
- 45,444 · -6.8%
- By 2050
- 42,403 · -13.0%
- By 2075
- 33,878 · -30.5%
- By 2100
- 22,414 · -54.0%
Race, ethnicity, and origin ACS 2023
- Neighborhood character
- Diverse neighborhood (Simpson 0.60)
- Race & ethnicity
- Hispanic / Latino 47% White 42% Two or more races 14% Black 5% Asian 2% Native American 1%
- Hispanic origin (detail)
- Mexican 36%
- Common ancestry
- Slovak 2% Romanian 2% Lithuanian 1%
- Foreign-born
- 8% · Canada
- Languages at home
- 73% English-only · Spanish 25%
Political lean MEDSL · Curry
- 2024 margin
- Solid R (+42.6) · D 27.8% · R 70.4% · Other 1.8%
- 2008→2024 swing
- -8.5pp toward R · 2008: -34.1pp · 2024: -42.6pp
- All cycles
- 2024: R+42.6 2020: R+40.6 2016: R+42.4 2012: R+38.6 2008: R+34.1
Not yet ingested
- Civics
- —
Market trends
- HPI YoY
- ▼ -150.79%
- Current HPI
- 121.1877
- Rent YoY
- ▲ 5.54%
- Metro
- Clovis, NM
- State GDP YoY
- —
- F500 in state
- 0
Price history
+11.8% since first listed5 events — show timeline
- 2026-05-02 Pending — NMMLS
- 2026-04-23 Listed $154,900 NMMLS
- 2022-09-12 Sold (Public Records) — Public Records
- 2022-09-09 Sold (MLS) — NMMLS
- 2022-07-20 Listed $138,500 NMMLS
Property tax history
+10.7%/yrLatest (2025): $947 · +3.6% YoY. Source: county tax records.
Cash-flow waterfall
monthlySold comps — $/sqft
last 12 mo · ≤1 miLoading sold comps…