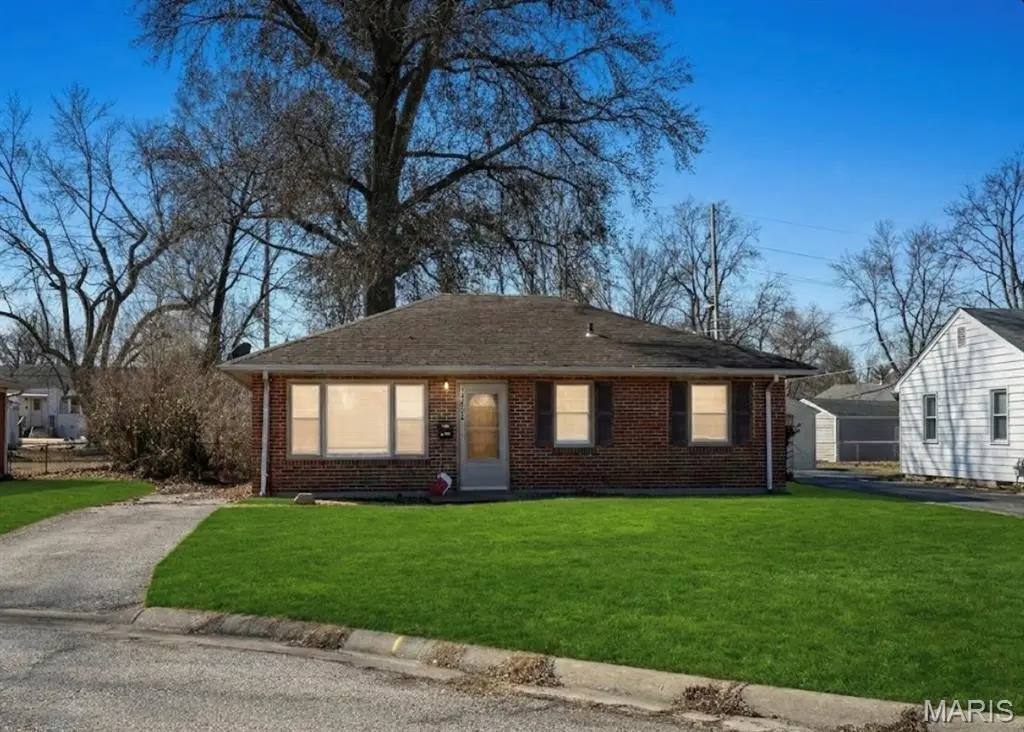
11006 Saint Nicholas Ct · St. Ann, MO
Flood risk 1/10 · Minimal
- FEMA flood zone
- X (unshaded)
- Chance of flooding over 30 yrs
- 0.0%
- Est. flood insurance / yr
- $507 – $1,088
Fire risk 1/10 · Minimal
- Est. fire insurance / yr
- $1,054 – $1,958
Heat risk 4/10 · Minor
- Hot days now (above 105°F)
- 7 days/yr
- Hot days in 30 yrs
- 21 days/yr
Wind risk 2/10 · Minimal
- Chance of severe wind over 30 yrs
- 1.0%
Air-quality risk 2/10 · Minimal
- Unhealthy air days now
- 1 days/yr
- Unhealthy air days in 30 yrs
- 3 days/yr
Risk factors via First Street. Map © Google.
Why this score? — see what drove the C- grade
The composite is a weighted blend of 9 inputs, each scored 0–100. Each bar is that input's sub-score; the figure is the points it added to the 100-point composite (weight × sub-score).
- Cash flow +19.6/30.0
- ARV discount +10.9/15.0
- DSCR +6.2/10.0
- 1% rule +4.7/10.0
- Rent growth +3.5/5.0
- Livability +2.5/5.0
- Condition / age +2.5/5.0
- Schools +1.7/10.0
- Appreciation +0.0/10.0
$140,000
🖨 Deal sheet (PDF) 📄 Offer letter ✓ Due diligence
Listing remarks MLS
Located on a quiet cul-de-sac at 11006 Saint Nicholas Ct, this tenant-occupied home offers immediate income potential and long-term value. Featuring a solid brick exterior, functional layout, and spacious yard, this property is ideal for investors looking to expand their portfolio with a performing rental. Conveniently located near major highways, shopping, and local amenities, this home combines strong rental appeal with a desirable neighborhood setting. Please do not disturb tenants. Showings available with accepted contract or approved access.
Key facts
- Spacious yard
- Functional layout
- Solid brick exterior
Tags
Neighborhood map
What this means for you Summary
Snapshot
- This is a 3-bed/1.0-bath single-family listed at $140k.
Deal economics
- At list price, monthly cash flow is $162 ($2k/yr) — positive.
- The deal already cash-flows at list — no discount required.
- To meet the 1% rule (rent ≥ 1% of price), the offer needs to be $136k (3.2% below list).
- Recommended offer: $132k (6.0% below list) — sets the bar for market timing.
Location & tenants
- Location reads: area grade C — affects rentability + tenant quality, not the cash-flow math above.
- Ritenour (suburban): math 13% / reading 27% proficiency, ranked #304 of 324 in MO (top 94%) — low school quality limits family demand, transient renter base, plan for 1-2y turnover; 66% free/reduced lunch — lower-income household profile, screen leases tightly.
- Market conditions: Rents rising fast (+4.1%/yr); 62 active listings in the ZIP; 14 comparable units currently listed for rent nearby; rentals at typical pace (median 25d on market — plan ~3-4 weeks tenant-placement turnaround); 920 units permitted in St. Louis County in 2024 (250 in 5+ unit buildings).
- This rent runs 32% of the median local income ($52k/yr) — at the standard rent-burdened threshold; future hikes will face affordability resistance.
Forward outlook
- Local home prices are declining (-3.0%/yr); year-one equity from $968 of loan paydown is wiped out by about $4k of value loss. Plan a longer hold.
Negotiation context
- It's been on market 88 days — a 6% lower offer ($132k) is reasonable based on typical stale-listing flexibility.
Risks & watch-outs
- Watch-outs: built in 1949 — expect roof / HVAC / electrical / plumbing capex.
Questions for the listing agent
- It's been on market 88 days. Have you received any prior offers? Is the seller open to a 6% concession, seller financing, or rate buy-down credit?
- Built in 1949 — when were the roof, HVAC, electrical panel, plumbing, and water heater last replaced?
- Why hasn't it sold? Are there any deal-killer items the seller is aware of (foundation, flood, title, zoning, code violations)?
- Is there a deadline driving the sale (1031 exchange, divorce, estate, relocation)? That informs how much negotiation room exists.
- What's the average days-on-market for RENTAL listings here right now (not sales)? A rising rental-DOM trend means longer vacancies and softer asking-rent achievability than the comps imply.
- What's the recent tenant-quality profile in this submarket — average credit score on applications, eviction rate, late-payment / NSF rate, and stable-employment percentage? A property-management company in the area should have these aggregated.
- How much new for-sale + rental construction is in the pipeline within 1–3 miles? Heavy new supply typically softens prices + rents 12–24 months out; constrained supply supports both.
Investment metrics
- 1% rule
- 0.97% ✗
- Cap rate
- 7.68%
- Cash-on-cash
- 4.95%
- DSCR
- 1.22
- GRM
- 8.6
CMA / ARV
- ARV (median comp)
- $151,597
- List price
- $140,000
- Delta
- -7.65%
- Verdict
- FAIR
- Comps
- 20 within 1.0 mi
Show comp detail 12 sales within ~0.75 mi
| Address | Dist | Beds/Ba | Sqft | Sold | Price | $/sf | Match |
|---|---|---|---|---|---|---|---|
| 11041 Saint Pius Ln | 0.05mi | 2/2.0 (-1) | 792 (-7%) | 1mo | $164,900 | $208 | 76 |
| 4325 Saint Dominic Ln | 0.41mi | 2/1.0 (-1) | 850 (0%) | 0mo | $140,000 | $165 | 75 |
| 11218 Saint Shawn Ln | 0.49mi | 3/1.0 | 840 (-1%) | 1mo | $154,900 | $184 | 75 |
| 4224 Ashby Rd | 0.36mi | 2/1.5 (-1) | 900 (+6%) | 1mo | $172,500 | $192 | 66 |
| 11237 Saint Shawn Ln | 0.50mi | 3/1.0 | 840 (-1%) | 12mo | $185,000 | $220 | 65 |
| 11226 Saint Matthias Ln | 0.57mi | 3/1.0 | 840 (-1%) | 9mo | $150,000 | $179 | 64 |
| 11042 Saint Pius Ln | 0.07mi | 2/1.0 (-1) | 950 (+12%) | 12mo | $154,900 | $163 | 62 |
| 11264 Saint Shawn Ln | 0.56mi | 2/1.0 (-1) | 846 (-0%) | 9mo | $189,900 | $224 | 61 |
| 4142 Wright Ave | 0.38mi | 2/1.0 (-1) | 912 (+7%) | 14mo | $125,900 | $138 | 54 |
| 11272 Saint Shawn Ln | 0.57mi | 2/1.0 (-1) | 816 (-4%) | 10mo | $92,000 | $113 | 53 |
| 10753 Saint Stephen Ln | 0.73mi | 2/1.5 (-1) | 792 (-7%) | 3mo | $179,900 | $227 | 45 |
| 3969 Ashby Rd | 0.72mi | 2/1.0 (-1) | 888 (+4%) | 16mo | $75,000 | $84 | 41 |
Match score weights: distance 35% · size 25% · config 20% · recency 20%. Top-matched comps best support the ARV.
Projected returns pro-forma
-3.0% appreciation · 4.14% rent growth · sell at horizon
- IRR
- -7.4%
- Equity multiple
- 0.72×
- Total profit
- $-10,824
- Equity at exit
- $20,874
- IRR
- 3.5%
- Equity multiple
- 1.26×
- Total profit
- $10,385
- Equity at exit
- $12,105
Cash invested: $39,200 (down + closing). Projections, not guarantees.
Landlord ↔ Tenant lean methodology
- Overall (STATE)
- 81 Strongly Landlord-Friendly
- State Missouri
- 81 Strongly Landlord-Friendly · R+10
- County
- — inherits STATE
- City
- — inherits STATE
ZIP-level market 63074
- Rents YoY
- 4.1%
- Active inventory
- 62
- Price-to-rent
- 8.6×
Monthly cashflow live
- Estimated rent
- $1,355 high interval (Pro) →
- Mortgage (P&I)
- −$734
- Tax from tax record
- −$116 /mo · $1,397/yr
- Insurance
- −$58
- HOA
- −$0
- Vacancy / Maint / Mgmt
- −$285
- Net cashflow
- $162
Break-even live
Sensitivity live
| Price | -10% $241 | -5% $201 | +0% $162 | +5% $122 | +10% $83 |
|---|---|---|---|---|---|
| Rent | -10% $55 | -5% $108 | +0% $162 | +5% $215 | +10% $269 |
| Rate | -1.0pp $232 | -0.5pp $197 | base $162 | +0.5pp $126 | +1.0pp $89 |
UW: 25.0% down · 7.5% · 30yr · 1.5% tax · 5.0% vac · 8.0% maint · 8.0% mgmt
Financing live
Cash to close
- Down payment
- $35,000
- Closing costs
- $4,200
- Reserves months
- —
- Total cash needed
- —
Loan-product check · same deal, 3 products live
Conventional
25% down · 7.5% · 30yr
- Down + closing
- —
- Monthly P&I
- —
- Monthly cashflow
- —
- DSCR
- —
- Eligible?
- —
Personal DTI + credit; lowest rate.
DSCR
20% down · 8.5% · 30yr
- Down + closing
- —
- Monthly P&I
- —
- Monthly cashflow
- —
- DSCR
- —
- Eligible?
- —
No personal income docs; deal must DSCR.
Hard money
10% down · 12.0% · 12mo
- Down + closing
- —
- Monthly P&I
- —
- Monthly cashflow
- —
- DSCR
- —
- Eligible?
- —
Short-term bridge; refi at stabilization.
Rent comps 14 comps
| Address | Beds | Baths | Sqft | Rent | $/sqft | DOM | Units | Dist |
|---|---|---|---|---|---|---|---|---|
| 4616 Country Ln St Ann, MO | 2.0 | 1.0–2.0 | 758 | $1,505 | $1.99 | 3d | 9 | 0.24mi |
| 10145 Cabana Club Dr St Ann, MO | 1.0–2.0 | 1.0–2.0 | 776 | $1,060 | $1.37 | 44d | 8 | 0.42mi |
| 11276 Liana Ln Saint Ann, MO | 2.0 | 1.0 | 780 | $1,189 | $1.52 | 5d | 1 | 0.55mi |
| 4120 Geraldine Ave St Ann, MO | 2.0 | 1.5 | 922 | $1,200 | $1.30 | 18d | 1 | 0.59mi |
| 10742 Tropic Dr Unit VACANT St Ann, MO | 2.0 | 1.0 | 800 | $1,200 | $1.50 | 44d | 1 | 0.63mi |
| 10788 Tropic Dr Saint Ann, MO | 2.0 | 1.0 | 828 | $1,260 | $1.52 | 44d | 1 | 0.70mi |
| 3961 Jane Ave Unit 3963 St Ann, MO | 2.0 | 1.0 | 750 | $1,195 | $1.59 | 15d | 1 | 0.79mi |
| 10069 Livingston Ave St Ann, MO | 2.0 | 1.0 | 875 | $1,100 | $1.26 | 24d | 1 | 0.87mi |
| 9807 Guthrie Ave Saint Louis, MO | 3.0 | 2.0 | 1068 | $1,700 | $1.59 | 24d | 1 | 1.07mi |
| 3529 Saint Joachim Ln Unit NA St Ann, MO | 2.0 | 1.0 | 900 | $1,450 | $1.61 | 21d | 1 | 1.31mi |
| 3529 Saint Joachim Ln Saint Ann, MO | 2.0 | 1.0 | 900 | $1,450 | $1.61 | 24d | 1 | 1.31mi |
| 9675 Muriel Ave Unit 9627 Overland, MO | 2.0 | 1.5 | 830 | $1,200 | $1.45 | 44d | 1 | 1.34mi |
| 9675 Muriel Ave Unit 9733 Overland, MO | 2.0 | 1.5 | 830 | $1,200 | $1.45 | 4d | 1 | 1.34mi |
| 9448 Harold Dr Saint Louis, MO | 2.0 | 1.0 | 864 | $1,495 | $1.73 | 44d | 1 | 1.44mi |
Listing history 3 events
-
2026-02-27$140,000 Active 552-char remark
Show marketing remark (552 chars)
Located on a quiet cul-de-sac at 11006 Saint Nicholas Ct, this tenant-occupied home offers immediate income potential and long-term value. Featuring a solid brick exterior, functional layout, and spacious yard, this property is ideal for investors looking to expand their portfolio with a performing rental. Conveniently located near major highways, shopping, and local amenities, this home combines strong rental appeal with a desirable neighborhood setting. Please do not disturb tenants. Showings available with accepted contract or approved access.
-
1995-03-24soldstatus
-
1994-12-06soldstatus
ⓘ Source: listings_history table (triggers on properties + properties_extension) + one-shot
backfill from property_details.listing_events for pre-trigger history.
Tax reassessment forecast MO · Resets to sale price
- Current annual tax
- $1,397 · $116/mo
- Projected year-2 tax
- $1,397 · $116/mo
- Expected delta
- $0/yr ($0/mo · 0.0%)
ⓘ Screening estimate from a state-policy table — verify with the county assessor before closing.
Climate risk First Street
- Flood 1/10 Low FEMA zone X (unshaded) · 0% chance over 30 yrs
- Wildfire 1/10 Low
- Heat 4/10 Moderate 7 d/yr ≥105°F today · 21 d/yr by 30 yrs out
- Wind 2/10 Low 100% chance of damaging wind over 30 yrs
- Air quality 2/10 Low 1 unhealthy d/yr today · 3 by 30 yrs out
Nearby sold comps map
Loading sold comps map…
Walkable amenities ~0.75 mi
Loading nearby amenities…
Taxation est. · year 1
- Rental income
- $16,264
- − Mortgage interest
- −$7,842
- − Property taxes
- −$1,397
- − Insurance
- −$700
- − Repairs & maintenance
- −$1,301
- − Management
- −$1,301
- − Depreciation
- −$4,073
- Taxable loss
- −$350
- Est. tax savings @ 24.0%
- +$84
- After-tax cash flow
- $2,026/yr
For passive investors: Depreciation is non-cash, so a rental often shows a tax loss while cash-flowing — sheltering income. Rental losses are passive: they offset passive income freely, and up to $25,000/yr can offset ordinary (W-2) income if you actively participate and your MAGI is under $100k (phasing out to $0 by $150k); unused losses carry forward. On sale, claimed depreciation is recaptured at up to 25%, and gains may owe capital-gains tax (a 1031 exchange can defer both). Figures are a year-1 estimate at your 24.0% rate — not tax advice; consult a CPA.
Schools (NCES district)
- District
- Ritenour
- NCES district ID
- 2926640
- Math proficiency
- 13% ▼ -14.00%
- Reading proficiency
- 27% ▼ -7.00%
- Median HH income
- $41,410
- Composite
- 17.04/100
- National rank
- #9125
- State rank
- #304 of 324 in MO
Livability — St. Ann
No livability data for this city. (Only ~50 U.S. cities are tracked.)
Census & demographics
- Census place
- St. Ann, MO
- County
- Saint Louis County · 888,823 people
- City population
- 16,237
- Metro
- St. Louis, MO-IL
- Population (ZIP)
- 15,793
- Household income
- $51,610
- Rent vs Own
- Severe rent burden
- 782.0
Population outlook (St. Louis County) Hauer SSP2
- Today (2025)
- 1,025,227 people
- By 2030
- 1,028,023 · +0.3%
- By 2040
- 1,020,940 · -0.4%
- By 2050
- 1,007,280 · -1.8%
- By 2075
- 987,277 · -3.7%
- By 2100
- 921,984 · -10.1%
Race, ethnicity, and origin ACS 2023
- Neighborhood character
- Diverse neighborhood (Simpson 0.65)
- Race & ethnicity
- White 50% Black 27% Hispanic / Latino 19% Two or more races 5% Asian 2%
- Hispanic origin (detail)
- Mexican 16%
- Common ancestry
- Lithuanian 2% Italian 1% Romanian 1%
- Foreign-born
- 13% · Canada, China
- Languages at home
- 80% English-only · Spanish 17% Chinese 1% German/W. Germanic 1%
Political lean MEDSL · St. Louis
- 2024 margin
- Strong D (+23.4) · D 60.8% · R 37.4% · Other 1.7%
- 2008→2024 swing
- +3.5pp toward D · 2008: 19.9pp · 2024: 23.4pp
- All cycles
- 2024: D+23.4 2020: D+24.0 2016: D+16.2 2012: D+13.7 2008: D+19.9
Not yet ingested
- Civics
- —
Market trends
- HPI YoY
- ▼ -242.89%
- Current HPI
- 210.6588
- Rent YoY
- ▲ 4.14%
- Metro
- St. Louis, MO-IL
- State GDP YoY
- ▲ 1.84%
- F500 in state
- 20
Industry mix (Fortune 500 HQ in MO)
| Industry | F500 HQs | Revenue |
|---|---|---|
| Healthcare | 1 | $163B |
|
||
| Insurance | 1 | $21B |
|
||
| Industrial Technology | 1 | $17B |
|
||
| Retail | 1 | $16B |
|
||
| Industrial Distribution | 1 | $10B |
|
||
| Utilities | 1 | $9B |
|
||
Price history
3 events — show timeline
- 2026-02-27 Listed $140,000 MARIS as Distributed by MLS Grid
- 1995-03-24 Sold (Public Records) — Public Records
- 1994-12-06 Sold (Public Records) — Public Records
Property tax history
-0.3%/yrLatest (2022): $1,397 · +0.1% YoY. Source: county tax records.
Cash-flow waterfall
monthlySold comps — $/sqft
last 12 mo · ≤1 miLoading sold comps…