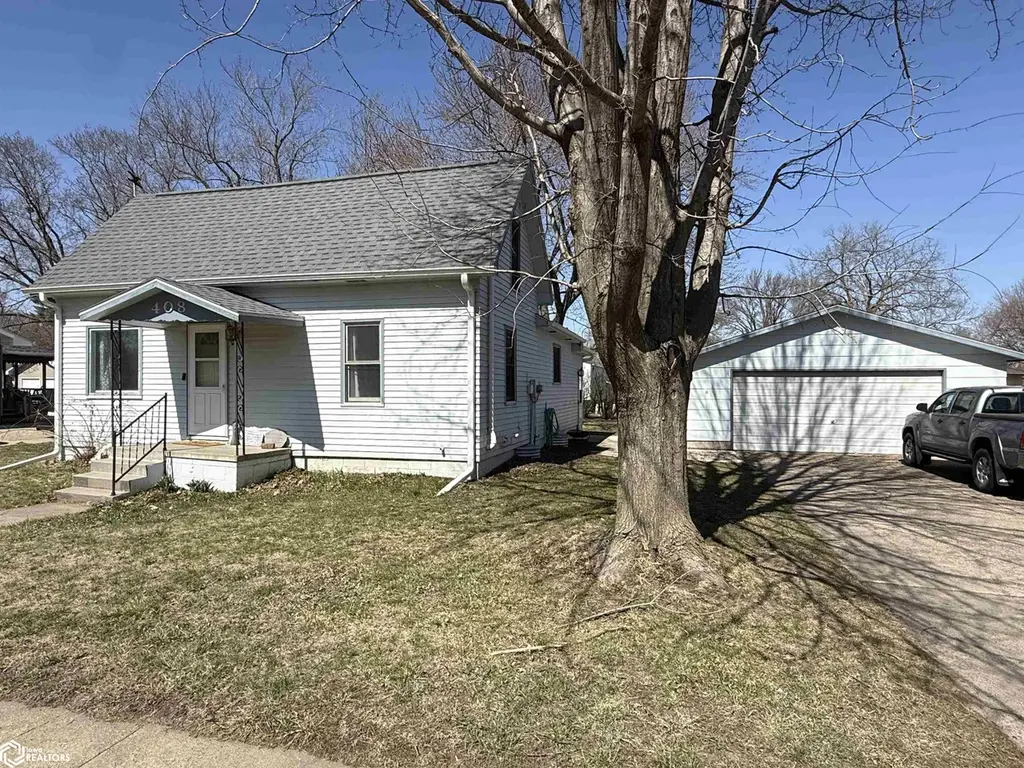
408 Broadway St · Harlan, IA
Flood risk 1/10 · Minimal
- FEMA flood zone
- X (unshaded)
- Chance of flooding over 30 yrs
- 0.0%
- Est. flood insurance / yr
- $473 – $860
Fire risk 1/10 · Minimal
- Est. fire insurance / yr
- $902 – $1,676
Heat risk 3/10 · Minor
- Hot days now (above 103°F)
- 7 days/yr
- Hot days in 30 yrs
- 15 days/yr
Wind risk 2/10 · Minimal
- Chance of severe wind over 30 yrs
- —
Air-quality risk 1/10 · Minimal
- Unhealthy air days now
- 0 days/yr
- Unhealthy air days in 30 yrs
- 0 days/yr
Risk factors via First Street. Map © Google.
Why this score? — see what drove the C+ grade
The composite is a weighted blend of 9 inputs, each scored 0–100. Each bar is that input's sub-score; the figure is the points it added to the 100-point composite (weight × sub-score).
- Cash flow +20.0/30.0
- ARV discount +15.0/15.0
- DSCR +6.4/10.0
- Schools +6.3/10.0
- 1% rule +4.9/10.0
- Livability +4.0/5.0
- Rent growth +2.5/5.0
- Condition / age +2.5/5.0
- Appreciation +0.0/10.0
$135,000
🖨 Deal sheet (PDF) 📄 Offer letter ✓ Due diligence
Listing remarks
This beautiful 1 story home is ready for its next owners. Located close to Historic Downtown Harlan, this 3 bedroom, 2 bathroom home offers ample space and storage throughout all three levels. On the main level you'll find a spacious eat-in kitchen, the primary bedroom, living room, a full bathroom, and a functional laundry room that could be a office space or potential 4th bedroom. The upper level offers ample storage and could be a fun kids hangout space or ANOTHER private bedroom if you choose. The basement has a sizeable living space as well as 2 conforming bedrooms, a full bathroom with a double sink vanity, and laundry can be moved back to the basement as well. The tankless water heat
Key facts
- Sump pump
- 0.24 acre lot
- 2 garage spots
Tags
Property features AI
Exterior
- Parking: Detached 2-car garage
- Utilities: Public water; Public sewer
- Home design: Single-family residence
- Construction: Wood siding construction
- Exterior features: Lot approximately 0.24 acres (88 x 120); Residential single-family zoning; Wood siding
Interior
- Bathrooms: 2 full bathrooms
- Heating & cooling: Central air conditioning; Forced air heating
- Interior features: Finished basement (approximately 500 below-grade finished area)
Neighborhood map
What this means for you Summary
Snapshot
- This is a 4-bed/4.0-bath single-family listed at $135k.
Deal economics
- At list price, monthly cash flow is $167 ($2k/yr) — positive.
- The deal already cash-flows at list — no discount required.
- To meet the 1% rule (rent ≥ 1% of price), the offer needs to be $134k (0.7% below list).
- Recommended offer: $133k (1.5% below list) — sets the bar for market timing.
- Cap rate 7.8% vs local median 4.0% in Harlan — top-decile yield for the area; either an underpriced asset or a hidden risk that comps aren't pricing in. Stress-test before assuming the spread holds.
Location & tenants
- Location reads 80/100 on livability (#79 in IA, #1,656 nationally) — a professional / high-income tenant draw. Strengths: cost of living A+, housing A+, health & safety A+; Watch: employment D+, amenities F, commute F.
- Harlan Community School District (town): math 72% / reading 77% proficiency, ranked #81 of 289 in IA (top 28%) — strong family-tenant draw, lease renewals of 3-5y typical.
- Zoned schools: Harlan Primary (369 students, 44% FRL); Harlan Community Middle School (math 70% / reading 81%, grade A, #65 of 246 statewide, top 29%, 342 students, 36% FRL); Harlan High School (math 77% / reading 82%, grade A-, #34 of 336 statewide, top 14%, 477 students, 31% FRL).
- Market conditions: 35 active listings in the ZIP; 2 comparable units currently listed for rent nearby; 8 units permitted in Shelby County in 2024 (0 in 5+ unit buildings).
Forward outlook
- Local home prices are declining (-3.0%/yr); year-one equity from $933 of loan paydown is wiped out by about $4k of value loss. Plan a longer hold.
- Shelby County population projected to shrink 7% by 2050 — rents likely to lag national; underwrite the cash flow, not the appreciation.
Negotiation context
- It's been on market 19 days — a 2% lower offer ($133k) is reasonable based on typical stale-listing flexibility.
- 3 sale attempts with the ask held roughly flat each time — persistent listings suggest the price (not the market) is what's stuck; bring a comps-based counter.
- Current owner paid $64k; list at $135k implies a 111% gain — meaningful room to come down on a strong offer.
Risks & watch-outs
- Watch-outs: built in 1890 — expect roof / HVAC / electrical / plumbing capex.
Questions for the listing agent
- Built in 1890 — when were the roof, HVAC, electrical panel, plumbing, and water heater last replaced?
- Is there a deadline driving the sale (1031 exchange, divorce, estate, relocation)? That informs how much negotiation room exists.
- Schools are A-rated — typically a magnet for longer-tenancy family renters. What's the average tenant stay here, and is there a school-zone premium baked into asking?
- What's the average days-on-market for RENTAL listings here right now (not sales)? A rising rental-DOM trend means longer vacancies and softer asking-rent achievability than the comps imply.
- What's the recent tenant-quality profile in this submarket — average credit score on applications, eviction rate, late-payment / NSF rate, and stable-employment percentage? A property-management company in the area should have these aggregated.
- How much new for-sale + rental construction is in the pipeline within 1–3 miles? Heavy new supply typically softens prices + rents 12–24 months out; constrained supply supports both.
Investment metrics
- 1% rule
- 0.99% ✗
- Cap rate
- 7.77%
- Cash-on-cash
- 5.29%
- DSCR
- 1.24
- GRM
- 8.4
CMA / ARV
- ARV (on-the-fly)
- $210,552
- Comps found
- 8
Show comp detail 8 sales within ~0.75 mi
| Address | Dist | Beds/Ba | Sqft | Sold | Price | $/sf | Match |
|---|---|---|---|---|---|---|---|
| 408 Broadway St | 0.00mi | 4/2.0 | 1,698 (0%) | 1mo | $135,200 | $80 | 91 |
| 805 Baldwin St | 0.63mi | 4/2.5 | 1,694 (-0%) | 9mo | $234,900 | $139 | 57 |
| 1012 Main St | 0.39mi | 3/2.5 (-1) | 1,608 (-5%) | 14mo | $199,000 | $124 | 51 |
| 908 Farnam St | 0.74mi | 4/3.0 | 1,728 (+2%) | 14mo | $210,000 | $122 | 47 |
| 401 Market St | 0.40mi | 3/1.0 (-1) | 1,583 (-7%) | 11mo | $135,000 | $85 | 44 |
| 1008 Baldwin St | 0.67mi | 3/1.5 (-1) | 1,717 (+1%) | 11mo | $70,000 | $41 | 43 |
| 207 Court St | 0.48mi | 3/2.0 (-1) | 1,592 (-6%) | 20mo | $245,000 | $154 | 38 |
| 1203 Durant St | 0.73mi | 3/2.5 (-1) | 1,544 (-9%) | 11mo | $192,000 | $124 | 31 |
Match score weights: distance 35% · size 25% · config 20% · recency 20%. Top-matched comps best support the ARV.
Projected returns pro-forma
-3.0% appreciation · 3.0% rent growth · sell at horizon
- IRR
- -8.1%
- Equity multiple
- 0.70×
- Total profit
- $-11,275
- Equity at exit
- $20,129
- IRR
- 1.4%
- Equity multiple
- 1.10×
- Total profit
- $3,821
- Equity at exit
- $11,672
Cash invested: $37,800 (down + closing). Projections, not guarantees.
Landlord ↔ Tenant lean methodology
- Overall (STATE)
- 83 Strongly Landlord-Friendly
- State Iowa
- 83 Strongly Landlord-Friendly · R+6
- County
- — inherits STATE
- City
- — inherits STATE
ZIP-level market 51537
- Home prices YoY
- -26.9%
- Active inventory
- 35
- Price-to-rent
- 8.4×
Monthly cashflow live
- Estimated rent
- $1,341 medium interval (Pro) →
- Mortgage (P&I)
- −$708
- Tax from tax record
- −$129 /mo · $1,544/yr
- Insurance
- −$56
- HOA
- −$0
- Vacancy / Maint / Mgmt
- −$282
- Net cashflow
- $167
Break-even live
Sensitivity live
| Price | -10% $243 | -5% $205 | +0% $167 | +5% $128 | +10% $90 |
|---|---|---|---|---|---|
| Rent | -10% $61 | -5% $114 | +0% $167 | +5% $219 | +10% $272 |
| Rate | -1.0pp $235 | -0.5pp $201 | base $167 | +0.5pp $132 | +1.0pp $96 |
UW: 25.0% down · 7.5% · 30yr · 1.5% tax · 5.0% vac · 8.0% maint · 8.0% mgmt
Financing live
Cash to close
- Down payment
- $33,750
- Closing costs
- $4,050
- Reserves months
- —
- Total cash needed
- —
Loan-product check · same deal, 3 products live
Conventional
25% down · 7.5% · 30yr
- Down + closing
- —
- Monthly P&I
- —
- Monthly cashflow
- —
- DSCR
- —
- Eligible?
- —
Personal DTI + credit; lowest rate.
DSCR
20% down · 8.5% · 30yr
- Down + closing
- —
- Monthly P&I
- —
- Monthly cashflow
- —
- DSCR
- —
- Eligible?
- —
No personal income docs; deal must DSCR.
Hard money
10% down · 12.0% · 12mo
- Down + closing
- —
- Monthly P&I
- —
- Monthly cashflow
- —
- DSCR
- —
- Eligible?
- —
Short-term bridge; refi at stabilization.
Rent comps 2 comps
| Address | Beds | Baths | Sqft | Rent | $/sqft | DOM | Units | Dist |
|---|---|---|---|---|---|---|---|---|
| 611 Gary Scull Dr Unit 12-405 Harlan, IA | 3.0 | 2.0 | 1738 | $1,400 | $0.81 | 46d | 1 | 0.35mi |
| 611 Gary Scull Dr Unit 10-305 Harlan, IA | 3.0 | 2.0 | 1738 | $1,282 | $0.74 | 46d | 1 | 0.35mi |
Listing history 6 events
-
2026-04-23status Pending
-
2026-04-10status Active
-
2026-04-04status Pending
-
2026-03-30status Active
-
2026-03-27$135,000 Active
-
2021-08-13soldstatus $64,000
ⓘ Source: listings_history table (triggers on properties + properties_extension) + one-shot
backfill from property_details.listing_events for pre-trigger history.
Tax reassessment forecast IA · Partial reset (capped growth)
- Current annual tax
- $1,544 · $129/mo
- Projected year-2 tax
- $1,832 · $153/mo
- Expected delta
- +$288/yr (+$24/mo · 18.6%)
ⓘ Screening estimate from a state-policy table — verify with the county assessor before closing.
Climate risk First Street
- Flood 1/10 Low FEMA zone X (unshaded) · 0% chance over 30 yrs
- Wildfire 1/10 Low
- Heat 3/10 Moderate 7 d/yr ≥103°F today · 15 d/yr by 30 yrs out
- Wind 2/10 Low
- Air quality 1/10 Low 0 unhealthy d/yr today · 0 by 30 yrs out
Nearby sold comps map
Loading sold comps map…
Walkable amenities ~0.75 mi
Loading nearby amenities…
Taxation est. · year 1
- Rental income
- $16,092
- − Mortgage interest
- −$7,562
- − Property taxes
- −$1,544
- − Insurance
- −$675
- − Repairs & maintenance
- −$1,287
- − Management
- −$1,287
- − Depreciation
- −$3,927
- Taxable loss
- −$191
- Est. tax savings @ 24.0%
- +$46
- After-tax cash flow
- $2,044/yr
For passive investors: Depreciation is non-cash, so a rental often shows a tax loss while cash-flowing — sheltering income. Rental losses are passive: they offset passive income freely, and up to $25,000/yr can offset ordinary (W-2) income if you actively participate and your MAGI is under $100k (phasing out to $0 by $150k); unused losses carry forward. On sale, claimed depreciation is recaptured at up to 25%, and gains may owe capital-gains tax (a 1031 exchange can defer both). Figures are a year-1 estimate at your 24.0% rate — not tax advice; consult a CPA.
Schools (NCES district)
- District
- Harlan Community School District
- NCES district ID
- 1913500
- Math proficiency
- 72% ▼ -7.00%
- Reading proficiency
- 77% ▼ -3.00%
- Median HH income
- $48,557
- Composite
- 62.95/100
- National rank
- #656
- State rank
- #81 of 289 in IA
Livability — Harlan
- Score
- 80/100
- State rank
- #79
- US rank
- #1656
Category grades
Schools grade is shown separately in the Schools card above.
Census & demographics
- Census place
- Harlan, IA
- Population (ZIP)
- 6,480
Population outlook (Shelby County) Hauer SSP2
- Today (2025)
- 11,637 people
- By 2030
- 11,472 · -1.4%
- By 2040
- 11,146 · -4.2%
- By 2050
- 10,791 · -7.3%
- By 2075
- 10,601 · -8.9%
- By 2100
- 10,338 · -11.2%
Race, ethnicity, and origin ACS 2023
- Neighborhood character
- Predominantly White (91%)
- Race & ethnicity
- White 91% Two or more races 5% Hispanic / Latino 3%
- Common ancestry
- Portuguese 3% Lithuanian 3% Iranian 2%
- Foreign-born
- 2% · Canada
- Languages at home
- 98% English-only · Spanish 2%
Political lean MEDSL · Shelby
- 2024 margin
- Solid R (+43.0) · D 27.9% · R 70.9% · Other 1.2%
- 2008→2024 swing
- -33.3pp toward R · 2008: -9.7pp · 2024: -43.0pp
- All cycles
- 2024: R+43.0 2020: R+40.3 2016: R+42.9 2012: R+22.2 2008: R+9.7
Not yet ingested
- Civics
- —
Market trends
- HPI YoY
- ▼ -77.04%
- Current HPI
- 209.5911
- Rent YoY
- —
- Metro
- —
- State GDP YoY
- ▲ 2.48%
- F500 in state
- 4
Industry mix (Fortune 500 HQ in IA)
| Industry | F500 HQs | Revenue |
|---|---|---|
| Financial Services | 1 | $16B |
|
||
| Retail / Convenience | 1 | $15B |
|
||
Price history
+110.9% since first listed6 events — show timeline
- 2026-04-23 Pending — IAR
- 2026-04-10 Relisted — IAR
- 2026-04-04 Pending — IAR
- 2026-03-30 Relisted — IAR
- 2026-03-27 Listed $135,000 IAR
- 2021-08-13 Sold (Public Records) $64,000 Public Records
Property tax history
+5.5%/yrLatest (2025): $1,544 · +3.3% YoY. Source: county tax records.
Cash-flow waterfall
monthlySold comps — $/sqft
last 12 mo · ≤1 miLoading sold comps…