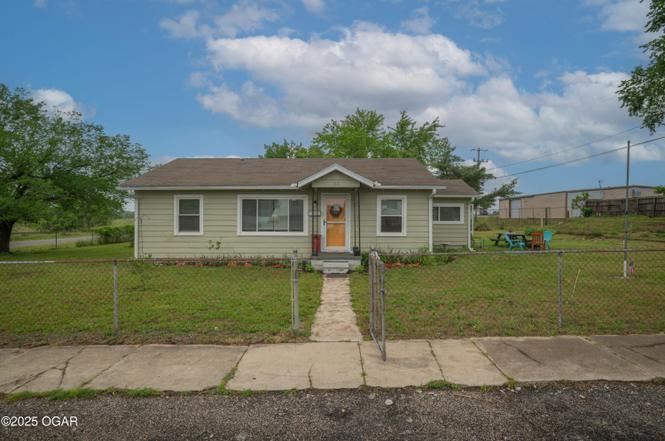
117 W 2nd St · Galena, KS
Flood risk 1/10 · Minimal
- FEMA flood zone
- X (unshaded)
- Chance of flooding over 30 yrs
- 0.0%
- Est. flood insurance / yr
- $507 – $1,088
Fire risk 5/10 · Moderate
- Est. fire insurance / yr
- $1,154 – $2,142
Heat risk 6/10 · Moderate
- Hot days now (above 107°F)
- 7 days/yr
- Hot days in 30 yrs
- 20 days/yr
Wind risk 2/10 · Minimal
- Chance of severe wind over 30 yrs
- 3.0%
Air-quality risk 2/10 · Minimal
- Unhealthy air days now
- 1 days/yr
- Unhealthy air days in 30 yrs
- 1 days/yr
Risk factors via First Street. Map © Google.
Why this score? — see what drove the D grade
The composite is a weighted blend of 9 inputs, each scored 0–100. Each bar is that input's sub-score; the figure is the points it added to the 100-point composite (weight × sub-score).
- Cash flow +16.5/30.0
- ARV discount +7.5/15.0
- DSCR +5.1/10.0
- 1% rule +3.6/10.0
- Livability +3.4/5.0
- Rent growth +2.5/5.0
- Condition / age +2.5/5.0
- Schools +2.4/10.0
- Appreciation +0.0/10.0
$115,000
🖨 Deal sheet (PDF) 📄 Offer letter ✓ Due diligence
Key facts
- Storage shed
- Expansive backyard
- Fully fenced lot
Tags
Property features AI
Finance
- Financial info: Annual tax amount listed
Exterior
- Parking: No designated parking
- Utilities: Public sewer
- Home design: Single-family residence (freestanding)
- Construction: Shingle roof; Block foundation; Built as single-story (above grade finished area listed)
- Exterior features: Chain link fenced yard; Storage structure on the property; Level topography; Corner lot (110 x 150)
Interior
- Kitchen: Gas range; Refrigerator
- Flooring: Vinyl; Wood
- Bathrooms: 1 full bathroom
- Heating & cooling: Has heating; Window unit cooling
- Interior features: Gas range; Refrigerator; Washer; Dryer; Vinyl and wood flooring; Crawl space basement; Total of 7 rooms
- Laundry & utility: Washer; Dryer
Neighborhood map
What this means for you Summary
Snapshot
- This is a 3-bed/1.0-bath single-family listed at $115k.
Deal economics
- At list price, monthly cash flow is $67 ($804/yr) — positive.
- The deal already cash-flows at list — no discount required.
- To meet the 1% rule (rent ≥ 1% of price), the offer needs to be $99k (14.0% below list).
- Recommended offer: $99k (14.0% below list) — sets the bar for 1% rule.
Location & tenants
- Location reads 67/100 on livability (#239 in KS) — a middle-class / working-renter tenant base. Strengths: cost of living A+, health & safety A+, housing A; Watch: crime F, amenities F, commute F.
- Galena (town): math 23% / reading 35% proficiency, ranked #118 of 169 in KS (top 70%) — low school quality limits family demand, transient renter base, plan for 1-2y turnover.
- Zoned schools: Spring Grove Primary Center (213 students, 65% FRL); Galena Middle School (math 22% / reading 37%, grade F, #72 of 219 statewide, top 38%, 164 students, 63% FRL); Galena High (math 15% / reading 24%, grade F, #198 of 327 statewide, top 66%, 251 students, 58% FRL) — zoned schools at 62% FRL track the district average.
- Market conditions: 55 active listings in the ZIP; 7 comparable units currently listed for rent nearby; rentals lingering (median 46d on market — plan ~5-8 weeks vacancy on turnover, expect pricing pressure); 71% of comp listings sitting > 30 days — soft ceiling on asking rent; 17 units permitted in Cherokee County in 2024 (0 in 5+ unit buildings).
Forward outlook
- Local home prices are declining (-3.0%/yr); year-one equity from $795 of loan paydown is wiped out by about $3k of value loss. Plan a longer hold.
- Cherokee County population projected at -26% by 2050 — secular population decline; favor cash flow + early exit over multi-decade hold.
Negotiation context
- It's been on market 139 days — a 12% lower offer ($101k) is reasonable based on typical stale-listing flexibility.
- 2 sale attempts since 2y ago; this cycle's ask has dropped $10k (8%) from the opening price — seller is motivated, your offer sets the floor, not the list.
Risks & watch-outs
- Watch-outs: built in 1956 — expect roof / HVAC / electrical / plumbing capex.
- Climate carrying-cost: moderate wildfire risk; extreme-heat days projected 7→20/yr by 2055 (HVAC capex compounding) — expect insurance premiums to compound above CPI over the hold.
Questions for the listing agent
- It's been on market 139 days. Have you received any prior offers? Is the seller open to a 14% concession, seller financing, or rate buy-down credit?
- Built in 1956 — when were the roof, HVAC, electrical panel, plumbing, and water heater last replaced?
- Why hasn't it sold? Are there any deal-killer items the seller is aware of (foundation, flood, title, zoning, code violations)?
- Is there a deadline driving the sale (1031 exchange, divorce, estate, relocation)? That informs how much negotiation room exists.
- Schools are F-rated, which usually means shorter tenancies and higher turnover. Who's the typical renter profile here, and what's been the actual vacancy rate?
- Crime grade is F in this area — have there been break-ins, vandalism, or insurance claims at this property in the last 3 years? What carrier currently insures it and at what premium?
- The area grade is low — what's the realistic commute time and amenity access for the typical tenant pool here? Any planned neighborhood developments (good or bad) we should know about?
- What's the average days-on-market for RENTAL listings here right now (not sales)? A rising rental-DOM trend means longer vacancies and softer asking-rent achievability than the comps imply.
- What's the recent tenant-quality profile in this submarket — average credit score on applications, eviction rate, late-payment / NSF rate, and stable-employment percentage? A property-management company in the area should have these aggregated.
- How much new for-sale + rental construction is in the pipeline within 1–3 miles? Heavy new supply typically softens prices + rents 12–24 months out; constrained supply supports both.
Investment metrics
- 1% rule
- 0.86% ✗
- Cap rate
- 6.99%
- Cash-on-cash
- 2.50%
- DSCR
- 1.11
- GRM
- 9.7
CMA / ARV
- ARV (on-the-fly)
- $65,026
- Comps found
- 1
Show comp detail 1 sale within ~0.75 mi
| Address | Dist | Beds/Ba | Sqft | Sold | Price | $/sf | Match |
|---|---|---|---|---|---|---|---|
| 1011 Joplin Ave | 0.52mi | 2/1.0 (-1) | 944 (-11%) | 22mo | $58,000 | $61 | 34 |
Match score weights: distance 35% · size 25% · config 20% · recency 20%. Top-matched comps best support the ARV.
Projected returns pro-forma
-3.0% appreciation · 3.0% rent growth · sell at horizon
- IRR
- -12.4%
- Equity multiple
- 0.55×
- Total profit
- $-14,404
- Equity at exit
- $17,147
- IRR
- -3.3%
- Equity multiple
- 0.78×
- Total profit
- $-7,190
- Equity at exit
- $9,943
Cash invested: $32,200 (down + closing). Projections, not guarantees.
Landlord ↔ Tenant lean methodology
- Overall (STATE)
- 83 Strongly Landlord-Friendly
- State Kansas
- 83 Strongly Landlord-Friendly · R+10
- County
- — inherits STATE
- City
- — inherits STATE
ZIP-level market 66739
- Home prices YoY
- -15.5%
- Active inventory
- 55
- Price-to-rent
- 9.7×
Monthly cashflow live
- Estimated rent
- $989 high interval (Pro) →
- Mortgage (P&I)
- −$603
- Tax from tax record
- −$64 /mo · $763/yr
- Insurance
- −$48
- HOA
- −$0
- Vacancy / Maint / Mgmt
- −$208
- Net cashflow
- $67
Break-even live
Sensitivity live
| Price | -10% $132 | -5% $100 | +0% $67 | +5% $34 | +10% $2 |
|---|---|---|---|---|---|
| Rent | -10% $-11 | -5% $28 | +0% $67 | +5% $106 | +10% $145 |
| Rate | -1.0pp $125 | -0.5pp $96 | base $67 | +0.5pp $37 | +1.0pp $7 |
UW: 25.0% down · 7.5% · 30yr · 1.5% tax · 5.0% vac · 8.0% maint · 8.0% mgmt
Financing live
Cash to close
- Down payment
- $28,750
- Closing costs
- $3,450
- Reserves months
- —
- Total cash needed
- —
Loan-product check · same deal, 3 products live
Conventional
25% down · 7.5% · 30yr
- Down + closing
- —
- Monthly P&I
- —
- Monthly cashflow
- —
- DSCR
- —
- Eligible?
- —
Personal DTI + credit; lowest rate.
DSCR
20% down · 8.5% · 30yr
- Down + closing
- —
- Monthly P&I
- —
- Monthly cashflow
- —
- DSCR
- —
- Eligible?
- —
No personal income docs; deal must DSCR.
Hard money
10% down · 12.0% · 12mo
- Down + closing
- —
- Monthly P&I
- —
- Monthly cashflow
- —
- DSCR
- —
- Eligible?
- —
Short-term bridge; refi at stabilization.
Rent comps 7 comps
| Address | Beds | Baths | Sqft | Rent | $/sqft | DOM | Units | Dist |
|---|---|---|---|---|---|---|---|---|
| 714 Columbus St Unit A Galena, KS | 3.0 | 2.0 | 1170 | $1,000 | $0.85 | 45d | 1 | 0.59mi |
| 714 Columbus St Unit B Galena, KS | 3.0 | 2.0 | 1170 | $1,000 | $0.85 | 23d | 1 | 0.59mi |
| 714 Columbus St Galena, KS | 3.0 | 2.0 | 1170 | $1,000 | $0.85 | 23d | 1 | 0.59mi |
| 718 Columbus St Galena, KS | 3.0 | 2.0 | 1170 | $1,000 | $0.85 | 45d | 1 | 0.59mi |
| 718 Columbus St Unit A Galena, KS | 3.0 | 2.0 | 1170 | $1,000 | $0.85 | 45d | 1 | 0.59mi |
| 1001 E 5th St Unit B Galena, KS | 2.0 | 1.0 | 900 | $950 | $1.06 | 45d | 1 | 0.63mi |
| 1113 Chica Ln Unit 1 Galena, KS | 2.0 | 1.0 | 1000 | $965 | $0.96 | 45d | 1 | 0.76mi |
Listing history 7 events
-
2026-05-01status Pending
-
2026-02-26price $115,000
-
2025-12-13$125,000 Active
-
2025-10-23price $125,000
-
2025-06-26price $135,000
-
2024-08-08historical
-
2024-07-29$57,000 Active
ⓘ Source: listings_history table (triggers on properties + properties_extension) + one-shot
backfill from property_details.listing_events for pre-trigger history.
Tax reassessment forecast KS · Resets to sale price
- Current annual tax
- $763 · $64/mo
- Projected year-2 tax
- $1,622 · $135/mo
- Expected delta
- +$858/yr (+$72/mo · 112.4%)
ⓘ Screening estimate from a state-policy table — verify with the county assessor before closing.
Climate risk First Street
- Flood 1/10 Low FEMA zone X (unshaded) · 0% chance over 30 yrs
- Wildfire 5/10 Major
- Heat 6/10 Major 7 d/yr ≥107°F today · 20 d/yr by 30 yrs out
- Wind 2/10 Low 3% chance of damaging wind over 30 yrs
- Air quality 2/10 Low 1 unhealthy d/yr today · 1 by 30 yrs out
Nearby sold comps map
Loading sold comps map…
Walkable amenities ~0.75 mi
Loading nearby amenities…
Taxation est. · year 1
- Rental income
- $11,872
- − Mortgage interest
- −$6,442
- − Property taxes
- −$763
- − Insurance
- −$575
- − Repairs & maintenance
- −$950
- − Management
- −$950
- − Depreciation
- −$3,345
- Taxable loss
- −$1,153
- Est. tax savings @ 24.0%
- +$277
- After-tax cash flow
- $1,080/yr
For passive investors: Depreciation is non-cash, so a rental often shows a tax loss while cash-flowing — sheltering income. Rental losses are passive: they offset passive income freely, and up to $25,000/yr can offset ordinary (W-2) income if you actively participate and your MAGI is under $100k (phasing out to $0 by $150k); unused losses carry forward. On sale, claimed depreciation is recaptured at up to 25%, and gains may owe capital-gains tax (a 1031 exchange can defer both). Figures are a year-1 estimate at your 24.0% rate — not tax advice; consult a CPA.
Schools (NCES district)
- District
- Galena
- NCES district ID
- 2006360
- Math proficiency
- 23% ▼ -1.00%
- Reading proficiency
- 35% ▲ 6.00%
- Median HH income
- $38,223
- Composite
- 24.21/100
- National rank
- #7727
- State rank
- #118 of 169 in KS
Livability — Galena
- Score
- 67/100
- State rank
- #239
- US rank
- #10647
Category grades
Schools grade is shown separately in the Schools card above.
Census & demographics
- Census place
- Galena, KS
- Population (ZIP)
- 5,240
Population outlook (Cherokee County) Hauer SSP2
- Today (2025)
- 18,848 people
- By 2030
- 17,862 · -5.2%
- By 2040
- 15,850 · -15.9%
- By 2050
- 13,915 · -26.2%
- By 2075
- 10,102 · -46.4%
- By 2100
- 6,977 · -63.0%
Race, ethnicity, and origin ACS 2023
- Neighborhood character
- Predominantly White (83%)
- Race & ethnicity
- White 83% Two or more races 11% Native American 2% Hispanic / Latino 2%
- Common ancestry
- Slovak 4% Italian 2% Swedish 2%
- Foreign-born
- 2% · China, Canada
- Languages at home
- 99% English-only · Chinese 1%
Political lean MEDSL · Cherokee
- 2024 margin
- Solid R (+52.9) · D 22.6% · R 75.5% · Other 1.9%
- 2008→2024 swing
- -29.2pp toward R · 2008: -23.7pp · 2024: -52.9pp
- All cycles
- 2024: R+52.9 2020: R+49.9 2016: R+48.4 2012: R+29.5 2008: R+23.7
Not yet ingested
- Civics
- —
Market trends
- HPI YoY
- ▼ -31.57%
- Current HPI
- 172.0001
- Rent YoY
- —
- Metro
- —
- State GDP YoY
- —
- F500 in state
- 0
Price history
+101.8% since first listed7 events — show timeline
- 2026-05-01 Pending — OGAR
- 2026-02-26 Price Changed $115,000 OGAR
- 2025-12-13 Listed $125,000 OGAR
- 2025-10-23 Price Changed $125,000 OGAR
- 2025-06-26 Price Changed $135,000 OGAR
- 2024-08-08 Listing Removed — Heartland MLS as Distributed by MLS Grid
- 2024-07-29 Listed $57,000 Heartland MLS as Distributed by MLS Grid
Property tax history
+2.6%/yrLatest (2025): $763 · +7.9% YoY. Source: county tax records.
Cash-flow waterfall
monthlySold comps — $/sqft
last 12 mo · ≤1 miLoading sold comps…