 Triplex
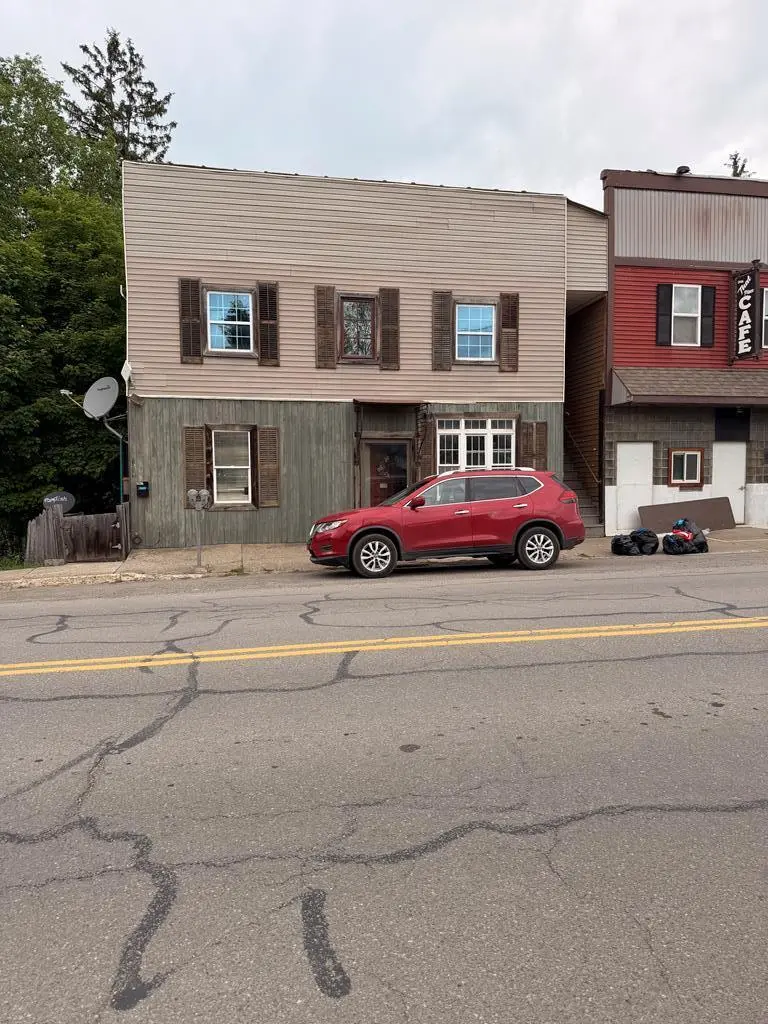
165 W Main St · Westfield, PA
Flood risk No data
- FEMA flood zone
- —
- Chance of flooding over 30 yrs
- —
- Est. flood insurance / yr
- —
Fire risk No data
- Est. fire insurance / yr
- —
Heat risk No data
- Hot days now (above threshold)
- —
- Hot days in 30 yrs
- —
Wind risk No data
- Chance of severe wind over 30 yrs
- —
Air-quality risk No data
- Unhealthy air days now
- —
- Unhealthy air days in 30 yrs
- —
Risk factors via First Street. Map © Google.
Why this score? — see what drove the B+ grade
The composite is a weighted blend of 9 inputs, each scored 0–100. Each bar is that input's sub-score; the figure is the points it added to the 100-point composite (weight × sub-score).
- Cash flow +30.0/30.0
- 1% rule +10.0/10.0
- DSCR +10.0/10.0
- ARV discount +7.5/15.0
- Appreciation +6.4/10.0
- Schools +3.7/10.0
- Livability +3.2/5.0
- Rent growth +2.5/5.0
- Condition / age +2.5/5.0
$139,000
🖨 Deal sheet 📄 Offer letter ✓ Due diligence
Multi-family units
County records classify this as Multi-Family (5+ Unit). Listing-text estimate: 3 units. estimate disagrees with records
5+ unit building — per-unit beds/baths from public records are typically unavailable; the breakdown below (if shown) is an estimate from the listing text.
Listing remarks
INVESTMENT OPPORTUNITY! This charming 3-Unit building is located in town. 2 apartments and 1 studio apartment. Each has their own outdoor space. Ground level has an outdoor patio. The two upper apartments each have a balcony-terrace. Plus, a bonus of a back yard space to enjoy nature and the beautiful garden area. First floor apartment is a roomy 1-bedroom, 1 bath. Second floor apartment has 2 bedrooms and 1 bath. Basement ground-level apartment is a 2-room studio apartment. All units are currently leased. Call today for your showing appointment.
Key facts
- Back yard space
- Garden area
- Balcony terrace
Tags
Property features AI
Exterior
- Parking: On-street parking
- Utilities: Public water; Public sewer
- Home design: Residential income property (multi-family)
- Construction: Brick, vinyl siding, and wood siding exterior construction
- Exterior features: Lot approximately 0.12 acres; On-street parking
Interior
- Heating & cooling: Electric heating; Natural gas heating
- Interior features: Full basement with partial finish and walk-out access; Has heating
Neighborhood map
What this means for you Summary
Snapshot
- This is a 3 × 3-bed/3.0-bath units multifamily listed at $139k.
Deal economics
- At list price, monthly cash flow is $2k ($20k/yr) — positive. Per door: $554/mo.
- The deal already cash-flows at list — no discount required.
- Meets the 1% rule at list price ($3k rent vs $139k).
Location & tenants
- Location reads 64/100 on livability (#1,184 in PA) — a middle-class / working-renter tenant base. Strengths: crime A+, cost of living A+, housing A-; Watch: schools D, health & safety D, amenities F.
- Northern Tioga SD (rural): math 34% / reading 54% proficiency, ranked #301 of 539 in PA (top 56%) — families likely to look elsewhere, expect single-tenant / working-renter base with shorter leases.
- Market conditions: 14 active listings in the ZIP; 32 units permitted in Tioga County in 2024 (0 in 5+ unit buildings).
Forward outlook
- In year one you build about $5k of equity ($961 loan paydown + $4k appreciation (2.9% local appreciation)).
- Tioga County population projected at -20% by 2050 — secular population decline; favor cash flow + early exit over multi-decade hold.
- At projected returns (2.9% appreciation + 3.0% rent growth), your $39k cash investment doubles in ~2 years — after that, you're playing with house money.
- By year 7, paydown + projected appreciation supports a ~$32k cash-out refi (75% LTV) — recoverable capital for the next deal without selling this one.
Negotiation context
- Only 5 days on market — expect competitive offers; lowballing is unlikely to land.
Risks & watch-outs
- Watch-outs: built in 1901 — expect roof / HVAC / electrical / plumbing capex.
Questions for the listing agent
- Can we see the unit-by-unit rent roll, current vacancy, and any below-market leases? What's the average tenancy length?
- What capital expenditures (roof, boiler, parking lot, exteriors) have been made in the last 5 years, and what's planned in the next 2?
- Built in 1901 — when were the roof, HVAC, electrical panel, plumbing, and water heater last replaced?
- Is there a deadline driving the sale (1031 exchange, divorce, estate, relocation)? That informs how much negotiation room exists.
- Schools are D-rated, which usually means shorter tenancies and higher turnover. Who's the typical renter profile here, and what's been the actual vacancy rate?
- What's the average days-on-market for RENTAL listings here right now (not sales)? A rising rental-DOM trend means longer vacancies and softer asking-rent achievability than the comps imply.
- What's the recent tenant-quality profile in this submarket — average credit score on applications, eviction rate, late-payment / NSF rate, and stable-employment percentage? A property-management company in the area should have these aggregated.
- How much new apartment / multifamily construction is in the pipeline within 1–3 miles? Heavy new supply (>2% of stock underway) typically softens rents 12–24 months out; light construction supports rent growth.
Investment metrics
- 1% rule
- 2.38% ✓
- Cap rate
- 20.63%
- Cash-on-cash
- 51.21%
- DSCR
- 3.28
- GRM
- 3.5
CMA / ARV
No comps found within radius.
Projected returns pro-forma
2.89% appreciation · 3.0% rent growth · sell at horizon
- IRR
- 56.2%
- Equity multiple
- 4.13×
- Total profit
- $121,784
- Equity at exit
- $61,668
- IRR
- 55.9%
- Equity multiple
- 8.36×
- Total profit
- $286,364
- Equity at exit
- $94,394
Cash invested: $38,920 (down + closing). Projections, not guarantees.
Landlord ↔ Tenant lean methodology
- Overall (STATE)
- 62 Landlord-Friendly
- State Pennsylvania
- 62 Landlord-Friendly · EVEN
- County
- — inherits STATE
- City
- — inherits STATE
ZIP-level market 16950
- Home prices YoY
- 1.0%
- Active inventory
- 14
- Price-to-rent
- 10.5×
Monthly cashflow live
- Estimated rent
- $3,314 medium interval (Pro) →
- Mortgage (P&I)
- −$729
- Tax from tax record
- −$170 /mo · $2,046/yr
- Insurance
- −$58
- HOA
- −$0
- Vacancy / Maint / Mgmt
- −$696
- Net cashflow
- $1,661
Break-even live
3-unit breakdown (identical units grouped — click to expand)
| Units | Beds | Baths | Est. rent |
|---|---|---|---|
| 3× units | 3 | 3 | $3,315 |
| #1 | 3 | 3 | $1,105 |
| #2 | 3 | 3 | $1,105 |
| #3 | 3 | 3 | $1,105 |
| Total (3 units) | $3,314 | ||
UW: 25.0% down · 7.5% · 30yr · 1.5% tax · 5.0% vac · 8.0% maint · 8.0% mgmt
Financing live
Cash to close
- Down payment
- $34,750
- Closing costs
- $4,170
- Reserves months
- —
- Total cash needed
- —
Loan-product check · same deal, 3 products live
Conventional
25% down · 7.5% · 30yr
- Down + closing
- —
- Monthly P&I
- —
- Monthly cashflow
- —
- DSCR
- —
- Eligible?
- —
Personal DTI + credit; lowest rate.
DSCR
20% down · 8.5% · 30yr
- Down + closing
- —
- Monthly P&I
- —
- Monthly cashflow
- —
- DSCR
- —
- Eligible?
- —
No personal income docs; deal must DSCR.
Hard money
10% down · 12.0% · 12mo
- Down + closing
- —
- Monthly P&I
- —
- Monthly cashflow
- —
- DSCR
- —
- Eligible?
- —
Short-term bridge; refi at stabilization.
Listing history 7 events
-
2026-06-18days on market $139,000 Active 5 DOM
-
2026-06-17remarks 552-char remark
-
2026-06-17days on market $139,000 Active 4 DOM
-
2026-06-16days on market $139,000 Active 3 DOM
-
2026-06-15days on market $139,000 Active 2 DOM
-
2026-06-14remarks 551-char remark
-
2026-06-14$139,000 Active 1 DOM
ⓘ Source: listings_history table (triggers on properties + properties_extension) + one-shot
backfill from property_details.listing_events for pre-trigger history.
Tax reassessment forecast PA · Partial reset (capped growth)
- Current annual tax
- $2,046 · $170/mo
- Projected year-2 tax
- $2,121 · $177/mo
- Expected delta
- +$75/yr (+$6/mo · 3.7%)
ⓘ Screening estimate from a state-policy table — verify with the county assessor before closing.
Nearby sold comps map
Loading sold comps map…
Walkable amenities ~0.75 mi
Loading nearby amenities…
Taxation est. · year 1
- Rental income
- $39,768
- − Mortgage interest
- −$7,786
- − Property taxes
- −$2,046
- − Insurance
- −$695
- − Repairs & maintenance
- −$3,181
- − Management
- −$3,181
- − Depreciation
- −$4,044
- Taxable income
- $18,835
- Est. tax owed @ 24.0%
- −$4,520
- After-tax cash flow
- $15,409/yr
For passive investors: Depreciation is non-cash, so a rental often shows a tax loss while cash-flowing — sheltering income. Rental losses are passive: they offset passive income freely, and up to $25,000/yr can offset ordinary (W-2) income if you actively participate and your MAGI is under $100k (phasing out to $0 by $150k); unused losses carry forward. On sale, claimed depreciation is recaptured at up to 25%, and gains may owe capital-gains tax (a 1031 exchange can defer both). Figures are a year-1 estimate at your 24.0% rate — not tax advice; consult a CPA.
Schools (NCES district)
- District
- Northern Tioga SD
- NCES district ID
- 4217730
- Math proficiency
- 34% ▼ -4.00%
- Reading proficiency
- 54% ▼ -4.00%
- Median HH income
- $41,816
- Composite
- 36.95/100
- National rank
- #4534
- State rank
- #301 of 539 in PA
Livability — Westfield
- Score
- 64/100
- State rank
- #1184
- US rank
- #13871
Category grades
Schools grade is shown separately in the Schools card above.
Census & demographics
- Census place
- Westfield, PA
- Population (ZIP)
- 3,256
Population outlook (Tioga County) Hauer SSP2
- Today (2025)
- 40,253 people
- By 2030
- 38,795 · -3.6%
- By 2040
- 35,376 · -12.1%
- By 2050
- 32,081 · -20.3%
- By 2075
- 24,341 · -39.5%
- By 2100
- 17,180 · -57.3%
Race, ethnicity, and origin ACS 2023
- Neighborhood character
- Predominantly White (98%)
- Race & ethnicity
- White 98% Two or more races 2%
- Common ancestry
- Serbian 2% Romanian 2% Slovak 2%
- Foreign-born
- 1%
- Languages at home
- 99% English-only · Russian/Polish/Slavic 1%
Political lean MEDSL · Tioga
- 2024 margin
- Solid R (+51.8) · D 23.6% · R 75.4% · Other 1.0%
- 2008→2024 swing
- -24.3pp toward R · 2008: -27.4pp · 2024: -51.8pp
- All cycles
- 2024: R+51.8 2020: R+51.2 2016: R+53.6 2012: R+34.8 2008: R+27.4
Not yet ingested
- Civics
- —
Market trends
- HPI YoY
- ▲ 2.89%
- Current HPI
- 286.2987
- Rent YoY
- —
- Metro
- —
- State GDP YoY
- ▲ 1.68%
- F500 in state
- 34
Industry mix (Fortune 500 HQ in PA)
| Industry | F500 HQs | Revenue |
|---|---|---|
| Healthcare | 2 | $309B |
|
||
| Insurance | 2 | $27B |
|
||
| Telecommunications / Media | 1 | $124B |
|
||
| Industrial Distribution | 1 | $22B |
|
||
| Financial Services | 1 | $20B |
|
||
| Chemicals / Materials | 1 | $18B |
|
||
Price history
1 event — show timeline
- 2026-06-13 Listed $139,000 NMPA
Property tax history
+34.8%/yrLatest (2026): $2,046 · +2.8% YoY. Source: county tax records.
Cash-flow waterfall
monthlySold comps — $/sqft
last 12 mo · ≤1 miLoading sold comps…