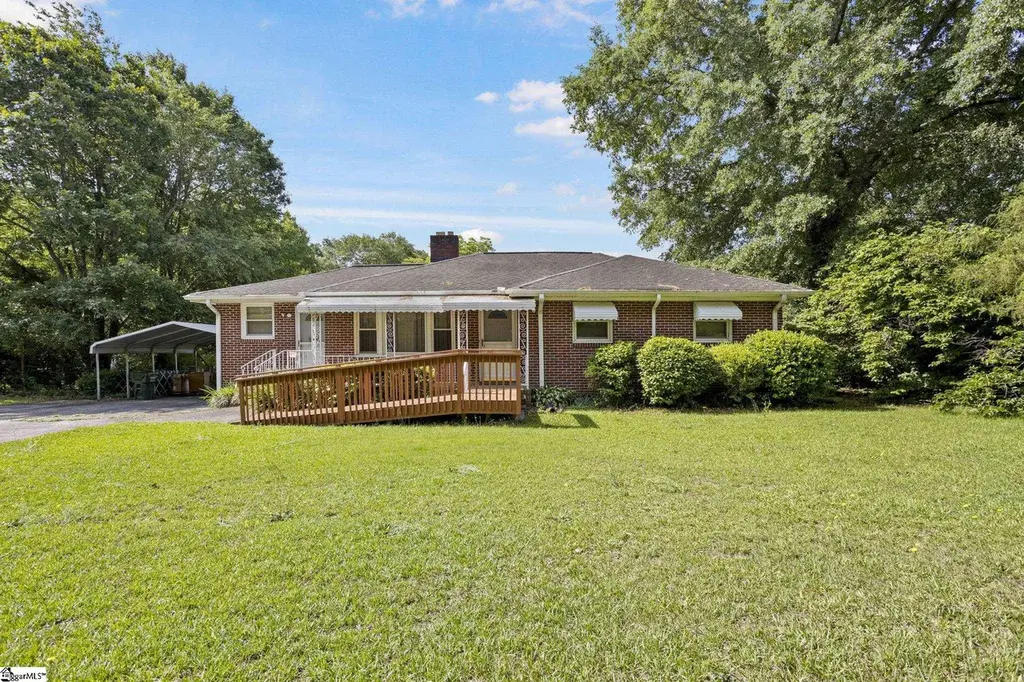
208 Shady Glen Dr · Greer, SC
Flood risk 1/10 · Minimal
- FEMA flood zone
- X (unshaded)
- Chance of flooding over 30 yrs
- 0.0%
- Est. flood insurance / yr
- $507 – $1,088
Fire risk 3/10 · Minor
- Est. fire insurance / yr
- $783 – $1,453
Heat risk 6/10 · Moderate
- Hot days now (above 104°F)
- 7 days/yr
- Hot days in 30 yrs
- 17 days/yr
Wind risk 2/10 · Minimal
- Chance of severe wind over 30 yrs
- 1.0%
Air-quality risk 4/10 · Minor
- Unhealthy air days now
- 4 days/yr
- Unhealthy air days in 30 yrs
- 5 days/yr
Risk factors via First Street. Map © Google.
Why this score? — see what drove the D+ grade
The composite is a weighted blend of 9 inputs, each scored 0–100. Each bar is that input's sub-score; the figure is the points it added to the 100-point composite (weight × sub-score).
- ARV discount +14.5/15.0
- Cash flow +13.6/30.0
- Schools +4.2/10.0
- DSCR +4.1/10.0
- Livability +4.0/5.0
- 1% rule +3.1/10.0
- Rent growth +2.9/5.0
- Condition / age +2.5/5.0
- Appreciation +0.0/10.0
$219,900
🖨 Deal sheet (PDF) 📄 Offer letter ✓ Due diligence
Listing remarks
Great opportunity for homeowners and investors alike! This solid brick 3-bedroom, 2-bath home sits on a spacious lot and offers endless potential. Featuring a functional floor plan, a 2-car carport, and a detached outbuilding perfect for storage, a workshop, or hobby space. Conveniently located between Greer and Spartanburg, you’ll enjoy easy access to shopping, dining, schools, and major highways while still having room to spread out. Whether you’re looking for your next home, rental property, or investment opportunity, this property offers value, location, and potential all in one package. Don’t miss your chance to make it your own!
Key facts
- Solid brick
- 2 car carport
- Detached outbuilding
Tags
Property features AI
Finance
- HOA & community: No HOA fees
Exterior
- Parking: Detached carport (2-car); Driveway with paved asphalt parking; Garage capacity listed as 1
- Utilities: Public water; Public sewer; Electric service; Private garbage pickup
- Home design: Single-story home; Over 50 years old; Crawl space foundation; Brick veneer (full); Composition shingle roof
- Construction: Brick veneer exterior; Composition shingle roof; Crawl space foundation; Approximate age 50+ years
- Exterior features: Front porch; Level lot with some trees; Outbuilding (storage)
Interior
- Kitchen: Refrigerator included; Kitchen approx. 19 x 00
- Bedrooms: Three bedrooms on the main level; Primary bedroom on main level with full bath and tub/shower (approx. 10 x 12); Second bedroom approx. 10 x 11; Third bedroom approx. 10 x 11
- Flooring: Carpet; Hardwood; Laminate flooring
- Bathrooms: Two full bathrooms (both on the main level)
- Heating & cooling: Electric heating; Central forced cooling; Electric water heater
- Interior features: Ceiling fans; Split floor plan; Masonry fireplace
- Laundry & utility: Walk-in laundry
Neighborhood map
What this means for you Summary
Snapshot
- This is a 3-bed/1.0-bath single-family listed at $220k.
Deal economics
- At list price, monthly cash flow is $14 ($163/yr) — positive.
- The deal already cash-flows at list — no discount required.
- To meet the 1% rule (rent ≥ 1% of price), the offer needs to be $179k (18.8% below list).
- Recommended offer: $179k (18.8% below list) — sets the bar for 1% rule.
- Cap rate 6.4% vs local median 3.2% in Greer — top-decile yield for the area; either an underpriced asset or a hidden risk that comps aren't pricing in. Stress-test before assuming the spread holds.
Location & tenants
- Location reads 81/100 on livability (#7 in SC, #1,463 nationally) — a professional / high-income tenant draw. Strengths: amenities A+, cost of living A+, housing A+; Watch: crime C-, commute F.
- Greenville 01 (suburban): math 44% / reading 54% proficiency, ranked #10 of 80 in SC (top 12%) — families likely to look elsewhere, expect single-tenant / working-renter base with shorter leases.
- Zoned schools: Crestview Elementary (math 42% / reading 44%, grade F, #250 of 597 statewide, top 42%, 654 students, 86% FRL) — zoned schools average 86% FRL vs 42% district-wide (44 pts higher); higher-poverty schools than district average — tighter screening recommended.
- Market conditions: Rents rising (+1.6%/yr); 514 active listings in the ZIP; 15 comparable units currently listed for rent nearby; rentals at typical pace (median 23d on market — plan ~3-4 weeks tenant-placement turnaround); solid renter incomes; 3,129 units permitted in Spartanburg County in 2024 (40 in 5+ unit buildings).
Forward outlook
- Local home prices are declining (-3.0%/yr); year-one equity from $2k of loan paydown is wiped out by about $7k of value loss. Plan a longer hold.
- Spartanburg County population projected at +18% by 2050 — long-run rental-demand tailwind backs the buy-and-hold thesis.
Negotiation context
- It's been on market 15 days — a 2% lower offer ($217k) is reasonable based on typical stale-listing flexibility.
Risks & watch-outs
- Climate carrying-cost: extreme-heat days projected 7→17/yr by 2055 (HVAC capex compounding) — expect insurance premiums to compound above CPI over the hold.
Questions for the listing agent
- Built in 1960 — when were the roof, HVAC, electrical panel, plumbing, and water heater last replaced?
- Is there a deadline driving the sale (1031 exchange, divorce, estate, relocation)? That informs how much negotiation room exists.
- Schools are B-rated — typically a magnet for longer-tenancy family renters. What's the average tenant stay here, and is there a school-zone premium baked into asking?
- The area grade is low — what's the realistic commute time and amenity access for the typical tenant pool here? Any planned neighborhood developments (good or bad) we should know about?
- What's the average days-on-market for RENTAL listings here right now (not sales)? A rising rental-DOM trend means longer vacancies and softer asking-rent achievability than the comps imply.
- What's the recent tenant-quality profile in this submarket — average credit score on applications, eviction rate, late-payment / NSF rate, and stable-employment percentage? A property-management company in the area should have these aggregated.
- How much new for-sale + rental construction is in the pipeline within 1–3 miles? Heavy new supply typically softens prices + rents 12–24 months out; constrained supply supports both.
Investment metrics
- 1% rule
- 0.81% ✗
- Cap rate
- 6.37%
- Cash-on-cash
- 0.26%
- DSCR
- 1.01
- GRM
- 10.3
CMA / ARV
- ARV (on-the-fly)
- $260,496
- Comps found
- 8
Show comp detail 8 sales within ~0.75 mi
| Address | Dist | Beds/Ba | Sqft | Sold | Price | $/sf | Match |
|---|---|---|---|---|---|---|---|
| 117 Patterson Rd | 0.11mi | 3/1.0 | 1,167 (-10%) | 1mo | $265,000 | $227 | 77 |
| 102 Valley Dr | 0.18mi | 3/2.0 | 1,315 (+2%) | 14mo | $289,000 | $220 | 73 |
| 624 Ruddy Creek Cir | 0.29mi | 3/2.0 | 1,214 (-6%) | 4mo | $238,000 | $196 | 69 |
| 241 Sunnyglen Dr Unit 241 Sunnyglen Drive | 0.63mi | 4/1.5 (+1) | 1,225 (-6%) | 9mo | $200,000 | $163 | 47 |
| 746 Pleasant Brook Ct | 0.38mi | 3/2.0 | 1,188 (-8%) | 22mo | $250,000 | $210 | 46 |
| 128 Flint Ln | 0.72mi | 3/2.0 | 1,360 (+5%) | 13mo | $245,000 | $180 | 43 |
| 214 Galena Ln | 0.72mi | 3/2.0 | 1,366 (+5%) | 21mo | $260,000 | $190 | 35 |
| 126 Flint Ln | 0.73mi | 3/2.0 | 1,219 (-6%) | 23mo | $245,000 | $201 | 33 |
Match score weights: distance 35% · size 25% · config 20% · recency 20%. Top-matched comps best support the ARV.
Projected returns pro-forma
-3.0% appreciation · 1.62% rent growth · sell at horizon
- IRR
- -17.3%
- Equity multiple
- 0.39×
- Total profit
- $-37,264
- Equity at exit
- $32,788
- IRR
- -12.0%
- Equity multiple
- 0.33×
- Total profit
- $-41,294
- Equity at exit
- $19,013
Cash invested: $61,572 (down + closing). Projections, not guarantees.
Landlord ↔ Tenant lean methodology
- Overall (STATE)
- 90 Strongly Landlord-Friendly
- State South Carolina
- 90 Strongly Landlord-Friendly · R+6
- County
- — inherits STATE
- City
- — inherits STATE
ZIP-level market 29651
- Home prices YoY
- -29.4%
- Rents YoY
- 1.6%
- Active inventory
- 514
- Price-to-rent
- 10.3×
Monthly cashflow live
- Estimated rent
- $1,785 high interval (Pro) →
- Mortgage (P&I)
- −$1,153
- Tax from tax record
- −$152 /mo · $1,823/yr
- Insurance
- −$92
- HOA
- −$0
- Vacancy / Maint / Mgmt
- −$375
- Net cashflow
- $14
Break-even live
Sensitivity live
| Price | -10% $138 | -5% $76 | +0% $14 | +5% $-49 | +10% $-111 |
|---|---|---|---|---|---|
| Rent | -10% $-127 | -5% $-57 | +0% $14 | +5% $84 | +10% $155 |
| Rate | -1.0pp $124 | -0.5pp $69 | base $14 | +0.5pp $-43 | +1.0pp $-101 |
UW: 25.0% down · 7.5% · 30yr · 1.5% tax · 5.0% vac · 8.0% maint · 8.0% mgmt
Financing live
Cash to close
- Down payment
- $54,975
- Closing costs
- $6,597
- Reserves months
- —
- Total cash needed
- —
Loan-product check · same deal, 3 products live
Conventional
25% down · 7.5% · 30yr
- Down + closing
- —
- Monthly P&I
- —
- Monthly cashflow
- —
- DSCR
- —
- Eligible?
- —
Personal DTI + credit; lowest rate.
DSCR
20% down · 8.5% · 30yr
- Down + closing
- —
- Monthly P&I
- —
- Monthly cashflow
- —
- DSCR
- —
- Eligible?
- —
No personal income docs; deal must DSCR.
Hard money
10% down · 12.0% · 12mo
- Down + closing
- —
- Monthly P&I
- —
- Monthly cashflow
- —
- DSCR
- —
- Eligible?
- —
Short-term bridge; refi at stabilization.
Rent comps 15 comps
| Address | Beds | Baths | Sqft | Rent | $/sqft | DOM | Units | Dist |
|---|---|---|---|---|---|---|---|---|
| 628 Arlington Rd Greer, SC | 3.0 | 2.0 | 1127 | $1,750 | $1.55 | 25d | 1 | 0.52mi |
| 117 Sunnyglen Dr Greer, SC | 3.0 | 2.0 | 1025 | $1,675 | $1.63 | 15d | 1 | 0.54mi |
| 19 Dunbar Ct Unit 13 Greer, SC | 2.0 | 1.0 | 900 | $1,095 | $1.22 | 21d | 1 | 0.62mi |
| 126 Arrow Ct Unit 126 Greer, SC | 3.0 | 2.5 | 1601 | $1,875 | $1.17 | 23d | 1 | 0.82mi |
| 206 E Arlington Ave Greer, SC | 3.0 | 2.0 | 1400 | $1,950 | $1.39 | 25d | 1 | 0.97mi |
| 2200 Racing Rd Greer, SC | 2.0 | 1.0–2.0 | 1324 | $1,660 | $1.25 | 4d | 4 | 1.07mi |
| 711 N Main St Greer, SC | 3.0 | 2.5 | 1700 | $2,250 | $1.32 | 25d | 1 | 1.18mi |
| 6 10th St Greer, SC | 2.0 | 1.0 | 1000 | $1,500 | $1.50 | 25d | 1 | 1.20mi |
| 1004 Parkview Greer Cir Greer, SC | 2.0 | 1.0–2.0 | 700 | $1,749 | $2.50 | 21d | 49 | 1.23mi |
| 1000 Village Mill Dr Greer, SC | 3.0 | 1.0–2.0 | 892 | $1,940 | $2.17 | 23d | 24 | 1.32mi |
| 1000 Village Mill Dr Greer, SC | 3.0 | 1.0–2.0 | 892 | $1,940 | $2.17 | 25d | 24 | 1.32mi |
| 623 Millwright Way Unit 1 Greer, SC | 3.0 | 2.5 | 1400 | $1,775 | $1.27 | 16d | 1 | 1.33mi |
| 108 S Line St Greer, SC | 3.0 | 1.0–2.0 | 1028 | $2,910 | $2.83 | 5d | 241 | 1.37mi |
| 908 Yarn Way Greer, SC | 3.0 | 2.5 | 1400 | $1,650 | $1.18 | 25d | 1 | 1.39mi |
| 916 Yarn Way Greer, SC | 3.0 | 2.5 | 1599 | $1,750 | $1.09 | 21d | 1 | 1.39mi |
Listing history 12 events
-
2026-06-22statusdays on market $219,900 Pending 15 DOM
-
2026-06-18days on market $219,900 Active 14 DOM
-
2026-06-17days on market $219,900 Active 13 DOM
-
2026-06-16days on market $219,900 Active 12 DOM
-
2026-06-15days on market $219,900 Active 11 DOM
-
2026-06-13days on market $219,900 Active 9 DOM
-
2026-06-13days on market $219,900 Active 8 DOM
-
2026-06-10days on market $219,900 Active 6 DOM
-
2026-06-09days on market $219,900 Active 5 DOM
-
2026-06-08days on market $219,900 Active 4 DOM
-
2026-06-07remarks 642-char remark
-
2026-06-07$219,900 Active 3 DOM
ⓘ Source: listings_history table (triggers on properties + properties_extension) + one-shot
backfill from property_details.listing_events for pre-trigger history.
Tax reassessment forecast SC · Resets to sale price
- Current annual tax
- $1,823 · $152/mo
- Projected year-2 tax
- $1,823 · $152/mo
- Expected delta
- $0/yr ($0/mo · -0.0%)
ⓘ Screening estimate from a state-policy table — verify with the county assessor before closing.
Climate risk First Street
- Flood 1/10 Low FEMA zone X (unshaded) · 0% chance over 30 yrs
- Wildfire 3/10 Moderate
- Heat 6/10 Major 7 d/yr ≥104°F today · 17 d/yr by 30 yrs out
- Wind 2/10 Low 100% chance of damaging wind over 30 yrs
- Air quality 4/10 Moderate 4 unhealthy d/yr today · 5 by 30 yrs out
Nearby sold comps map
Loading sold comps map…
Walkable amenities ~0.75 mi
Loading nearby amenities…
Taxation est. · year 1
- Rental income
- $21,422
- − Mortgage interest
- −$12,318
- − Property taxes
- −$1,823
- − Insurance
- −$1,100
- − Repairs & maintenance
- −$1,714
- − Management
- −$1,714
- − Depreciation
- −$6,397
- Taxable loss
- −$3,643
- Est. tax savings @ 24.0%
- +$874
- After-tax cash flow
- $1,037/yr
For passive investors: Depreciation is non-cash, so a rental often shows a tax loss while cash-flowing — sheltering income. Rental losses are passive: they offset passive income freely, and up to $25,000/yr can offset ordinary (W-2) income if you actively participate and your MAGI is under $100k (phasing out to $0 by $150k); unused losses carry forward. On sale, claimed depreciation is recaptured at up to 25%, and gains may owe capital-gains tax (a 1031 exchange can defer both). Figures are a year-1 estimate at your 24.0% rate — not tax advice; consult a CPA.
Schools (NCES district)
- District
- Greenville 01
- NCES district ID
- 4502310
- Math proficiency
- 44% ▼ -10.00%
- Reading proficiency
- 54% ▼ -2.00%
- Median HH income
- $49,596
- Composite
- 41.88/100
- National rank
- #3370
- State rank
- #10 of 80 in SC
Livability — Greer
- Score
- 81/100
- State rank
- #7
- US rank
- #1463
Category grades
Schools grade is shown separately in the Schools card above.
Census & demographics
- County
- Greenville County · 573,815 people
- City population
- 99,092
- Metro
- Greenville-Anderson, SC
- Population (ZIP)
- 56,599
- Household income
- $82,705
- Rent vs Own
- Severe rent burden
- 720.0
Population outlook (Spartanburg County) Hauer SSP2
- Today (2025)
- 325,495 people
- By 2030
- 338,800 · +4.1%
- By 2040
- 363,471 · +11.7%
- By 2050
- 384,156 · +18.0%
- By 2075
- 430,137 · +32.1%
- By 2100
- 442,733 · +36.0%
Race, ethnicity, and origin ACS 2023
- Neighborhood character
- Predominantly White (73%)
- Race & ethnicity
- White 73% Hispanic / Latino 11% Black 11% Two or more races 9% Asian 1%
- Hispanic origin (detail)
- Mexican 6% Puerto Rican 1%
- Common ancestry
- Serbian 3% Slovak 2% Romanian 2%
- Foreign-born
- 7% · Canada, Jamaica
- Languages at home
- 89% English-only · Spanish 8% Other Indo-European 1% German/W. Germanic 1%
Political lean MEDSL · Spartanburg
- 2024 margin
- Solid R (+33.6) · D 32.6% · R 66.2% · Other 1.2%
- 2008→2024 swing
- -12.0pp toward R · 2008: -21.6pp · 2024: -33.6pp
- All cycles
- 2024: R+33.6 2020: R+27.3 2016: R+30.0 2012: R+23.1 2008: R+21.6
Not yet ingested
- Civics
- —
Market trends
- HPI YoY
- ▼ -101.81%
- Current HPI
- 243.9051
- Rent YoY
- ▲ 1.62%
- Metro
- Greenville-Anderson, SC
- State GDP YoY
- ▲ 4.51%
- F500 in state
- 2
Industry mix (Fortune 500 HQ in SC)
| Industry | F500 HQs | Revenue |
|---|---|---|
| Packaging | 1 | $7B |
|
||
Price history
1 event — show timeline
- 2026-06-04 Listed $219,900 Greater Greenville MLS
Property tax history
+22.6%/yrLatest (2025): $1,823 · +388.4% YoY. Source: county tax records.
Cash-flow waterfall
monthlySold comps — $/sqft
last 12 mo · ≤1 miLoading sold comps…