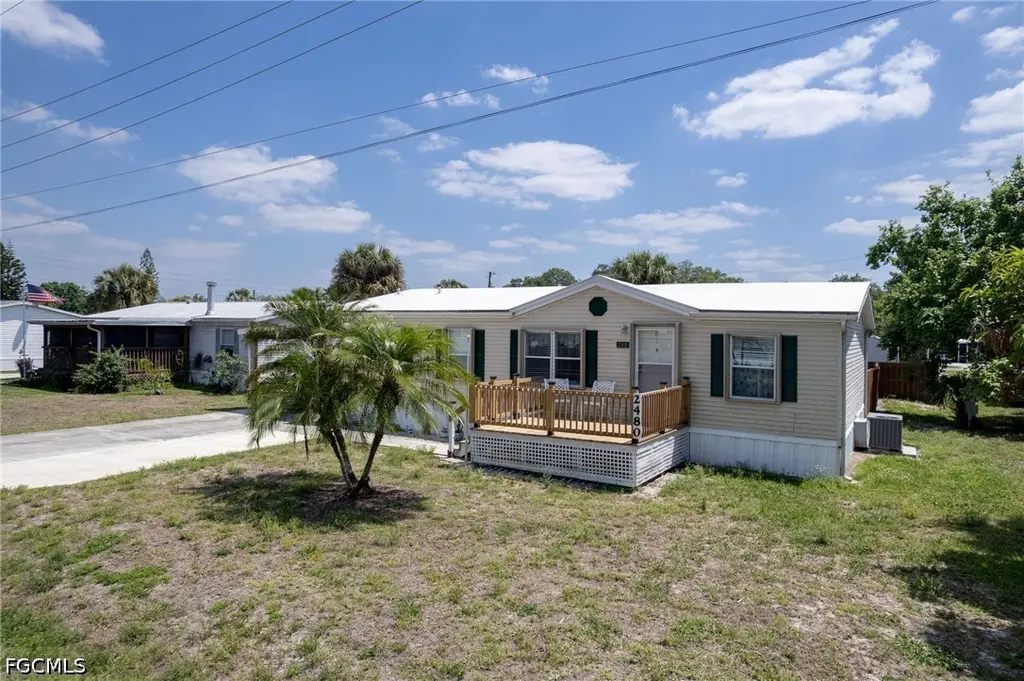
2480 Austin Smith Ct · Suncoast Estates, FL
Flood risk 4/10 · Minor
- FEMA flood zone
- X (shaded)
- Chance of flooding over 30 yrs
- 0.23%
- Est. flood insurance / yr
- $507 – $1,088
Fire risk 4/10 · Minor
- Est. fire insurance / yr
- $947 – $1,759
Heat risk 10/10 · Severe
- Hot days now (above 107°F)
- 7 days/yr
- Hot days in 30 yrs
- 30 days/yr
Wind risk 10/10 · Severe
- Chance of severe wind over 30 yrs
- 99.0%
Air-quality risk 2/10 · Minimal
- Unhealthy air days now
- 1 days/yr
- Unhealthy air days in 30 yrs
- 1 days/yr
Risk factors via First Street. Map © Google.
Why this score? — see what drove the C grade
The composite is a weighted blend of 9 inputs, each scored 0–100. Each bar is that input's sub-score; the figure is the points it added to the 100-point composite (weight × sub-score).
- Cash flow +22.0/30.0
- ARV discount +7.7/15.0
- DSCR +7.0/10.0
- 1% rule +5.2/10.0
- Schools +4.1/10.0
- Livability +3.4/5.0
- Rent growth +3.2/5.0
- Condition / age +2.5/5.0
- Appreciation +0.0/10.0
$175,900
🖨 Deal sheet 📄 Offer letter ✓ Due diligence
Listing remarks MLS
Don't miss out this 3 bedroom 2 bathroom home located in Spring Woods. Large rooms, eat-in kitchen with separate dining area. Home has plenty of storage available inside and out, stackable washer and dryer, new refrigerator, newer A/C system, complete with a deck to sit and enjoy our warm Florida winters. Spring Woods Community has a clubhouse, tennis courts, and a POOL to use at your convenience!! Call listing agent to view today.
Key facts
- Plenty of storage
- Separate dining room
- Eat in kitchen
Tags
Property features AI
Finance
- Financial info: Pets allowed: conditional (call for details)
- HOA & community: Homeowners association with a $78 monthly fee; HOA includes recreation facilities, reserve fund, street lights, and trash; Community amenities include clubhouse, pool, basketball court, billiard room, billiards, RV/boat storage, and management
Exterior
- Parking: Attached carport; 1 covered space; Has carport (1 space)
- Utilities: Public water; Public sewer; Cable available
- Home design: Manufactured home; Single-story; North-facing; Resale
- Construction: Vinyl siding; Shingle roof; Manufactured construction
- Exterior features: Deck; Patio; Fence; Outbuilding; Community pool
Interior
- Kitchen: Electric cooktop; Microwave; Dishwasher; Disposal; Refrigerator; Freezer
- Flooring: Laminate flooring; Vinyl flooring
- Bathrooms: 2 full bathrooms
- Heating & cooling: Central heating (electric); Central air (electric)
- Interior features: Impact glass windows; Shutters; Partially furnished; Living/dining room; Pantry; Tub with shower; Walk-in closet(s); Split bedroom layout
- Laundry & utility: Inside laundry; Washer; Dryer
Neighborhood map
What this means for you Summary
Snapshot
- This is a 3-bed/2.0-bath manufactured listed at $176k.
Deal economics
- At list price, monthly cash flow is $280 ($3k/yr) — positive.
- The deal already cash-flows at list — no discount required.
- Meets the 1% rule at list price ($2k rent vs $176k).
- Recommended offer: $171k (3.0% below list) — sets the bar for market timing.
Location & tenants
- Location reads 68/100 on livability (#507 in FL) — a middle-class / working-renter tenant base. Strengths: cost of living A+, housing A+, crime B; Watch: commute D, schools F, amenities F.
- Lee (suburban): math 47% / reading 50% proficiency, ranked #42 of 73 in FL (top 58%) — families likely to look elsewhere, expect single-tenant / working-renter base with shorter leases.
- Market conditions: Rents rising (+2.6%/yr); 841 active listings in the ZIP; 40 comparable units currently listed for rent nearby; rentals at typical pace (median 21d on market — plan ~3-4 weeks tenant-placement turnaround); 15,411 units permitted in Lee County in 2024 (4,686 in 5+ unit buildings).
- This rent runs 39% of the median local income ($55k/yr) — at the standard rent-burdened threshold; future hikes will face affordability resistance.
Forward outlook
- Local home prices are declining (-3.0%/yr); year-one equity from $1k of loan paydown is wiped out by about $5k of value loss. Plan a longer hold.
- Lee County population projected at +44% by 2050 — long-run rental-demand tailwind backs the buy-and-hold thesis.
Negotiation context
- It's been on market 60 days — a 3% lower offer ($171k) is reasonable based on typical stale-listing flexibility.
- 3 sale attempts since 9y ago with the ask held roughly flat each time — persistent listings suggest the price (not the market) is what's stuck; bring a comps-based counter.
- Current owner paid $96k; list at $176k implies a 83% gain — meaningful room to come down on a strong offer.
Risks & watch-outs
- Climate carrying-cost: severe wind risk, 99% chance of damaging wind over 30y; extreme-heat days projected 7→30/yr by 2055 (HVAC capex compounding) — expect insurance premiums to compound above CPI over the hold.
Questions for the listing agent
- It's been on market 60 days. Have you received any prior offers? Is the seller open to a 3% concession, seller financing, or rate buy-down credit?
- What does the HOA fee cover, when was the last increase, and are there any pending special assessments or reserve-fund shortfalls?
- Is there a deadline driving the sale (1031 exchange, divorce, estate, relocation)? That informs how much negotiation room exists.
- Schools are F-rated, which usually means shorter tenancies and higher turnover. Who's the typical renter profile here, and what's been the actual vacancy rate?
- What's the average days-on-market for RENTAL listings here right now (not sales)? A rising rental-DOM trend means longer vacancies and softer asking-rent achievability than the comps imply.
- What's the recent tenant-quality profile in this submarket — average credit score on applications, eviction rate, late-payment / NSF rate, and stable-employment percentage? A property-management company in the area should have these aggregated.
- How much new for-sale + rental construction is in the pipeline within 1–3 miles? Heavy new supply typically softens prices + rents 12–24 months out; constrained supply supports both.
Investment metrics
- 1% rule
- 1.02% ✓
- Cap rate
- 8.20%
- Cash-on-cash
- 6.81%
- DSCR
- 1.30
- GRM
- 8.2
CMA / ARV
- ARV (on-the-fly)
- $176,715
- Comps found
- 1
Show comp detail 1 sale within ~0.75 mi
| Address | Dist | Beds/Ba | Sqft | Sold | Price | $/sf | Match |
|---|---|---|---|---|---|---|---|
| 7640 Peyraud Dr | 0.18mi | 3/2.0 | 1,512 (+2%) | 10mo | $180,000 | $119 | 80 |
Match score weights: distance 35% · size 25% · config 20% · recency 20%. Top-matched comps best support the ARV.
Projected returns pro-forma
-3.0% appreciation · 2.63% rent growth · sell at horizon
- IRR
- -6.3%
- Equity multiple
- 0.77×
- Total profit
- $-11,379
- Equity at exit
- $26,227
- IRR
- 2.9%
- Equity multiple
- 1.21×
- Total profit
- $10,230
- Equity at exit
- $15,209
Cash invested: $49,252 (down + closing). Projections, not guarantees.
Landlord ↔ Tenant lean methodology
- Overall (STATE)
- 87 Strongly Landlord-Friendly
- State Florida
- 87 Strongly Landlord-Friendly · R+3
- County
- — inherits STATE
- City
- — inherits STATE
ZIP-level market 33917
- Home prices YoY
- -30.2%
- Rents YoY
- 2.6%
- Active inventory
- 841
- Price-to-rent
- 8.2×
Monthly cashflow live
- Estimated rent
- $1,796 high interval (Pro) →
- Mortgage (P&I)
- −$922
- Tax from tax record
- −$65 /mo · $786/yr
- Insurance
- −$73
- HOA
- −$78
- Vacancy / Maint / Mgmt
- −$377
- Net cashflow
- $280
Break-even live
UW: 25.0% down · 7.5% · 30yr · 1.5% tax · 5.0% vac · 8.0% maint · 8.0% mgmt
Financing live
Cash to close
- Down payment
- $43,975
- Closing costs
- $5,277
- Reserves months
- —
- Total cash needed
- —
Loan-product check · same deal, 3 products live
Conventional
25% down · 7.5% · 30yr
- Down + closing
- —
- Monthly P&I
- —
- Monthly cashflow
- —
- DSCR
- —
- Eligible?
- —
Personal DTI + credit; lowest rate.
DSCR
20% down · 8.5% · 30yr
- Down + closing
- —
- Monthly P&I
- —
- Monthly cashflow
- —
- DSCR
- —
- Eligible?
- —
No personal income docs; deal must DSCR.
Hard money
10% down · 12.0% · 12mo
- Down + closing
- —
- Monthly P&I
- —
- Monthly cashflow
- —
- DSCR
- —
- Eligible?
- —
Short-term bridge; refi at stabilization.
Rent comps 40 comps
| Address | Beds | Baths | Sqft | Rent | $/sqft | DOM | Units | Dist |
|---|---|---|---|---|---|---|---|---|
| 2500 Gail Helen Ct North Fort Myers, FL | 3.0 | 2.0 | 1296 | $1,500 | $1.16 | 23d | 1 | 0.07mi |
| 7622 Peyraud Dr North Fort Myers, FL | 3.0 | 2.0 | 1404 | $1,350 | $0.96 | 23d | 1 | 0.17mi |
| 280 Flame Ln North Fort Myers, FL | 2.0 | 2.0 | 980 | $1,350 | $1.38 | 3d | 1 | 0.34mi |
| 106 Gaslight Ave North Fort Myers, FL | 2.0 | 2.0 | 1056 | $1,400 | $1.33 | 3d | 1 | 0.35mi |
| 226 Lamplighter Ln North Fort Myers, FL | 2.0 | 1.0 | 900 | $899 | $1.00 | 23d | 1 | 0.47mi |
| 137 Lantern Pl Unit A North Fort Myers, FL | 2.0 | 1.0 | 1080 | $1,200 | $1.11 | 2d | 1 | 0.51mi |
| 15010 Caspian Tern Ct North Fort Myers, FL | 3.0 | 2.5 | 1583 | $1,850 | $1.17 | 23d | 1 | 0.54mi |
| 15020 Caspian Tern Ct Unit 103 North Fort Myers, FL | 2.0 | 2.5 | 1286 | $1,600 | $1.24 | 23d | 1 | 0.56mi |
| 15011 Caspian Tern Ct #101 North Fort Myers, FL | 3.0 | 2.5 | 1583 | $1,725 | $1.09 | 3d | 1 | 0.56mi |
| 15121 Piping Plover Ct North Fort Myers, FL | 3.0 | 2.5 | 1583 | $1,675 | $1.06 | 19d | 1 | 0.59mi |
| 15121 Piping Plover Ct #101 North Fort Myers, FL | 3.0 | 2.5 | 1583 | $1,675 | $1.06 | 23d | 1 | 0.59mi |
| 15050 Caspian Tern Ct #103 North Fort Myers, FL | 2.0 | 2.5 | 1365 | $1,520 | $1.11 | 23d | 1 | 0.62mi |
| 6391 Brant Bay Blvd #101 North Fort Myers, FL | 3.0 | 2.5 | 1583 | $1,700 | $1.07 | 23d | 1 | 0.62mi |
| 6391 Brant Bay Blvd Unit 102 North Fort Myers, FL | 3.0 | 2.5 | 1502 | $1,595 | $1.06 | 3d | 1 | 0.62mi |
| 15070 Caspian Tern Ct Unit 105 North Fort Myers, FL | 3.0 | 2.5 | 1583 | $1,750 | $1.11 | 3d | 1 | 0.64mi |
| 15100 Caspian Tern Ct North Fort Myers, FL | 2.0 | 2.5 | 1365 | $1,595 | $1.17 | 23d | 1 | 0.67mi |
| 15120 Caspian Tern Ct North Fort Myers, FL | 3.0 | 2.5 | 1583 | $1,600 | $1.01 | 16d | 1 | 0.70mi |
| 15120 Caspian Tern Ct #105 North Fort Myers, FL | 3.0 | 2.5 | 1583 | $1,695 | $1.07 | 2d | 1 | 0.70mi |
| 410 Suwanee Dr North Fort Myers, FL | 3.0 | 2.0 | 1480 | $1,650 | $1.11 | 23d | 1 | 0.77mi |
| 10754 Marlberry Way North Fort Myers, FL | 3.0 | 2.0 | 1661 | $1,900 | $1.14 | 3d | 1 | 0.82mi |
| 7306 Coon Rd North Fort Myers, FL | 2.0 | 1.0 | 1000 | $1,300 | $1.30 | 11d | 1 | 0.82mi |
| 5701 Longleaf Dr North Fort Myers, FL | 2.0 | 2.0 | 1233 | $1,570 | $1.27 | 11d | 1 | 0.86mi |
| 10820 Firebush Cir North Fort Myers, FL | 3.0 | 2.0 | 1661 | $1,895 | $1.14 | 3d | 1 | 0.86mi |
| 15610 Crystal Lake Dr North Fort Myers, FL | 2.0 | 2.0 | 968 | $1,850 | $1.91 | 23d | 1 | 0.86mi |
| 15610 Crystal Lake Dr #101 North Fort Myers, FL | 2.0 | 2.0 | 998 | $1,900 | $1.90 | 23d | 1 | 0.86mi |
| 16900 Slater Rd North Fort Myers, FL | 2.0–4.0 | 2.0 | 1120 | $1,524 | $1.36 | 2d | 17 | 0.88mi |
| 15250 Riverbend Blvd #204 North Fort Myers, FL | 2.0 | 2.0 | 1429 | $1,600 | $1.12 | 21d | 1 | 0.91mi |
| 15427 Crystal Lake Dr North Fort Myers, FL | 2.0 | 2.0 | 1021 | $3,200 | $3.13 | 23d | 1 | 0.93mi |
| 16031 Enclaves Cove Dr North Fort Myers, FL | 4.0 | 2.0 | 1850 | $2,499 | $1.35 | 14d | 1 | 0.95mi |
| 16031 Enclaves Cove Dr North Fort Myers, FL | 4.0 | 2.0 | 1850 | $2,499 | $1.35 | 3d | 1 | 0.95mi |
| 10820 Marlberry Way North Fort Myers, FL | 4.0 | 2.0 | 1850 | $2,350 | $1.27 | 23d | 1 | 0.98mi |
| 5707 Foxlake Dr #2 North Fort Myers, FL | 2.0 | 2.0 | 1114 | $1,500 | $1.35 | 23d | 1 | 1.04mi |
| 15493 Admiralty Cir #5 North Fort Myers, FL | 2.0 | 2.0 | 1146 | $2,400 | $2.09 | 23d | 1 | 1.08mi |
| 7050 Nantucket Cir #6 North Fort Myers, FL | 2.0 | 2.0 | 950 | $3,000 | $3.16 | 16d | 1 | 1.11mi |
| 7050 Nantucket Cir North Fort Myers, FL | 2.0 | 2.0 | 950 | $3,000 | $3.16 | 23d | 1 | 1.11mi |
| 2388 Case Ln North Fort Myers, FL | 3.0 | 2.0 | 1064 | $1,825 | $1.72 | 2d | 1 | 1.18mi |
| 2376 Case Ln Unit A North Fort Myers, FL | 2.0 | 2.0 | 1440 | $1,800 | $1.25 | 23d | 1 | 1.18mi |
| 15080 Riverbend Blvd #802 North Fort Myers, FL | 2.0 | 2.0 | 1344 | $1,850 | $1.38 | 21d | 1 | 1.20mi |
| 947 Strongbox Ln North Fort Myers, FL | 2.0 | 2.0 | 1000 | $1,300 | $1.30 | 23d | 1 | 1.27mi |
| 1439 Glick Dr North Fort Myers, FL | 3.0 | 1.0 | 1134 | $1,500 | $1.32 | 2d | 1 | 1.30mi |
HOA detail
- Monthly dues
- $78 · $936/yr
- Likely covers
- pool
Listing history 21 events
-
2026-06-17days on market $175,900 Active 60 DOM
-
2026-06-16days on market $175,900 Active 59 DOM
-
2026-06-15days on market $175,900 Active 58 DOM
-
2026-06-13days on market $175,900 Active 56 DOM
-
2026-06-10days on market $175,900 Active 53 DOM
-
2026-06-09days on market $175,900 Active 52 DOM
-
2026-06-07days on market $175,900 Active 50 DOM
-
2026-06-03days on market $175,900 Active 46 DOM
-
2026-06-02days on market $175,900 Active 45 DOM
-
2026-06-01days on market $175,900 Active 44 DOM
-
2026-05-31days on market $175,900 Active 43 DOM
-
2026-05-08price $175,900
-
2026-04-22status Active
-
2026-04-20status Pending
-
2026-04-16$179,700 Active
-
2018-02-19soldstatus $96,000
-
2018-02-15soldstatus $96,000 Sold 435-char remark
Show marketing remark (435 chars)
Don't miss out this 3 bedroom 2 bathroom home located in Spring Woods. Large rooms, eat-in kitchen with separate dining area. Home has plenty of storage available inside and out, stackable washer and dryer, new refrigerator, newer A/C system, complete with a deck to sit and enjoy our warm Florida winters. Spring Woods Community has a clubhouse, tennis courts, and a POOL to use at your convenience!! Call listing agent to view today.
-
2018-01-16status Pending 435-char remark
Show marketing remark (435 chars)
Don't miss out this 3 bedroom 2 bathroom home located in Spring Woods. Large rooms, eat-in kitchen with separate dining area. Home has plenty of storage available inside and out, stackable washer and dryer, new refrigerator, newer A/C system, complete with a deck to sit and enjoy our warm Florida winters. Spring Woods Community has a clubhouse, tennis courts, and a POOL to use at your convenience!! Call listing agent to view today.
-
2018-01-02status Pending With Contingencies 435-char remark
Show marketing remark (435 chars)
Don't miss out this 3 bedroom 2 bathroom home located in Spring Woods. Large rooms, eat-in kitchen with separate dining area. Home has plenty of storage available inside and out, stackable washer and dryer, new refrigerator, newer A/C system, complete with a deck to sit and enjoy our warm Florida winters. Spring Woods Community has a clubhouse, tennis courts, and a POOL to use at your convenience!! Call listing agent to view today.
-
2017-12-02$99,500 Active 435-char remark
Show marketing remark (435 chars)
Don't miss out this 3 bedroom 2 bathroom home located in Spring Woods. Large rooms, eat-in kitchen with separate dining area. Home has plenty of storage available inside and out, stackable washer and dryer, new refrigerator, newer A/C system, complete with a deck to sit and enjoy our warm Florida winters. Spring Woods Community has a clubhouse, tennis courts, and a POOL to use at your convenience!! Call listing agent to view today.
-
1994-09-13soldstatus $295,000
ⓘ Source: listings_history table (triggers on properties + properties_extension) + one-shot
backfill from property_details.listing_events for pre-trigger history.
Tax reassessment forecast FL · Resets to sale price
- Current annual tax
- $786 · $65/mo
- Projected year-2 tax
- $1,460 · $122/mo
- Expected delta
- +$674/yr (+$56/mo · 85.8%)
ⓘ Screening estimate from a state-policy table — verify with the county assessor before closing.
Climate risk First Street
- Flood 4/10 Moderate FEMA zone X (shaded) · 23% chance over 30 yrs
- Wildfire 4/10 Moderate
- Heat 10/10 Extreme 7 d/yr ≥107°F today · 30 d/yr by 30 yrs out
- Wind 10/10 Extreme 99% chance of damaging wind over 30 yrs
- Air quality 2/10 Low 1 unhealthy d/yr today · 1 by 30 yrs out
Nearby sold comps map
Loading sold comps map…
Walkable amenities ~0.75 mi
Loading nearby amenities…
Taxation est. · year 1
- Rental income
- $21,552
- − Mortgage interest
- −$9,853
- − Property taxes
- −$786
- − Insurance
- −$880
- − Repairs & maintenance
- −$1,724
- − Management
- −$1,724
- − HOA
- −$936
- − Depreciation
- −$5,117
- Taxable income
- $532
- Est. tax owed @ 24.0%
- −$128
- After-tax cash flow
- $3,228/yr
For passive investors: Depreciation is non-cash, so a rental often shows a tax loss while cash-flowing — sheltering income. Rental losses are passive: they offset passive income freely, and up to $25,000/yr can offset ordinary (W-2) income if you actively participate and your MAGI is under $100k (phasing out to $0 by $150k); unused losses carry forward. On sale, claimed depreciation is recaptured at up to 25%, and gains may owe capital-gains tax (a 1031 exchange can defer both). Figures are a year-1 estimate at your 24.0% rate — not tax advice; consult a CPA.
Schools (NCES district)
- District
- Lee
- NCES district ID
- 1201080
- Math proficiency
- 47% ▼ -11.00%
- Reading proficiency
- 50% ▼ -4.00%
- Median HH income
- $49,518
- Composite
- 41.49/100
- National rank
- #3458
- State rank
- #42 of 73 in FL
Livability — Suncoast Estates
- Score
- 68/100
- State rank
- #507
- US rank
- #9351
Category grades
Schools grade is shown separately in the Schools card above.
Census & demographics
- Census place
- Suncoast Estates, FL
- County
- Lee County · 788,662 people
- City population
- 57,035
- Metro
- Cape Coral-Fort Myers, FL
- Population (ZIP)
- 33,380
- Household income
- $55,000
- Rent vs Own
- Severe rent burden
- 775.0
Population outlook (Lee County) Hauer SSP2
- Today (2025)
- 871,946 people
- By 2030
- 955,468 · +9.6%
- By 2040
- 1,113,587 · +27.7%
- By 2050
- 1,256,891 · +44.1%
- By 2075
- 1,560,270 · +78.9%
- By 2100
- 1,726,848 · +98.0%
Race, ethnicity, and origin ACS 2023
- Neighborhood character
- Predominantly White (85%)
- Race & ethnicity
- White 85% Hispanic / Latino 10% Two or more races 7% Asian 1% Black 1%
- Hispanic origin (detail)
- Mexican 2% Puerto Rican 1% Cuban 3%
- Common ancestry
- Lithuanian 3% Romanian 3% Slovak 2%
- Foreign-born
- 10% · Canada
- Languages at home
- 88% English-only · Spanish 9% Other Indo-European 1% Russian/Polish/Slavic 1%
Political lean MEDSL · Lee
- 2024 margin
- Strong R (+28.4) · D 35.5% · R 63.9%
- 2008→2024 swing
- -18.0pp toward R · 2008: -10.4pp · 2024: -28.4pp
- All cycles
- 2024: R+28.4 2020: R+19.2 2016: R+20.4 2012: R+16.6 2008: R+10.4
Not yet ingested
- Civics
- —
Market trends
- HPI YoY
- ▼ -122.28%
- Current HPI
- 282.2895
- Rent YoY
- ▲ 2.63%
- Metro
- Cape Coral-Fort Myers, FL
- State GDP YoY
- ▲ 3.28%
- F500 in state
- 36
Industry mix (Fortune 500 HQ in FL)
| Industry | F500 HQs | Revenue |
|---|---|---|
| Industrial Technology | 2 | $29B |
|
||
| Insurance | 2 | $17B |
|
||
| Retail | 1 | $60B |
|
||
| Technology Distribution | 1 | $58B |
|
||
| Homebuilding | 1 | $35B |
|
||
| Technology Manufacturing | 1 | $35B |
|
||
Price history
-40.4% since first listed10 events — show timeline
- 2026-05-08 Price Changed $175,900 FORTMLS
- 2026-04-22 Relisted — FORTMLS
- 2026-04-20 Pending — FORTMLS
- 2026-04-16 Listed $179,700 FORTMLS
- 2018-02-19 Sold (Public Records) $96,000 Public Records
- 2018-02-15 Sold (MLS) $96,000 FORTMLS
- 2018-01-16 Pending — FORTMLS
- 2018-01-02 Pending — FORTMLS
- 2017-12-02 Listed $99,500 FORTMLS
- 1994-09-13 Sold (Public Records) $295,000 Public Records
Property tax history
+15.1%/yrLatest (2025): $786 · +4.5% YoY. Source: county tax records.
Cash-flow waterfall
monthlySold comps — $/sqft
last 12 mo · ≤1 miLoading sold comps…