8115 Levee Rd · Camargo, KY
Flood risk 1/10 · Minimal
- FEMA flood zone
- X (unshaded)
- Chance of flooding over 30 yrs
- 0.0%
- Est. flood insurance / yr
- $507 – $1,088
Fire risk 6/10 · Moderate
- Est. fire insurance / yr
- $839 – $1,559
Heat risk 4/10 · Minor
- Hot days now (above 102°F)
- 7 days/yr
- Hot days in 30 yrs
- 19 days/yr
Wind risk 3/10 · Minor
- Chance of severe wind over 30 yrs
- 5.0%
Air-quality risk 1/10 · Minimal
- Unhealthy air days now
- 0 days/yr
- Unhealthy air days in 30 yrs
- 0 days/yr
Risk factors via First Street. Map © Google.
Why this score? — see what drove the B- grade
The composite is a weighted blend of 9 inputs, each scored 0–100. Each bar is that input's sub-score; the figure is the points it added to the 100-point composite (weight × sub-score).
- Cash flow +25.9/30.0
- DSCR +8.7/10.0
- Appreciation +8.3/10.0
- ARV discount +7.5/15.0
- 1% rule +5.5/10.0
- Livability +3.2/5.0
- Schools +2.8/10.0
- Rent growth +2.5/5.0
- Condition / age +2.5/5.0
$141,000
🖨 Deal sheet (PDF) 📄 Offer letter ✓ Due diligence
Listing remarks MLS
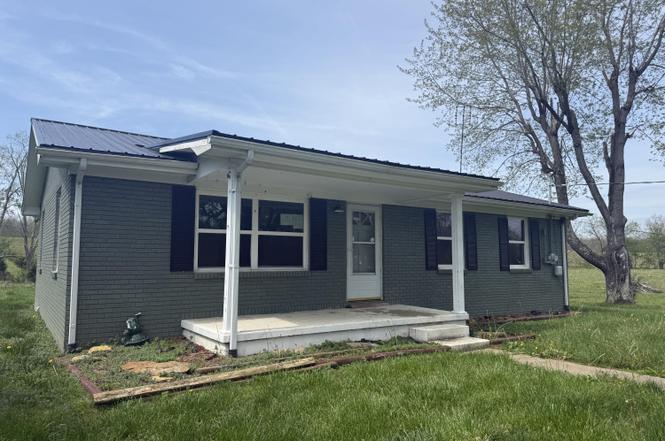
If you have been searching for a nice home on a big lot, look no further! This charming painted brick ranch is ready for you. The home sets on a flat.732-acre lot with farm views off the back. Conveniently located right off of Levee Road, less than 10 minutes from the bypass in Mt. Sterling. Get that country feeling without being far from town! The home has new LVT flooring in the bedrooms, bath, and kitchen. The original hardwood flooring was left intact in the areas where it was present. Newly painted exterior, new windows, fixtures, and tin roof. Don't miss your chance, schedule your showing today!
Key facts
- Metal roof
- Large eat in kitchen
- Level yard
Tags
Property features AI
Exterior
- Parking: Driveway
- Utilities: Public water; Public sewer and septic tank; Natural gas available
- Home design: Single-family house; One level; Has a view
- Construction: Brick construction; Metal roof
- Exterior features: Covered patio/porch; Deck; Partial fencing; Cleared lot; Shed(s)
Interior
- Kitchen: Electric oven; Electric range; Convection oven; Dishwasher; Refrigerator; Walk-out kitchen
- Bedrooms: Primary bedroom with closet (12 x 12); Bedroom 2 with closet (12 x 11); Bedroom 3 with closet (11 x 10)
- Flooring: Laminate flooring
- Bathrooms: 1 full bathroom
- Heating & cooling: Forced air heating; Central air conditioning
- Interior features: Eat-in kitchen; Primary bath
- Laundry & utility: Washer hookup; Electric dryer hookup
Neighborhood map
What this means for you Summary
Snapshot
- This is a 3-bed/1.0-bath single-family listed at $141k.
Deal economics
- At list price, monthly cash flow is $346 ($4k/yr) — positive.
- The deal already cash-flows at list — no discount required.
- Meets the 1% rule at list price ($1k rent vs $141k).
Location & tenants
- Location reads 64/100 on livability (#307 in KY) — a middle-class / working-renter tenant base. Strengths: crime A+, cost of living A+, housing A+; Watch: health & safety D+, amenities F, commute F.
- Montgomery County (rural): math 24% / reading 44% proficiency, ranked #76 of 165 in KY (top 46%) — families likely to look elsewhere, expect single-tenant / working-renter base with shorter leases.
- Zoned schools: Mapleton Elementary School (math 32% / reading 47%, grade F, #208 of 676 statewide, top 34%, 510 students, 56% FRL); Mcnabb Middle School (math 19% / reading 47%, grade F, #112 of 217 statewide, top 53%, 1,018 students, 55% FRL); Montgomery County High School (math 29% / reading 39%, grade F, #89 of 254 statewide, top 36%, 1,279 students, 47% FRL) — zoned schools at 53% FRL track the district average.
- Market conditions: 42 active listings in the ZIP; 56 units permitted in Montgomery County in 2024 (0 in 5+ unit buildings).
Forward outlook
- In year one you build about $10k of equity ($975 loan paydown + $9k appreciation (6.7% local appreciation)).
- Montgomery County population projected at +11% by 2050 — modest demand growth; plan on rents tracking national, not racing it.
- At projected returns (6.7% appreciation + 3.0% rent growth), your $39k cash investment doubles in ~3 years — after that, you're playing with house money.
- By year 4, paydown + projected appreciation supports a ~$36k cash-out refi (75% LTV) — recoverable capital for the next deal without selling this one.
Negotiation context
- Only 11 days on market — expect competitive offers; lowballing is unlikely to land.
- 3 sale attempts since 21y ago with the ask held roughly flat each time — persistent listings suggest the price (not the market) is what's stuck; bring a comps-based counter.
Risks & watch-outs
- Climate carrying-cost: major wildfire risk — expect insurance premiums to compound above CPI over the hold.
Questions for the listing agent
- Is there a deadline driving the sale (1031 exchange, divorce, estate, relocation)? That informs how much negotiation room exists.
- Schools are F-rated, which usually means shorter tenancies and higher turnover. Who's the typical renter profile here, and what's been the actual vacancy rate?
- What's the average days-on-market for RENTAL listings here right now (not sales)? A rising rental-DOM trend means longer vacancies and softer asking-rent achievability than the comps imply.
- What's the recent tenant-quality profile in this submarket — average credit score on applications, eviction rate, late-payment / NSF rate, and stable-employment percentage? A property-management company in the area should have these aggregated.
- How much new for-sale + rental construction is in the pipeline within 1–3 miles? Heavy new supply typically softens prices + rents 12–24 months out; constrained supply supports both.
Investment metrics
- 1% rule
- 1.05% ✓
- Cap rate
- 9.24%
- Cash-on-cash
- 10.52%
- DSCR
- 1.47
- GRM
- 7.9
CMA / ARV
- ARV (on-the-fly)
- $343,476
- Comps found
- 1
Show comp detail 1 sale within ~0.75 mi
| Address | Dist | Beds/Ba | Sqft | Sold | Price | $/sf | Match |
|---|---|---|---|---|---|---|---|
| 739 Old Hwy 11 | 0.17mi | 3/2.0 | 1,344 (+10%) | 2mo | $379,000 | $282 | 69 |
Match score weights: distance 35% · size 25% · config 20% · recency 20%. Top-matched comps best support the ARV.
Projected returns pro-forma
6.7% appreciation · 3.0% rent growth · sell at horizon
- IRR
- 25.5%
- Equity multiple
- 2.74×
- Total profit
- $68,595
- Equity at exit
- $94,916
- IRR
- 23.6%
- Equity multiple
- 5.64×
- Total profit
- $183,060
- Equity at exit
- $177,822
Cash invested: $39,480 (down + closing). Projections, not guarantees.
Landlord ↔ Tenant lean methodology
- Overall (STATE)
- 83 Strongly Landlord-Friendly
- State Kentucky
- 83 Strongly Landlord-Friendly · R+16
- County
- — inherits STATE
- City
- — inherits STATE
ZIP-level market 40337
- Home prices YoY
- 2.9%
- Active inventory
- 42
- Price-to-rent
- 7.9×
Monthly cashflow live
- Estimated rent
- $1,484 medium interval (Pro) →
- Mortgage (P&I)
- −$739
- Tax from tax record
- −$28 /mo · $334/yr
- Insurance
- −$59
- HOA
- −$0
- Vacancy / Maint / Mgmt
- −$312
- Net cashflow
- $346
Break-even live
Sensitivity live
| Price | -10% $426 | -5% $386 | +0% $346 | +5% $306 | +10% $266 |
|---|---|---|---|---|---|
| Rent | -10% $229 | -5% $288 | +0% $346 | +5% $405 | +10% $463 |
| Rate | -1.0pp $417 | -0.5pp $382 | base $346 | +0.5pp $310 | +1.0pp $273 |
UW: 25.0% down · 7.5% · 30yr · 1.5% tax · 5.0% vac · 8.0% maint · 8.0% mgmt
Financing live
Cash to close
- Down payment
- $35,250
- Closing costs
- $4,230
- Reserves months
- —
- Total cash needed
- —
Loan-product check · same deal, 3 products live
Conventional
25% down · 7.5% · 30yr
- Down + closing
- —
- Monthly P&I
- —
- Monthly cashflow
- —
- DSCR
- —
- Eligible?
- —
Personal DTI + credit; lowest rate.
DSCR
20% down · 8.5% · 30yr
- Down + closing
- —
- Monthly P&I
- —
- Monthly cashflow
- —
- DSCR
- —
- Eligible?
- —
No personal income docs; deal must DSCR.
Hard money
10% down · 12.0% · 12mo
- Down + closing
- —
- Monthly P&I
- —
- Monthly cashflow
- —
- DSCR
- —
- Eligible?
- —
Short-term bridge; refi at stabilization.
Listing history 8 events
-
2026-06-22days on market $141,000 Active 11 DOM
-
2026-06-18days on market $141,000 Active 8 DOM
-
2026-06-17days on market $141,000 Active 7 DOM
-
2026-06-16days on market $141,000 Active 6 DOM
-
2026-06-15days on market $141,000 Active 5 DOM
-
2026-06-14days on market $141,000 Active 3 DOM
-
2026-06-13remarks 361-char remark
-
2026-06-13$141,000 Active 2 DOM
ⓘ Source: listings_history table (triggers on properties + properties_extension) + one-shot
backfill from property_details.listing_events for pre-trigger history.
Tax reassessment forecast KY · Resets to sale price
- Current annual tax
- $334 · $28/mo
- Projected year-2 tax
- $1,213 · $101/mo
- Expected delta
- +$878/yr (+$73/mo · 262.9%)
ⓘ Screening estimate from a state-policy table — verify with the county assessor before closing.
Climate risk First Street
- Flood 1/10 Low FEMA zone X (unshaded) · 0% chance over 30 yrs
- Wildfire 6/10 Major
- Heat 4/10 Moderate 7 d/yr ≥102°F today · 19 d/yr by 30 yrs out
- Wind 3/10 Moderate 5% chance of damaging wind over 30 yrs
- Air quality 1/10 Low 0 unhealthy d/yr today · 0 by 30 yrs out
Nearby sold comps map
Loading sold comps map…
Walkable amenities ~0.75 mi
Loading nearby amenities…
Taxation est. · year 1
- Rental income
- $17,807
- − Mortgage interest
- −$7,898
- − Property taxes
- −$334
- − Insurance
- −$705
- − Repairs & maintenance
- −$1,425
- − Management
- −$1,425
- − Depreciation
- −$4,102
- Taxable income
- $1,918
- Est. tax owed @ 24.0%
- −$460
- After-tax cash flow
- $3,695/yr
For passive investors: Depreciation is non-cash, so a rental often shows a tax loss while cash-flowing — sheltering income. Rental losses are passive: they offset passive income freely, and up to $25,000/yr can offset ordinary (W-2) income if you actively participate and your MAGI is under $100k (phasing out to $0 by $150k); unused losses carry forward. On sale, claimed depreciation is recaptured at up to 25%, and gains may owe capital-gains tax (a 1031 exchange can defer both). Figures are a year-1 estimate at your 24.0% rate — not tax advice; consult a CPA.
Schools (NCES district)
- District
- Montgomery County
- NCES district ID
- 2104250
- Math proficiency
- 24% ▼ -21.00%
- Reading proficiency
- 44% ▼ -14.00%
- Median HH income
- $38,262
- Composite
- 28.32/100
- National rank
- #6782
- State rank
- #76 of 165 in KY
Livability — Camargo
- Score
- 64/100
- State rank
- #307
- US rank
- #14656
Category grades
Schools grade is shown separately in the Schools card above.
Census & demographics
- Population (ZIP)
- 5,461
Population outlook (Montgomery County) Hauer SSP2
- Today (2025)
- 29,814 people
- By 2030
- 30,705 · +3.0%
- By 2040
- 32,189 · +8.0%
- By 2050
- 33,131 · +11.1%
- By 2075
- 33,991 · +14.0%
- By 2100
- 32,097 · +7.7%
Race, ethnicity, and origin ACS 2023
- Neighborhood character
- Predominantly White (97%)
- Race & ethnicity
- White 97% Two or more races 2% Hispanic / Latino 1%
- Common ancestry
- Slovak 3% Lithuanian 2% Italian 1%
- Foreign-born
- 1%
- Languages at home
- 98% English-only · Spanish 1% German/W. Germanic 1%
Political lean MEDSL · Montgomery
- 2024 margin
- Solid R (+46.6) · D 26.0% · R 72.6% · Other 1.5%
- 2008→2024 swing
- -30.0pp toward R · 2008: -16.6pp · 2024: -46.6pp
- All cycles
- 2024: R+46.6 2020: R+41.8 2016: R+41.1 2012: R+26.3 2008: R+16.6
Not yet ingested
- Civics
- —
Market trends
- HPI YoY
- ▲ 6.70%
- Current HPI
- 241.3612
- Rent YoY
- —
- Metro
- —
- State GDP YoY
- ▲ 1.81%
- F500 in state
- 4
Industry mix (Fortune 500 HQ in KY)
| Industry | F500 HQs | Revenue |
|---|---|---|
| Healthcare | 1 | $118B |
|
||
| Food / Beverage | 1 | $7B |
|
||
Price history
+253.4% since first listed11 events — show timeline
- 2026-06-10 Price Changed $141,000 NKMLS
- 2026-06-10 Listed $140,000 NKMLS
- 2023-01-31 Sold (Public Records) $160,000 Public Records
- 2023-01-23 Sold (MLS) $160,000 ImagineMLS
- 2023-01-18 Pending — ImagineMLS
- 2022-12-22 Contingent — ImagineMLS
- 2022-12-01 Listed $160,000 ImagineMLS
- 2022-07-05 Sold (Public Records) $93,000 Public Records
- 2006-01-31 Sold (MLS) $37,000 ImagineMLS
- 2006-01-03 Listing Removed — ImagineMLS
- 2005-12-22 Listed $39,900 ImagineMLS
Cash-flow waterfall
monthlySold comps — $/sqft
last 12 mo · ≤1 miLoading sold comps…