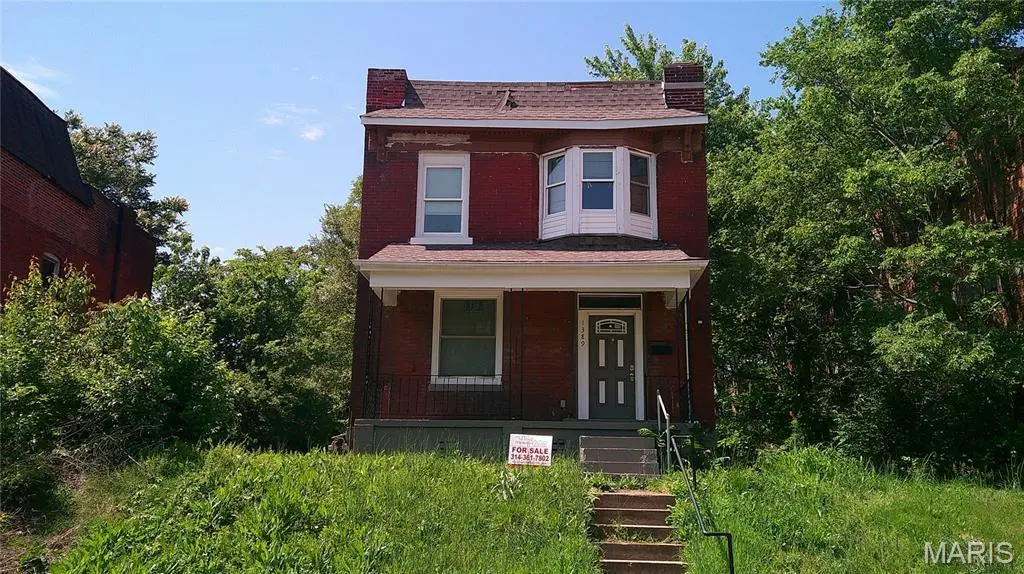
1389 Hamilton Ave · St. Louis, MO
Flood risk 1/10 · Minimal
- FEMA flood zone
- X (unshaded)
- Chance of flooding over 30 yrs
- 0.0%
- Est. flood insurance / yr
- $473 – $860
Fire risk 1/10 · Minimal
- Est. fire insurance / yr
- $1,054 – $1,958
Heat risk 5/10 · Moderate
- Hot days now (above 107°F)
- 7 days/yr
- Hot days in 30 yrs
- 21 days/yr
Wind risk 2/10 · Minimal
- Chance of severe wind over 30 yrs
- 1.0%
Air-quality risk 4/10 · Minor
- Unhealthy air days now
- 4 days/yr
- Unhealthy air days in 30 yrs
- 5 days/yr
Risk factors via First Street. Map © Google.
Why this score? — see what drove the C grade
The composite is a weighted blend of 9 inputs, each scored 0–100. Each bar is that input's sub-score; the figure is the points it added to the 100-point composite (weight × sub-score).
- Cash flow +30.0/30.0
- 1% rule +10.0/10.0
- DSCR +10.0/10.0
- Rent growth +3.1/5.0
- Livability +2.5/5.0
- Condition / age +2.5/5.0
- Schools +1.2/10.0
- ARV discount +0.0/15.0
- Appreciation +0.0/10.0
$65,000
🖨 Deal sheet 📄 Offer letter ✓ Due diligence
Listing remarks MLS
3 bedroom 1 bath brick two story home close to Amherst Park. As-is and seller will make no repairs nor provide any inspections. Cash Only. Proof of funds required. Cash transactions are subject to special deed restrictions: The Grantee(s), or purchaser(s), of the Property may not re-sell, record an additional conveyance document, or otherwise transfer title to the Property within 60 days following the Grantors execution of this deed. Please allow 2-3 business days for sellers response.
Key facts
- Exposed brick
- Fenced yard
- Newer lvp
Tags
Property features AI
Finance
- Other: No pool
- Financial info: Owned by bank; Property listed in fixer condition; Seller open to considering concessions
Exterior
- Utilities: Public water; Public sewer; Electric service by Ameren; Cable available
- Home design: Single-family residence; Two levels
- Construction: Brick construction
- Exterior features: City lot; Lot dimensions approximately 25 x 110
Interior
- Bedrooms: Three bedrooms on the main level
- Bathrooms: One full bathroom on the main level
- Heating & cooling: Forced air heating; Central air conditioning
- Interior features: Full basement
Neighborhood map
What this means for you Summary
Snapshot
- This is a 3-bed/1.0-bath single-family listed at $65k.
Deal economics
- At list price, monthly cash flow is $1k ($12k/yr) — positive.
- The deal already cash-flows at list — no discount required.
- Meets the 1% rule at list price ($2k rent vs $65k).
- Recommended offer: $63k (3.0% below list) — sets the bar for market timing.
- Cap rate 24.8% vs local median 5.0% in St. Louis — top-decile yield for the area; either an underpriced asset or a hidden risk that comps aren't pricing in. Stress-test before assuming the spread holds.
Location & tenants
- Location reads: area grade C — affects rentability + tenant quality, not the cash-flow math above.
- St. Louis City (urban): math 10% / reading 18% proficiency, ranked #312 of 324 in MO (top 96%) — low school quality limits family demand, transient renter base, plan for 1-2y turnover; 80% free/reduced lunch — lower-income household profile, screen leases tightly.
- Zoned schools: Sigel Elem. Comm. Ed. Ctr. (math 2% / reading 2%, grade F, #1,099 of 1,115 statewide, top 100%, 219 students, 99% FRL); Sumner High (math 2% / reading 2%, grade F, #520 of 521 statewide, top 100%, 264 students, 99% FRL) — zoned schools average 99% FRL vs 80% district-wide (18 pts higher); higher-poverty schools than district average — tighter screening recommended.
- Market conditions: Rents rising (+2.4%/yr); 118 active listings in the ZIP; 35 comparable units currently listed for rent nearby; rentals at typical pace (median 24d on market — plan ~3-4 weeks tenant-placement turnaround); 46% of comp listings sitting > 30 days — soft ceiling on asking rent; 294 units permitted in St. Louis city in 2024 (227 in 5+ unit buildings).
Forward outlook
- Local home prices are declining (-3.0%/yr); year-one equity from $449 of loan paydown is wiped out by about $2k of value loss. Plan a longer hold.
- St. Louis County population projected to shrink 6% by 2050 — rents likely to lag national; underwrite the cash flow, not the appreciation.
- At projected returns (-3.0% appreciation + 2.4% rent growth), your $18k cash investment doubles in ~2 years — after that, you're playing with house money.
Negotiation context
- It's been on market 48 days — a 3% lower offer ($63k) is reasonable based on typical stale-listing flexibility.
- 2 sale attempts since 14y ago with the ask held roughly flat each time — persistent listings suggest the price (not the market) is what's stuck; bring a comps-based counter.
- Current owner paid $2k; list at $65k implies a 3150% gain — meaningful room to come down on a strong offer.
Risks & watch-outs
- Watch-outs: built in 1908 — expect roof / HVAC / electrical / plumbing capex.
- Climate carrying-cost: extreme-heat days projected 7→21/yr by 2055 (HVAC capex compounding) — expect insurance premiums to compound above CPI over the hold.
Questions for the listing agent
- It's been on market 48 days. Have you received any prior offers? Is the seller open to a 3% concession, seller financing, or rate buy-down credit?
- Built in 1908 — when were the roof, HVAC, electrical panel, plumbing, and water heater last replaced?
- Is there a deadline driving the sale (1031 exchange, divorce, estate, relocation)? That informs how much negotiation room exists.
- What's the average days-on-market for RENTAL listings here right now (not sales)? A rising rental-DOM trend means longer vacancies and softer asking-rent achievability than the comps imply.
- What's the recent tenant-quality profile in this submarket — average credit score on applications, eviction rate, late-payment / NSF rate, and stable-employment percentage? A property-management company in the area should have these aggregated.
- How much new for-sale + rental construction is in the pipeline within 1–3 miles? Heavy new supply typically softens prices + rents 12–24 months out; constrained supply supports both.
Investment metrics
- 1% rule
- 2.69% ✓
- Cap rate
- 24.78%
- Cash-on-cash
- 66.02%
- DSCR
- 3.94
- GRM
- 3.1
CMA / ARV
- ARV (median comp)
- $54,258
- List price
- $65,000
- Delta
- 19.80%
- Verdict
- OVERPRICED
- Comps
- 20 within 1.0 mi
Show comp detail 6 sales within ~0.75 mi
| Address | Dist | Beds/Ba | Sqft | Sold | Price | $/sf | Match |
|---|---|---|---|---|---|---|---|
| 1412 Rowan Ave | 0.10mi | 4/2.0 (+1) | 1,472 (-7%) | 6mo | $89,000 | $60 | 69 |
| 6036 Horton Pl | 0.74mi | 2/1.0 (-1) | 1,586 (0%) | 0mo | $109,000 | $69 | 60 |
| 6140 Minerva Ave | 0.29mi | 3/2.5 | 1,678 (+6%) | 14mo | $174,900 | $104 | 59 |
| 5827 Highland Ave | 0.55mi | 3/1.5 | 1,584 (-0%) | 22mo | $25,000 | $16 | 53 |
| 1366 Burd Ave | 0.57mi | 4/1.5 (+1) | 1,620 (+2%) | 15mo | $40,000 | $25 | 50 |
| 6025 Horton Pl | 0.70mi | 3/2.5 | 1,426 (-10%) | 18mo | $150,000 | $105 | 30 |
Match score weights: distance 35% · size 25% · config 20% · recency 20%. Top-matched comps best support the ARV.
Projected returns pro-forma
-3.0% appreciation · 2.39% rent growth · sell at horizon
- IRR
- 64.6%
- Equity multiple
- 3.87×
- Total profit
- $52,160
- Equity at exit
- $9,692
- IRR
- 68.8%
- Equity multiple
- 7.77×
- Total profit
- $123,153
- Equity at exit
- $5,620
Cash invested: $18,200 (down + closing). Projections, not guarantees.
Landlord ↔ Tenant lean methodology
- Overall (STATE)
- 81 Strongly Landlord-Friendly
- State Missouri
- 81 Strongly Landlord-Friendly · R+10
- County
- — inherits STATE
- City
- — inherits STATE
ZIP-level market 63112
- Rents YoY
- 2.4%
- Active inventory
- 118
- Price-to-rent
- 3.1×
Monthly cashflow live
- Estimated rent
- $1,748 high interval (Pro) →
- Mortgage (P&I)
- −$341
- Tax from tax record
- −$12 /mo · $139/yr
- Insurance
- −$27
- HOA
- −$0
- Vacancy / Maint / Mgmt
- −$367
- Net cashflow
- $1,001
Break-even live
UW: 25.0% down · 7.5% · 30yr · 1.5% tax · 5.0% vac · 8.0% maint · 8.0% mgmt
Financing live
Cash to close
- Down payment
- $16,250
- Closing costs
- $1,950
- Reserves months
- —
- Total cash needed
- —
Loan-product check · same deal, 3 products live
Conventional
25% down · 7.5% · 30yr
- Down + closing
- —
- Monthly P&I
- —
- Monthly cashflow
- —
- DSCR
- —
- Eligible?
- —
Personal DTI + credit; lowest rate.
DSCR
20% down · 8.5% · 30yr
- Down + closing
- —
- Monthly P&I
- —
- Monthly cashflow
- —
- DSCR
- —
- Eligible?
- —
No personal income docs; deal must DSCR.
Hard money
10% down · 12.0% · 12mo
- Down + closing
- —
- Monthly P&I
- —
- Monthly cashflow
- —
- DSCR
- —
- Eligible?
- —
Short-term bridge; refi at stabilization.
Rent comps 35 comps
| Address | Beds | Baths | Sqft | Rent | $/sqft | DOM | Units | Dist |
|---|---|---|---|---|---|---|---|---|
| 1266 Amherst Pl Unit 2nd floor St. Louis, MO | 2.0 | 1.0 | 1050 | $1,000 | $0.95 | 43d | 1 | 0.26mi |
| 5760 Theodosia Ave Saint Louis, MO | 3.0 | 1.5 | 1702 | $1,420 | $0.83 | 23d | 1 | 0.35mi |
| 1019 N Skinker Pkwy St. Louis, MO | 1.0–3.0 | 1.0–3.0 | 1137 | $2,795 | $2.46 | 1d | 9 | 0.83mi |
| 5345 Wells Ave Unit 2ND St. Louis, MO | 3.0 | 1.0 | 1127 | $1,095 | $0.97 | 23d | 1 | 0.89mi |
| 5804 Cates Ave Unit 2 St. Louis, MO | 3.0 | 1.0 | 1500 | $1,500 | $1.00 | 4d | 1 | 0.94mi |
| 5333 Patton Ave St. Louis, MO | 3.0 | 1.5 | 1262 | $1,250 | $0.99 | 43d | 1 | 0.97mi |
| 1420 Union Blvd Unit 2F St. Louis, MO | 2.0 | 1.0 | 1096 | $995 | $0.91 | 43d | 1 | 1.00mi |
| 5535 Delmar Blvd St. Louis, MO | 1.0–2.0 | 1.0–2.0 | 911 | $1,970 | $2.16 | 1d | 14 | 1.20mi |
| 629 Clara Ave Apt 26 St. Louis, MO | 2.0 | 2.0 | 1155 | $1,615 | $1.40 | 43d | 1 | 1.21mi |
| 6274 Cates Ave Saint Louis, MO | 3.0 | 2.0 | 1400 | $2,295 | $1.64 | 43d | 1 | 1.24mi |
| 5096 Minerva Ave Unit C St. Louis, MO | 3.0 | 1.0 | 1800 | $1,395 | $0.78 | 43d | 1 | 1.24mi |
| 1320 Academy Ave Unit A St. Louis, MO | 2.0 | 1.0 | 1600 | $1,090 | $0.68 | 43d | 1 | 1.24mi |
| 6105 Delmar Blvd Saint Louis, MO | 1.0–3.0 | 1.0–3.0 | 931 | $2,610 | $2.80 | 4d | 1 | 1.24mi |
| 6261 Clemens Ave Saint Louis, MO | 3.0 | 1.0 | 1200 | $1,700 | $1.42 | 43d | 1 | 1.26mi |
| 6036 Washington Blvd Apt 1W St. Louis, MO | 2.0 | 1.0 | 1200 | $1,350 | $1.12 | 17d | 1 | 1.31mi |
| 501 Clara Ave Saint Louis, MO | 1.0–2.0 | 1.0–2.0 | 915 | $1,885 | $2.06 | 1d | 21 | 1.35mi |
| 501 Clara Ave Saint Louis, MO | 1.0–2.0 | 1.0–2.0 | 850 | $1,845 | $2.17 | 14d | 21 | 1.35mi |
| 5783 McPherson Ave Unit 2FL St. Louis, MO | 3.0 | 2.0 | 1320 | $2,550 | $1.93 | 7d | 1 | 1.36mi |
| 5783 McPherson Ave Unit 1FL St. Louis, MO | 2.0 | 2.0 | 1250 | $1,950 | $1.56 | 7d | 1 | 1.36mi |
| 6009 Kingsbury Ave Saint Louis, MO | 3.0 | 1.0 | 1368 | $2,000 | $1.46 | 4d | 1 | 1.38mi |
| 6009 Kingsbury Ave Saint Louis, MO | 2.0 | 1.0 | 1368 | $1,300 | $0.95 | 23d | 1 | 1.38mi |
| 6017 Kingsbury Ave Unit 2f St. Louis, MO | 4.0 | 1.0 | 1500 | $3,250 | $2.17 | 17d | 1 | 1.38mi |
| 6017 Kingsbury Ave Unit 1F St. Louis, MO | 3.0 | 1.0 | 1600 | $2,700 | $1.69 | 17d | 1 | 1.39mi |
| 716 Westgate Ave Unit 3 University City, MO | 3.0 | 2.0 | 1500 | $2,995 | $2.00 | 43d | 1 | 1.39mi |
| 445 Clara Ave Saint Louis, MO | 2.0 | 2.5 | 1188 | $2,750 | $2.31 | 43d | 1 | 1.40mi |
| 6409 Enright Ave University City, MO | 3.0 | 1.5 | 1320 | $2,420 | $1.83 | 1d | 2 | 1.40mi |
| 6827 Melrose Ave Saint Louis, MO | 2.0 | 1.0 | 1200 | $1,300 | $1.08 | 7d | 1 | 1.41mi |
| 5861 Nina Pl Apt 2W St. Louis, MO | 3.0 | 1.0 | 1400 | $1,750 | $1.25 | 43d | 1 | 1.42mi |
| 5861 Nina Pl Unit 3W St. Louis, MO | 3.0 | 1.0 | 1550 | $1,750 | $1.13 | 17d | 1 | 1.42mi |
| 5920 McPherson Ave Unit 1st Floor St. Louis, MO | 3.0 | 1.0 | 1300 | $2,550 | $1.96 | 43d | 1 | 1.45mi |
| 5803 Waterman Blvd St. Louis, MO | 2.0 | 2.0 | 1432 | $1,850 | $1.29 | 43d | 1 | 1.46mi |
| 603 Westgate Ave University City, MO | 2.0 | 2.5 | 1290 | $1,750 | $1.36 | 43d | 1 | 1.47mi |
| 5130 Kensington Ave Unit 1 St. Louis, MO | 3.0 | 2.0 | 1200 | $1,245 | $1.04 | 23d | 1 | 1.48mi |
| 5223 Ashland Ave Unit 2 St. Louis, MO | 3.0 | 1.0 | 2200 | $1,450 | $0.66 | 43d | 1 | 1.48mi |
| 5223 Ashland Ave Saint Louis, MO | 2.0 | 1.0 | 2200 | $1,250 | $0.57 | 43d | 1 | 1.48mi |
Listing history 18 events
-
2026-06-18days on market $65,000 Active 48 DOM
-
2026-06-17days on market $65,000 Active 47 DOM
-
2026-06-16days on market $65,000 Active 46 DOM
-
2026-06-15days on market $65,000 Active 45 DOM
-
2026-06-13days on market $65,000 Active 43 DOM
-
2026-06-09days on market $65,000 Active 39 DOM
-
2026-06-08days on market $65,000 Active 38 DOM
-
2026-06-07days on market $65,000 Active 37 DOM
-
2026-06-05days on market $65,000 Active 34 DOM
-
2026-06-03days on market $65,000 Active 33 DOM
-
2026-06-02days on market $65,000 Active 32 DOM
-
2026-06-01days on market $65,000 Active 31 DOM
-
2026-05-31days on market $65,000 Active 30 DOM
-
2026-05-01$65,000 Active 672-char remark
-
2022-06-16soldstatus $2,000
-
2012-06-22soldstatus 491-char remark
Show marketing remark (491 chars)
3 bedroom 1 bath brick two story home close to Amherst Park. As-is and seller will make no repairs nor provide any inspections. Cash Only. Proof of funds required. Cash transactions are subject to special deed restrictions: The Grantee(s), or purchaser(s), of the Property may not re-sell, record an additional conveyance document, or otherwise transfer title to the Property within 60 days following the Grantors execution of this deed. Please allow 2-3 business days for sellers response.
-
2012-05-08$1,600 491-char remark
Show marketing remark (491 chars)
3 bedroom 1 bath brick two story home close to Amherst Park. As-is and seller will make no repairs nor provide any inspections. Cash Only. Proof of funds required. Cash transactions are subject to special deed restrictions: The Grantee(s), or purchaser(s), of the Property may not re-sell, record an additional conveyance document, or otherwise transfer title to the Property within 60 days following the Grantors execution of this deed. Please allow 2-3 business days for sellers response.
-
2002-09-11soldstatus $36,800
ⓘ Source: listings_history table (triggers on properties + properties_extension) + one-shot
backfill from property_details.listing_events for pre-trigger history.
Tax reassessment forecast MO · Resets to sale price
- Current annual tax
- $139 · $12/mo
- Projected year-2 tax
- $630 · $53/mo
- Expected delta
- +$491/yr (+$41/mo · 352.5%)
ⓘ Screening estimate from a state-policy table — verify with the county assessor before closing.
Climate risk First Street
- Flood 1/10 Low FEMA zone X (unshaded) · 0% chance over 30 yrs
- Wildfire 1/10 Low
- Heat 5/10 Major 7 d/yr ≥107°F today · 21 d/yr by 30 yrs out
- Wind 2/10 Low 100% chance of damaging wind over 30 yrs
- Air quality 4/10 Moderate 4 unhealthy d/yr today · 5 by 30 yrs out
Nearby sold comps map
Loading sold comps map…
Walkable amenities ~0.75 mi
Loading nearby amenities…
Taxation est. · year 1
- Rental income
- $20,976
- − Mortgage interest
- −$3,641
- − Property taxes
- −$139
- − Insurance
- −$325
- − Repairs & maintenance
- −$1,678
- − Management
- −$1,678
- − Depreciation
- −$1,891
- Taxable income
- $11,623
- Est. tax owed @ 24.0%
- −$2,790
- After-tax cash flow
- $9,226/yr
For passive investors: Depreciation is non-cash, so a rental often shows a tax loss while cash-flowing — sheltering income. Rental losses are passive: they offset passive income freely, and up to $25,000/yr can offset ordinary (W-2) income if you actively participate and your MAGI is under $100k (phasing out to $0 by $150k); unused losses carry forward. On sale, claimed depreciation is recaptured at up to 25%, and gains may owe capital-gains tax (a 1031 exchange can defer both). Figures are a year-1 estimate at your 24.0% rate — not tax advice; consult a CPA.
Schools (NCES district)
- District
- St. Louis City
- NCES district ID
- 2929280
- Math proficiency
- 10% ▼ -6.00%
- Reading proficiency
- 18% ▼ -3.00%
- Median HH income
- $35,685
- Composite
- 11.54/100
- National rank
- #9699
- State rank
- #312 of 324 in MO
Livability — St. Louis
No livability data for this city. (Only ~50 U.S. cities are tracked.)
Census & demographics
- Census place
- St. Louis, MO
- County
- Saint Louis City · 254,015 people
- City population
- 283,259
- Metro
- St. Louis, MO-IL
- Population (ZIP)
- 17,985
- Household income
- $45,542
- Rent vs Own
- Severe rent burden
- 1457.0
Population outlook (St. Louis County) Hauer SSP2
- Today (2025)
- 315,737 people
- By 2030
- 313,865 · -0.6%
- By 2040
- 305,439 · -3.3%
- By 2050
- 296,529 · -6.1%
- By 2075
- 271,028 · -14.2%
- By 2100
- 255,359 · -19.1%
Race, ethnicity, and origin ACS 2023
- Neighborhood character
- Majority Black (63%)
- Race & ethnicity
- Black 63% White 24% Asian 6% Two or more races 5% Hispanic / Latino 4%
- Common ancestry
- Lithuanian 1% Scotch-Irish 1% Romanian 1%
- Foreign-born
- 9% · China, South Korea, Canada
- Languages at home
- 88% English-only · Spanish 3% Chinese 2% Korean 2%
Political lean MEDSL · St. Louis
- 2024 margin
- Solid D (+64.7) · D 81.4% · R 16.7% · Other 2.0%
- 2008→2024 swing
- -3.5pp toward R · 2008: 68.2pp · 2024: 64.7pp
- All cycles
- 2024: D+64.7 2020: D+66.2 2016: D+63.7 2012: D+66.6 2008: D+68.2
Not yet ingested
- Civics
- —
Market trends
- HPI YoY
- ▼ -158.94%
- Current HPI
- 115.1863
- Rent YoY
- ▲ 2.39%
- Metro
- St. Louis, MO-IL
- State GDP YoY
- ▲ 1.84%
- F500 in state
- 20
Industry mix (Fortune 500 HQ in MO)
| Industry | F500 HQs | Revenue |
|---|---|---|
| Healthcare | 1 | $163B |
|
||
| Insurance | 1 | $21B |
|
||
| Industrial Technology | 1 | $17B |
|
||
| Retail | 1 | $16B |
|
||
| Industrial Distribution | 1 | $10B |
|
||
| Utilities | 1 | $9B |
|
||
Price history
+76.6% since first listed5 events — show timeline
- 2026-05-01 Listed $65,000 MARIS as Distributed by MLS Grid
- 2022-06-16 Sold (Public Records) $2,000 Public Records
- 2012-06-22 Sold (MLS) — MARIS as Distributed by MLS Grid
- 2012-05-08 Listed $1,600 MARIS as Distributed by MLS Grid
- 2002-09-11 Sold (Public Records) $36,800 Public Records
Property tax history
-1.3%/yrLatest (2024): $139 · +4.1% YoY. Source: county tax records.
Cash-flow waterfall
monthlySold comps — $/sqft
last 12 mo · ≤1 miLoading sold comps…