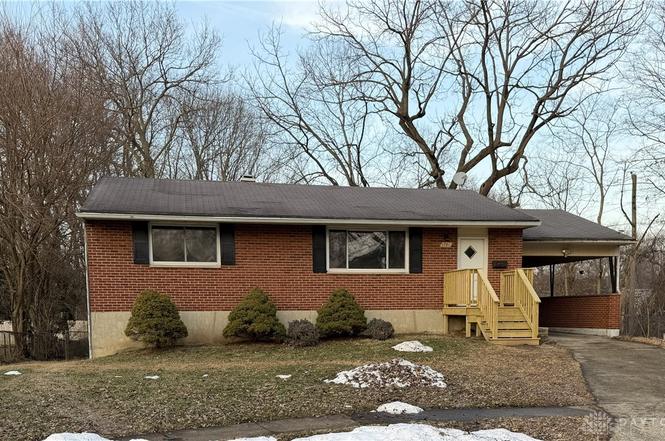
1781 Eric Dr · Dayton, OH
Flood risk 5/10 · Moderate
- FEMA flood zone
- X (unshaded)
- Chance of flooding over 30 yrs
- 0.67%
- Est. flood insurance / yr
- $473 – $860
Fire risk 1/10 · Minimal
- Est. fire insurance / yr
- $713 – $1,323
Heat risk 3/10 · Minor
- Hot days now (above 104°F)
- 7 days/yr
- Hot days in 30 yrs
- 18 days/yr
Wind risk 2/10 · Minimal
- Chance of severe wind over 30 yrs
- —
Air-quality risk 3/10 · Minor
- Unhealthy air days now
- 2 days/yr
- Unhealthy air days in 30 yrs
- 4 days/yr
Risk factors via First Street. Map © Google.
Why this score? — see what drove the C+ grade
The composite is a weighted blend of 9 inputs, each scored 0–100. Each bar is that input's sub-score; the figure is the points it added to the 100-point composite (weight × sub-score).
- Cash flow +19.3/30.0
- ARV discount +14.9/15.0
- DSCR +6.1/10.0
- 1% rule +5.7/10.0
- Schools +5.0/10.0
- Rent growth +4.4/5.0
- Livability +3.2/5.0
- Condition / age +2.5/5.0
- Appreciation +0.0/10.0
$115,000
🖨 Deal sheet 📄 Offer letter ✓ Due diligence
Listing remarks
This classic 3 bedroom brick ranch in Dayton offers plenty of space and loads of potential opportunity. 3 bedrooms, large living room and galley kitchen with breakfast nook. 1 full bath. Full semi-finished basement. Carport. Durable brick exterior. Property needs updating and is being sold as is. Whether you are investing or ready to make it your own, this property is priced right for improvements and increasing equity!
Key facts
- 0.24 acre lot
- Parking
- Built 1956
Property features AI
Finance
- Financial info: Offered for sale
Exterior
- Parking: Carport
- Utilities: Public water; Sewer available
- Home design: Ranch-style single-story home
- Construction: Brick and wood siding construction
- Exterior features: Deck; Patio; Partial fencing
Interior
- Kitchen: Dishwasher; Range; Galley layout
- Bedrooms: Main level bedroom (12 x 10); Main level bedroom (13 x 9); Main level bedroom (13 x 9)
- Bathrooms: One full bathroom (main level)
- Heating & cooling: Natural gas heating; Central air conditioning
- Interior features: Galley kitchen; Aluminum frame and vinyl windows; Partially finished full basement
- Laundry & utility: Gas water heater
Neighborhood map
What this means for you Summary
Snapshot
- This is a 3-bed/1.0-bath single-family listed at $115k.
Deal economics
- At list price, monthly cash flow is $126 ($2k/yr) — positive.
- The deal already cash-flows at list — no discount required.
- Meets the 1% rule at list price ($1k rent vs $115k).
- Recommended offer: $112k (3.0% below list) — sets the bar for market timing.
Location & tenants
- Location reads 65/100 on livability (#716 in OH) — a middle-class / working-renter tenant base. Strengths: cost of living A+, housing A+, health & safety A; Watch: schools C-, amenities C-, crime F.
- Market conditions: Rents rising fast (+7.4%/yr); 51 active listings in the ZIP; 20 comparable units currently listed for rent nearby; rentals leasing fast (median 11d on market — plan ~1-2 weeks tenant-placement turnaround); 907 units permitted in Montgomery County in 2024 (416 in 5+ unit buildings).
Forward outlook
- Local home prices are declining (-3.0%/yr); year-one equity from $795 of loan paydown is wiped out by about $3k of value loss. Plan a longer hold.
- Montgomery County population projected at -10% by 2050 — secular population decline; favor cash flow + early exit over multi-decade hold.
- At projected returns (-3.0% appreciation + 7.4% rent growth), your $32k cash investment doubles in ~10 years — after that, you're playing with house money.
Negotiation context
- It's been on market 43 days — a 3% lower offer ($112k) is reasonable based on typical stale-listing flexibility.
- 3 sale attempts with the ask held roughly flat each time — persistent listings suggest the price (not the market) is what's stuck; bring a comps-based counter.
- Current owner paid $10k; list at $115k implies a 1079% gain — meaningful room to come down on a strong offer.
Risks & watch-outs
- Watch-outs: built in 1956 — expect roof / HVAC / electrical / plumbing capex.
- Climate carrying-cost: moderate flood risk — expect insurance premiums to compound above CPI over the hold.
Questions for the listing agent
- It's been on market 43 days. Have you received any prior offers? Is the seller open to a 3% concession, seller financing, or rate buy-down credit?
- Built in 1956 — when were the roof, HVAC, electrical panel, plumbing, and water heater last replaced?
- Is there a deadline driving the sale (1031 exchange, divorce, estate, relocation)? That informs how much negotiation room exists.
- Crime grade is F in this area — have there been break-ins, vandalism, or insurance claims at this property in the last 3 years? What carrier currently insures it and at what premium?
- What's the average days-on-market for RENTAL listings here right now (not sales)? A rising rental-DOM trend means longer vacancies and softer asking-rent achievability than the comps imply.
- What's the recent tenant-quality profile in this submarket — average credit score on applications, eviction rate, late-payment / NSF rate, and stable-employment percentage? A property-management company in the area should have these aggregated.
- How much new for-sale + rental construction is in the pipeline within 1–3 miles? Heavy new supply typically softens prices + rents 12–24 months out; constrained supply supports both.
Investment metrics
- 1% rule
- 1.07% ✓
- Cap rate
- 7.61%
- Cash-on-cash
- 4.70%
- DSCR
- 1.21
- GRM
- 7.8
CMA / ARV
- ARV (on-the-fly)
- $137,800
- Comps found
- 12
Show comp detail 12 sales within ~0.75 mi
| Address | Dist | Beds/Ba | Sqft | Sold | Price | $/sf | Match |
|---|---|---|---|---|---|---|---|
| 1781 Eric Dr | 0.00mi | 3/1.0 | 1,060 (0%) | 1mo | $105,000 | $99 | 99 |
| 1742 Eric Dr | 0.06mi | 3/2.0 | 1,060 (0%) | 6mo | $189,900 | $179 | 88 |
| 1725 Eric Dr | 0.09mi | 3/1.0 | 1,060 (0%) | 22mo | $125,000 | $118 | 78 |
| 2203 Rector Ave | 0.42mi | 3/1.0 | 1,008 (-5%) | 4mo | $152,000 | $151 | 69 |
| 2108 Gipsy Dr | 0.69mi | 3/1.0 | 1,053 (-1%) | 4mo | $54,670 | $52 | 63 |
| 2203 Cardinal Ave | 0.72mi | 3/1.5 | 1,064 (+0%) | 6mo | $152,000 | $143 | 59 |
| 2021 Ottello Ave | 0.46mi | 2/2.0 (-1) | 1,084 (+2%) | 10mo | $157,500 | $145 | 58 |
| 2127 Marker Ave | 0.46mi | 2/1.0 (-1) | 989 (-7%) | 7mo | $100,000 | $101 | 57 |
| 2213 Titus Ave | 0.47mi | 3/1.5 | 1,080 (+2%) | 23mo | $130,000 | $120 | 54 |
| 2006 High Knoll Dr | 0.59mi | 3/2.0 | 1,160 (+9%) | 3mo | $191,000 | $165 | 51 |
| 2138 Claggett Dr | 0.38mi | 2/1.0 (-1) | 976 (-8%) | 17mo | $110,000 | $113 | 50 |
| 2114 Sherer Ave | 0.71mi | 2/1.0 (-1) | 978 (-8%) | 14mo | $127,200 | $130 | 38 |
Match score weights: distance 35% · size 25% · config 20% · recency 20%. Top-matched comps best support the ARV.
Projected returns pro-forma
-3.0% appreciation · 7.41% rent growth · sell at horizon
- IRR
- -3.8%
- Equity multiple
- 0.85×
- Total profit
- $-4,830
- Equity at exit
- $17,147
- IRR
- 10.5%
- Equity multiple
- 2.00×
- Total profit
- $32,076
- Equity at exit
- $9,943
Cash invested: $32,200 (down + closing). Projections, not guarantees.
Landlord ↔ Tenant lean methodology
- Overall (STATE)
- 73 Landlord-Friendly
- State Ohio
- 73 Landlord-Friendly · R+6
- County
- — inherits STATE
- City
- — inherits STATE
ZIP-level market 45414
- Rents YoY
- 7.4%
- Active inventory
- 51
- Price-to-rent
- 7.8×
Monthly cashflow live
- Estimated rent
- $1,235 high interval (Pro) →
- Mortgage (P&I)
- −$603
- Tax from tax record
- −$199 /mo · $2,386/yr
- Insurance
- −$48
- HOA
- −$0
- Vacancy / Maint / Mgmt
- −$259
- Net cashflow
- $126
Break-even live
UW: 25.0% down · 7.5% · 30yr · 1.5% tax · 5.0% vac · 8.0% maint · 8.0% mgmt
Financing live
Cash to close
- Down payment
- $28,750
- Closing costs
- $3,450
- Reserves months
- —
- Total cash needed
- —
Loan-product check · same deal, 3 products live
Conventional
25% down · 7.5% · 30yr
- Down + closing
- —
- Monthly P&I
- —
- Monthly cashflow
- —
- DSCR
- —
- Eligible?
- —
Personal DTI + credit; lowest rate.
DSCR
20% down · 8.5% · 30yr
- Down + closing
- —
- Monthly P&I
- —
- Monthly cashflow
- —
- DSCR
- —
- Eligible?
- —
No personal income docs; deal must DSCR.
Hard money
10% down · 12.0% · 12mo
- Down + closing
- —
- Monthly P&I
- —
- Monthly cashflow
- —
- DSCR
- —
- Eligible?
- —
Short-term bridge; refi at stabilization.
Rent comps 20 comps
| Address | Beds | Baths | Sqft | Rent | $/sqft | DOM | Units | Dist |
|---|---|---|---|---|---|---|---|---|
| 4911 Northcutt Pl Dayton, OH | 2.0 | 1.0 | 850 | $825 | $0.97 | 2d | 1 | 0.17mi |
| 4339 Riverside Dr Dayton, OH | 1.0–3.0 | 1.0–2.0 | 936 | $1,399 | $1.49 | 2d | 12 | 0.81mi |
| 2322 Koehler Ave Dayton, OH | 4.0 | 1.0 | 1155 | $1,350 | $1.17 | 2d | 1 | 0.86mi |
| 1108 Rydale Rd Dayton, OH | 3.0 | 1.0 | 1281 | $1,245 | $0.97 | 18d | 1 | 0.91mi |
| 57 Walbrook Ave Dayton, OH | 2.0 | 1.0 | 861 | $975 | $1.13 | 3d | 1 | 0.94mi |
| 2109 Harding Ave Dayton, OH | 2.0 | 1.0 | 750 | $950 | $1.27 | 2d | 1 | 1.06mi |
| 2022 Arthur Ave Unit NA Dayton, OH | 3.0 | 1.0 | 1040 | $1,500 | $1.44 | 11d | 1 | 1.07mi |
| 240 Castlewood Ave Dayton, OH | 2.0 | 1.0 | 912 | $995 | $1.09 | 21d | 1 | 1.16mi |
| 419 Sandhurst Dr Dayton, OH | 2.0 | 1.0 | 950 | $975 | $1.03 | 23d | 1 | 1.26mi |
| 5900 Erica Ct Dayton, OH | 2.0 | 1.0 | 800 | $975 | $1.22 | 2d | 1 | 1.29mi |
| 2611 Onaoto Ave Dayton, OH | 3.0 | 1.0 | 1025 | $1,195 | $1.17 | 11d | 1 | 1.29mi |
| 244 E Siebenthaler Ave Dayton, OH | 2.0 | 1.5 | 1273 | $1,175 | $0.92 | 2d | 1 | 1.40mi |
| 228 E Siebenthaler Ave Dayton, OH | 2.0 | 1.0 | 934 | $1,200 | $1.28 | 43d | 1 | 1.42mi |
| 62 W Nottingham Rd Dayton, OH | 2.0 | 1.0 | 765 | $750 | $0.98 | 23d | 1 | 1.43mi |
| 337 Ryburn Ave Unit 2 Dayton, OH | 2.0 | 1.0 | 900 | $800 | $0.89 | 43d | 1 | 1.44mi |
| 4278 Catalpa Dr Unit 4 Dayton, OH | 2.0 | 1.0 | 800 | $795 | $0.99 | 43d | 1 | 1.49mi |
| 69 Waverly Ave Dayton, OH | 2.0 | 1.0 | 900 | $850 | $0.94 | 3d | 1 | 1.49mi |
| 110 Cromwell Pl Dayton, OH | 2.0 | 1.0 | 1050 | $1,100 | $1.05 | 2d | 1 | 1.50mi |
| 110 Cromwell Pl Unit 5 Dayton, OH | 2.0 | 1.0 | 1000 | $1,099 | $1.10 | 18d | 1 | 1.50mi |
| 110 Cromwell Pl Unit 2 Dayton, OH | 2.0 | 1.0 | 1000 | $995 | $0.99 | 21d | 1 | 1.50mi |
Listing history 8 events
-
2026-05-09status Pending
-
2026-05-08status Active
-
2026-04-25historical ActiveUnderContract
-
2026-04-23status Active
-
2026-03-21historical
-
2026-02-24historical ActiveUnderContract
-
2026-02-22$115,000 Active
-
1981-07-08soldstatus $9,750
ⓘ Source: listings_history table (triggers on properties + properties_extension) + one-shot
backfill from property_details.listing_events for pre-trigger history.
Tax reassessment forecast OH · Partial reset (capped growth)
- Current annual tax
- $2,386 · $199/mo
- Projected year-2 tax
- $2,386 · $199/mo
- Expected delta
- $0/yr ($0/mo · 0.0%)
ⓘ Screening estimate from a state-policy table — verify with the county assessor before closing.
Climate risk First Street
- Flood 5/10 Major FEMA zone X (unshaded) · 67% chance over 30 yrs
- Wildfire 1/10 Low
- Heat 3/10 Moderate 7 d/yr ≥104°F today · 18 d/yr by 30 yrs out
- Wind 2/10 Low
- Air quality 3/10 Moderate 2 unhealthy d/yr today · 4 by 30 yrs out
Nearby sold comps map
Loading sold comps map…
Walkable amenities ~0.75 mi
Loading nearby amenities…
Taxation est. · year 1
- Rental income
- $14,823
- − Mortgage interest
- −$6,442
- − Property taxes
- −$2,386
- − Insurance
- −$575
- − Repairs & maintenance
- −$1,186
- − Management
- −$1,186
- − Depreciation
- −$3,345
- Taxable loss
- −$297
- Est. tax savings @ 24.0%
- +$71
- After-tax cash flow
- $1,584/yr
For passive investors: Depreciation is non-cash, so a rental often shows a tax loss while cash-flowing — sheltering income. Rental losses are passive: they offset passive income freely, and up to $25,000/yr can offset ordinary (W-2) income if you actively participate and your MAGI is under $100k (phasing out to $0 by $150k); unused losses carry forward. On sale, claimed depreciation is recaptured at up to 25%, and gains may owe capital-gains tax (a 1031 exchange can defer both). Figures are a year-1 estimate at your 24.0% rate — not tax advice; consult a CPA.
Schools (NCES district)
No district data.
Livability — Dayton
- Score
- 65/100
- State rank
- #716
- US rank
- #12895
Category grades
Schools grade is shown separately in the Schools card above.
Census & demographics
- Census place
- Dayton, OH
- County
- Montgomery County · 459,541 people
- City population
- 164,387
- Metro
- Dayton-Kettering, OH
- Population (ZIP)
- 21,167
- Household income
- $54,485
- Rent vs Own
- Severe rent burden
- 801.0
Population outlook (Montgomery County) Hauer SSP2
- Today (2025)
- 523,241 people
- By 2030
- 514,948 · -1.6%
- By 2040
- 493,378 · -5.7%
- By 2050
- 469,639 · -10.2%
- By 2075
- 418,360 · -20.0%
- By 2100
- 353,315 · -32.5%
Race, ethnicity, and origin ACS 2023
- Neighborhood character
- Predominantly White (75%)
- Race & ethnicity
- White 75% Black 15% Two or more races 6% Hispanic / Latino 4% Asian 1%
- Common ancestry
- Slovak 2% Romanian 2% Italian 2%
- Foreign-born
- 4% · Canada
- Languages at home
- 94% English-only · Spanish 2% Arabic 1% Tagalog/Filipino 1%
Political lean MEDSL · Montgomery
- 2024 margin
- Toss-up / Even · D 49.8% · R 49.3%
- 2008→2024 swing
- -5.8pp toward R · 2008: 6.2pp · 2024: 0.5pp
- All cycles
- 2024: D+0.5 2020: D+2.2 2016: R+1.2 2012: D+3.1 2008: D+6.2
Not yet ingested
- Civics
- —
Market trends
- HPI YoY
- ▼ -142.46%
- Current HPI
- 183.1124
- Rent YoY
- ▲ 7.41%
- Metro
- Dayton-Kettering, OH
- State GDP YoY
- ▲ 1.98%
- F500 in state
- 48
Industry mix (Fortune 500 HQ in OH)
| Industry | F500 HQs | Revenue |
|---|---|---|
| Insurance | 3 | $145B |
|
||
| Industrial Machinery | 3 | $49B |
|
||
| Financial Services | 3 | $24B |
|
||
| Consumer Goods | 2 | $93B |
|
||
| Aerospace / Defense | 2 | $47B |
|
||
| Utilities | 2 | $33B |
|
||
Price history
+1079.5% since first listed8 events — show timeline
- 2026-05-09 Pending — Dayton MLS
- 2026-05-08 Relisted — Dayton MLS
- 2026-04-25 Contingent — Dayton MLS
- 2026-04-23 Relisted — Dayton MLS
- 2026-03-21 Listing Removed — Dayton MLS
- 2026-02-24 Contingent — Dayton MLS
- 2026-02-22 Listed $115,000 Dayton MLS
- 1981-07-08 Sold (Public Records) $9,750 Public Records
Property tax history
+4.2%/yrLatest (2025): $2,386 · -3.3% YoY. Source: county tax records.
Cash-flow waterfall
monthlySold comps — $/sqft
last 12 mo · ≤1 miLoading sold comps…