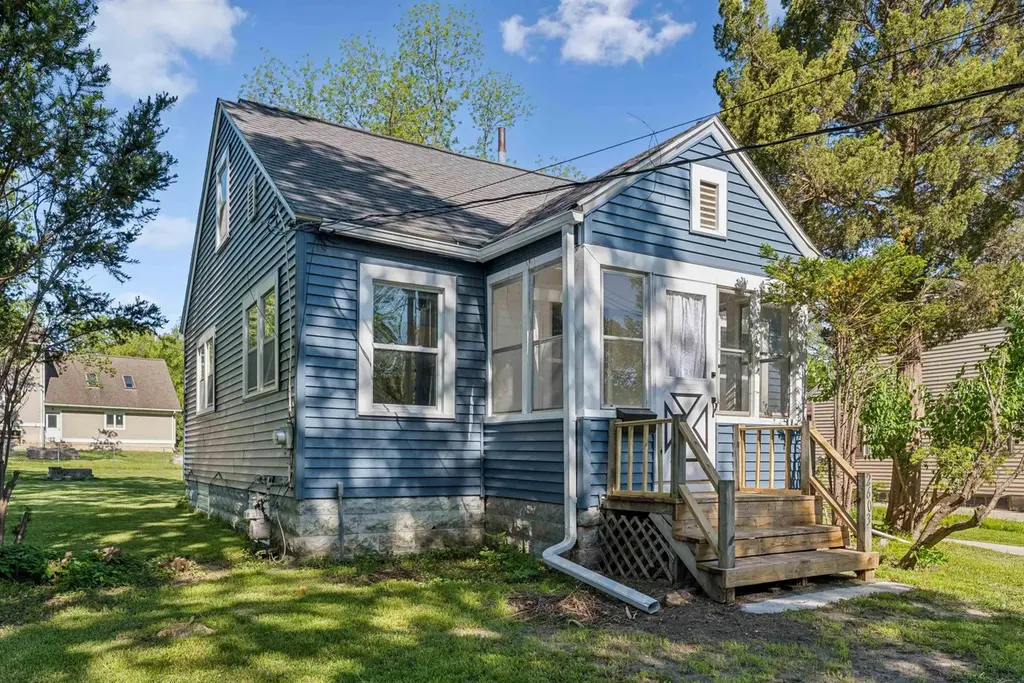
2603 Cedar Heights Dr · Cedar Falls, IA
Flood risk 1/10 · Minimal
- FEMA flood zone
- X (unshaded)
- Chance of flooding over 30 yrs
- 0.0%
- Est. flood insurance / yr
- $473 – $860
Fire risk 1/10 · Minimal
- Est. fire insurance / yr
- $902 – $1,676
Heat risk 3/10 · Minor
- Hot days now (above 101°F)
- 7 days/yr
- Hot days in 30 yrs
- 15 days/yr
Wind risk 2/10 · Minimal
- Chance of severe wind over 30 yrs
- —
Air-quality risk 1/10 · Minimal
- Unhealthy air days now
- 0 days/yr
- Unhealthy air days in 30 yrs
- 0 days/yr
Risk factors via First Street. Map © Google.
Why this score? — see what drove the C+ grade
The composite is a weighted blend of 9 inputs, each scored 0–100. Each bar is that input's sub-score; the figure is the points it added to the 100-point composite (weight × sub-score).
- Cash flow +23.9/30.0
- ARV discount +9.8/15.0
- DSCR +7.7/10.0
- Schools +6.6/10.0
- 1% rule +5.9/10.0
- Livability +4.0/5.0
- Rent growth +3.0/5.0
- Condition / age +2.5/5.0
- Appreciation +0.0/10.0
$159,900
🖨 Deal sheet (PDF) 📄 Offer letter ✓ Due diligence
Listing remarks
2603 Cedar Heights Drive is ready for its next chapter. Offering 4 bedrooms and 1 bathroom just over 1,000 square feet, this home proves that you don't have to sacrifice bedroom count for a manageable, easy-to-maintain footprint. The heavy lifting has already been done for you: enjoy total peace of mind with brand-new siding (2024) and a fully updated furnace and A/C system (2023). Combined with a clean, crisp driveway and excellent curb appeal, this property is truly turn-key. Whether you’re looking to stop paying rent and step into your very first home, or you're an investor seeking a lucrative, low-maintenance addition to your rental portfolio, this property is a standout choice. A
Key facts
- Turn-key
- Clean driveway
- Brand-new siding
Tags
Property features AI
Exterior
- Parking: Detached carport (1 space)
- Utilities: Public water; Public sewer
- Home design: Single-family residential property; Residential zoning (R-1)
- Construction: Vinyl siding; Asphalt shingle roof
- Exterior features: Concrete road surface
Interior
- Bathrooms: 1 full bathroom
- Heating & cooling: Forced air heating (natural gas); Central air conditioning
- Interior features: Basement (unfinished); No fireplace
Neighborhood map
What this means for you Summary
Snapshot
- This is a 4-bed/1.0-bath single-family listed at $160k.
Deal economics
- At list price, monthly cash flow is $309 ($4k/yr) — positive.
- The deal already cash-flows at list — no discount required.
- Meets the 1% rule at list price ($2k rent vs $160k).
- Cap rate 8.6% vs local median 3.1% in Cedar Falls — top-decile yield for the area; either an underpriced asset or a hidden risk that comps aren't pricing in. Stress-test before assuming the spread holds.
Location & tenants
- Location reads 81/100 on livability (#60 in IA, #1,357 nationally) — a professional / high-income tenant draw. Strengths: cost of living A+, housing A+, health & safety A+; Watch: amenities D, commute F.
- Cedar Falls Community School District (urban): math 76% / reading 79% proficiency, ranked #45 of 289 in IA (top 16%) — strong family-tenant draw, lease renewals of 3-5y typical; only 18% free/reduced lunch — higher-income household profile.
- Zoned schools: Cedar Heights Elementary School (math 70% / reading 74%, grade A-, #181 of 616 statewide, top 34%, 474 students, 40% FRL); Peet Junior High School (math 79% / reading 80%, grade A+, #35 of 246 statewide, top 16%, 670 students, 27% FRL); Cedar Falls High School (math 74% / reading 78%, grade A-, #75 of 336 statewide, top 23%, 1,302 students, 24% FRL).
- Market conditions: Rents rising (+2.0%/yr); 389 active listings in the ZIP; 1 comparable units currently listed for rent nearby; solid renter incomes; 287 units permitted in Black Hawk County in 2024 (67 in 5+ unit buildings).
Forward outlook
- Local home prices are declining (-3.0%/yr); year-one equity from $1k of loan paydown is wiped out by about $5k of value loss. Plan a longer hold.
- Black Hawk County population projected at +10% by 2050 — modest demand growth; plan on rents tracking national, not racing it.
Negotiation context
- Only 9 days on market — expect competitive offers; lowballing is unlikely to land.
Risks & watch-outs
- Watch-outs: built in 1934 — expect roof / HVAC / electrical / plumbing capex.
Questions for the listing agent
- Built in 1934 — when were the roof, HVAC, electrical panel, plumbing, and water heater last replaced?
- Is there a deadline driving the sale (1031 exchange, divorce, estate, relocation)? That informs how much negotiation room exists.
- Schools are A-rated — typically a magnet for longer-tenancy family renters. What's the average tenant stay here, and is there a school-zone premium baked into asking?
- What's the average days-on-market for RENTAL listings here right now (not sales)? A rising rental-DOM trend means longer vacancies and softer asking-rent achievability than the comps imply.
- What's the recent tenant-quality profile in this submarket — average credit score on applications, eviction rate, late-payment / NSF rate, and stable-employment percentage? A property-management company in the area should have these aggregated.
- How much new for-sale + rental construction is in the pipeline within 1–3 miles? Heavy new supply typically softens prices + rents 12–24 months out; constrained supply supports both.
Investment metrics
- 1% rule
- 1.09% ✓
- Cap rate
- 8.61%
- Cash-on-cash
- 8.29%
- DSCR
- 1.37
- GRM
- 7.7
CMA / ARV
- ARV (on-the-fly)
- $168,699
- Comps found
- 11
Show comp detail 11 sales within ~0.75 mi
| Address | Dist | Beds/Ba | Sqft | Sold | Price | $/sf | Match |
|---|---|---|---|---|---|---|---|
| 2602 Cedar Heights Drive Dr | 0.03mi | 3/1.0 (-1) | 1,004 (-5%) | 7mo | $165,000 | $164 | 79 |
| 2421 Garden Ave | 0.13mi | 3/1.0 (-1) | 1,040 (-2%) | 23mo | $212,500 | $204 | 66 |
| 2727 Cedar Heights Dr | 0.11mi | 3/1.0 (-1) | 1,184 (+12%) | 5mo | $108,000 | $91 | 66 |
| 2820 Willow Ln | 0.27mi | 3/1.0 (-1) | 1,092 (+3%) | 21mo | $191,000 | $175 | 60 |
| 2622 Garden Ave | 0.13mi | 3/1.0 (-1) | 912 (-14%) | 7mo | $132,600 | $145 | 60 |
| 1810 Edwards Ave | 0.52mi | 3/1.0 (-1) | 1,106 (+4%) | 10mo | $225,000 | $203 | 55 |
| 2625 Cedar Heights Dr Dr | 0.05mi | 3/2.0 (-1) | 1,180 (+11%) | 19mo | $168,000 | $142 | 54 |
| 2309 California St | 0.43mi | 3/1.0 (-1) | 1,200 (+13%) | 4mo | $140,000 | $117 | 49 |
| 2138 Rainbow Dr | 0.41mi | 3/1.0 (-1) | 1,183 (+12%) | 20mo | $168,800 | $143 | 40 |
| 1823 Rainbow Dr | 0.71mi | 3/2.0 (-1) | 1,198 (+13%) | 8mo | $190,000 | $159 | 30 |
| 2723 Acorn Ln | 0.75mi | 3/1.0 (-1) | 1,152 (+9%) | 20mo | $198,900 | $173 | 29 |
Match score weights: distance 35% · size 25% · config 20% · recency 20%. Top-matched comps best support the ARV.
Projected returns pro-forma
-3.0% appreciation · 1.97% rent growth · sell at horizon
- IRR
- -4.8%
- Equity multiple
- 0.82×
- Total profit
- $-7,989
- Equity at exit
- $23,842
- IRR
- 3.6%
- Equity multiple
- 1.25×
- Total profit
- $11,251
- Equity at exit
- $13,825
Cash invested: $44,772 (down + closing). Projections, not guarantees.
Landlord ↔ Tenant lean methodology
- Overall (STATE)
- 83 Strongly Landlord-Friendly
- State Iowa
- 83 Strongly Landlord-Friendly · R+6
- County
- — inherits STATE
- City
- — inherits STATE
ZIP-level market 50613
- Rents YoY
- 2.0%
- Active inventory
- 389
- Price-to-rent
- 7.7×
Monthly cashflow live
- Estimated rent
- $1,738 medium interval (Pro) →
- Mortgage (P&I)
- −$839
- Tax from tax record
- −$159 /mo · $1,906/yr
- Insurance
- −$67
- HOA
- −$0
- Vacancy / Maint / Mgmt
- −$365
- Net cashflow
- $309
Break-even live
Sensitivity live
| Price | -10% $400 | -5% $355 | +0% $309 | +5% $264 | +10% $219 |
|---|---|---|---|---|---|
| Rent | -10% $172 | -5% $241 | +0% $309 | +5% $378 | +10% $447 |
| Rate | -1.0pp $390 | -0.5pp $350 | base $309 | +0.5pp $268 | +1.0pp $226 |
UW: 25.0% down · 7.5% · 30yr · 1.5% tax · 5.0% vac · 8.0% maint · 8.0% mgmt
Financing live
Cash to close
- Down payment
- $39,975
- Closing costs
- $4,797
- Reserves months
- —
- Total cash needed
- —
Loan-product check · same deal, 3 products live
Conventional
25% down · 7.5% · 30yr
- Down + closing
- —
- Monthly P&I
- —
- Monthly cashflow
- —
- DSCR
- —
- Eligible?
- —
Personal DTI + credit; lowest rate.
DSCR
20% down · 8.5% · 30yr
- Down + closing
- —
- Monthly P&I
- —
- Monthly cashflow
- —
- DSCR
- —
- Eligible?
- —
No personal income docs; deal must DSCR.
Hard money
10% down · 12.0% · 12mo
- Down + closing
- —
- Monthly P&I
- —
- Monthly cashflow
- —
- DSCR
- —
- Eligible?
- —
Short-term bridge; refi at stabilization.
Rent comps 1 comps
| Address | Beds | Baths | Sqft | Rent | $/sqft | DOM | Units | Dist |
|---|---|---|---|---|---|---|---|---|
| 2110 Melrose Ct Cedar Falls, IA | 4.0 | 2.0 | 1100 | $1,250 | $1.14 | 23d | 1 | 1.41mi |
Listing history 1 events
-
2026-05-18$159,900 Active
ⓘ Source: listings_history table (triggers on properties + properties_extension) + one-shot
backfill from property_details.listing_events for pre-trigger history.
Tax reassessment forecast IA · Partial reset (capped growth)
- Current annual tax
- $1,906 · $159/mo
- Projected year-2 tax
- $2,208 · $184/mo
- Expected delta
- +$302/yr (+$25/mo · 15.9%)
ⓘ Screening estimate from a state-policy table — verify with the county assessor before closing.
Climate risk First Street
- Flood 1/10 Low FEMA zone X (unshaded) · 0% chance over 30 yrs
- Wildfire 1/10 Low
- Heat 3/10 Moderate 7 d/yr ≥101°F today · 15 d/yr by 30 yrs out
- Wind 2/10 Low
- Air quality 1/10 Low 0 unhealthy d/yr today · 0 by 30 yrs out
Nearby sold comps map
Loading sold comps map…
Walkable amenities ~0.75 mi
Loading nearby amenities…
Taxation est. · year 1
- Rental income
- $20,861
- − Mortgage interest
- −$8,957
- − Property taxes
- −$1,906
- − Insurance
- −$800
- − Repairs & maintenance
- −$1,669
- − Management
- −$1,669
- − Depreciation
- −$4,652
- Taxable income
- $1,209
- Est. tax owed @ 24.0%
- −$290
- After-tax cash flow
- $3,422/yr
For passive investors: Depreciation is non-cash, so a rental often shows a tax loss while cash-flowing — sheltering income. Rental losses are passive: they offset passive income freely, and up to $25,000/yr can offset ordinary (W-2) income if you actively participate and your MAGI is under $100k (phasing out to $0 by $150k); unused losses carry forward. On sale, claimed depreciation is recaptured at up to 25%, and gains may owe capital-gains tax (a 1031 exchange can defer both). Figures are a year-1 estimate at your 24.0% rate — not tax advice; consult a CPA.
Schools (NCES district)
- District
- Cedar Falls Community School District
- NCES district ID
- 1906510
- Math proficiency
- 76% ▼ -6.00%
- Reading proficiency
- 79% ▼ -2.00%
- Median HH income
- $53,634
- Composite
- 65.93/100
- National rank
- #443
- State rank
- #45 of 289 in IA
Livability — Cedar Falls
- Score
- 81/100
- State rank
- #60
- US rank
- #1357
Category grades
Schools grade is shown separately in the Schools card above.
Census & demographics
- Census place
- Cedar Falls, IA
- County
- Black Hawk County · 112,933 people
- City population
- 43,867
- Metro
- Waterloo-Cedar Falls, IA
- Population (ZIP)
- 43,867
- Household income
- $78,503
- Rent vs Own
- Severe rent burden
- 1514.0
Population outlook (Black Hawk County) Hauer SSP2
- Today (2025)
- 139,716 people
- By 2030
- 142,853 · +2.2%
- By 2040
- 147,843 · +5.8%
- By 2050
- 153,247 · +9.7%
- By 2075
- 167,977 · +20.2%
- By 2100
- 177,320 · +26.9%
Race, ethnicity, and origin ACS 2023
- Neighborhood character
- Predominantly White (90%)
- Race & ethnicity
- White 90% Asian 3% Two or more races 3% Hispanic / Latino 3% Black 1%
- Common ancestry
- Portuguese 6% Italian 3% Iranian 3%
- Foreign-born
- 4% · Canada, South Korea
- Languages at home
- 95% English-only · Spanish 2% Russian/Polish/Slavic 1% Other Indo-European 1%
Political lean MEDSL · Black Hawk
- 2024 margin
- Toss-up / Even · D 50.0% · R 48.8% · Other 1.2%
- 2008→2024 swing
- -21.3pp toward R · 2008: 22.4pp · 2024: 1.2pp
- All cycles
- 2024: D+1.2 2020: D+9.0 2016: D+7.3 2012: D+20.0 2008: D+22.4
Not yet ingested
- Civics
- —
Market trends
- HPI YoY
- ▼ -175.51%
- Current HPI
- 169.0591
- Rent YoY
- ▲ 1.97%
- Metro
- Waterloo-Cedar Falls, IA
- State GDP YoY
- ▲ 2.48%
- F500 in state
- 4
Industry mix (Fortune 500 HQ in IA)
| Industry | F500 HQs | Revenue |
|---|---|---|
| Financial Services | 1 | $16B |
|
||
| Retail / Convenience | 1 | $15B |
|
||
Price history
2 events — show timeline
- 2026-05-27 Pending — NEIRBR as distributed by MLS GRID
- 2026-05-18 Listed $159,900 NEIRBR as distributed by MLS GRID
Property tax history
+2.7%/yrLatest (2025): $1,906 · +2.9% YoY. Source: county tax records.
Cash-flow waterfall
monthlySold comps — $/sqft
last 12 mo · ≤1 miLoading sold comps…