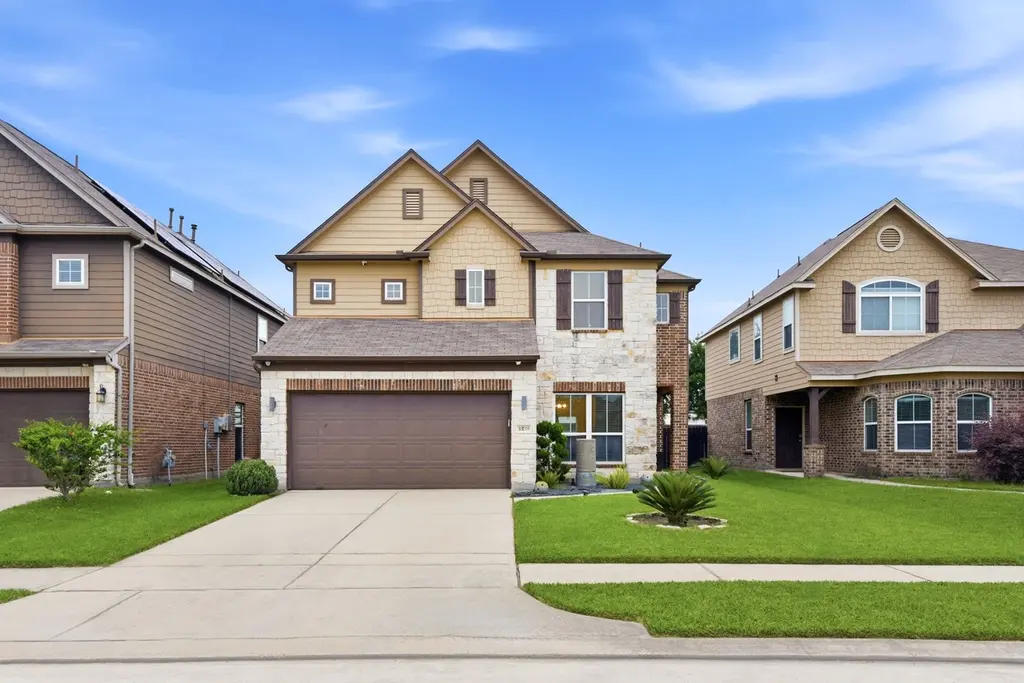
12219 Urban Trees Way · Atascocita, TX
Flood risk 1/10 · Minimal
- FEMA flood zone
- X (unshaded)
- Chance of flooding over 30 yrs
- 0.0%
- Est. flood insurance / yr
- $507 – $1,088
Fire risk 3/10 · Minor
- Est. fire insurance / yr
- $1,222 – $2,270
Heat risk 9/10 · Severe
- Hot days now (above 110°F)
- 7 days/yr
- Hot days in 30 yrs
- 24 days/yr
Wind risk 9/10 · Severe
- Chance of severe wind over 30 yrs
- 99.0%
Air-quality risk 3/10 · Minor
- Unhealthy air days now
- 3 days/yr
- Unhealthy air days in 30 yrs
- 3 days/yr
Risk factors via First Street. Map © Google.
Why this score? — see what drove the D- grade
The composite is a weighted blend of 9 inputs, each scored 0–100. Each bar is that input's sub-score; the figure is the points it added to the 100-point composite (weight × sub-score).
- Cash flow +9.1/30.0
- ARV discount +5.7/15.0
- Appreciation +4.5/10.0
- Schools +3.9/10.0
- 1% rule +3.6/10.0
- Livability +3.5/5.0
- DSCR +2.5/10.0
- Rent growth +2.5/5.0
- Condition / age +2.5/5.0
$320,000
🖨 Deal sheet (PDF) 📄 Offer letter ✓ Due diligence
Listing remarks
Welcome HOME, a warm and inviting 5 bedroom, 3 bathroom with a big game room, a formal dining, a breakfast area and a beautiful yard. Upgraded ceramic tile enhances the downstairs with granite countertops in the kitchen and stylish backsplash. This HOME is perfect for YOU so schedule your showing NOW!
Key facts
- 5,087 sq ft lot
- 2 garage spots
- Built 2015
Property features AI
Finance
- Other: Lease not considered
- HOA & community: Community managed by Crest Management Company; Annual association fee of $400
Exterior
- Parking: Attached garage with 2 spaces
- Utilities: Public sewer
- Home design: Residential property; Built in 2015; Slab foundation; Composition roof
- Construction: Brick, cement siding, and stone exterior
- Exterior features: Located in a subdivision
Interior
- Kitchen: Dishwasher; Electric range; Gas oven; Microwave; Disposal
- Bedrooms: Primary bedroom on second level (15 x 13); Bedroom on first level (11 x 11); Bedroom on second level (11 x 11); Bedroom on second level (12 x 10); Bedroom on second level (10 x 8)
- Bathrooms: 3 full bathrooms; Double vanity(s)
- Heating & cooling: Central heating (gas); Central air (electric)
- Interior features: Double vanity; Granite counters; Kitchen and family room combined layout; Pantry
- Laundry & utility: Washer hookup; Gas dryer hookup
Neighborhood map
What this means for you Summary
Snapshot
- This is a 5-bed/2.5-bath single-family listed at $320k.
Deal economics
- At list price, monthly cash flow is $-248 ($-3k/yr) — negative.
- To cash-flow at today's rent, offer at most $276k (13.7% below list).
- To meet the 1% rule (rent ≥ 1% of price), the offer needs to be $276k (13.8% below list).
- Recommended offer: $276k (13.8% below list) — sets the bar for 1% rule.
- Cap rate 5.4% vs local median 4.0% in Atascocita — top-decile yield for the area; either an underpriced asset or a hidden risk that comps aren't pricing in. Stress-test before assuming the spread holds.
Location & tenants
- Location reads 70/100 on livability (#346 in TX) — a middle-class / working-renter tenant base. Strengths: employment A+, cost of living A+, housing A+; Watch: amenities F, commute F, health & safety F.
- Humble ISD (urban): math 38% / reading 44% proficiency, ranked #262 of 826 in TX (top 32%) — families likely to look elsewhere, expect single-tenant / working-renter base with shorter leases.
- Zoned schools: Atascocita Springs El (math 44% / reading 51%, grade D, #989 of 4,322 statewide, top 23%, 989 students, 37% FRL); Timberwood Middle (math 31% / reading 46%, grade F, #704 of 1,662 statewide, top 43%, 1,094 students, 54% FRL); Atascocita H S (math 41% / reading 52%, grade D-, #621 of 1,632 statewide, top 38%, 3,829 students, 42% FRL).
- Market conditions: Rents flat; 682 active listings in the ZIP; 12 comparable units currently listed for rent nearby; rentals at typical pace (median 26d on market — plan ~3-4 weeks tenant-placement turnaround); high-income renter base; 29,883 units permitted in Harris County in 2024 (8,621 in 5+ unit buildings).
Forward outlook
- Local home prices are declining (-0.9%/yr); year-one equity from $2k of loan paydown is wiped out by about $3k of value loss. Plan a longer hold.
- Harris County population projected at +47% by 2050 — long-run rental-demand tailwind backs the buy-and-hold thesis.
Negotiation context
- It's been on market 51 days — a 3% lower offer ($310k) is reasonable based on typical stale-listing flexibility.
Risks & watch-outs
- Climate carrying-cost: severe wind risk, 99% chance of damaging wind over 30y; extreme-heat days projected 7→24/yr by 2055 (HVAC capex compounding) — expect insurance premiums to compound above CPI over the hold.
Questions for the listing agent
- What do current leases actually rent for vs. the listed asking? Can we see a recent rent roll and the last 12 months of T-12 income?
- It's been on market 51 days. Have you received any prior offers? Is the seller open to a 14% concession, seller financing, or rate buy-down credit?
- What does the HOA fee cover, when was the last increase, and are there any pending special assessments or reserve-fund shortfalls?
- Is there a deadline driving the sale (1031 exchange, divorce, estate, relocation)? That informs how much negotiation room exists.
- The area grade is low — what's the realistic commute time and amenity access for the typical tenant pool here? Any planned neighborhood developments (good or bad) we should know about?
- What's the average days-on-market for RENTAL listings here right now (not sales)? A rising rental-DOM trend means longer vacancies and softer asking-rent achievability than the comps imply.
- What's the recent tenant-quality profile in this submarket — average credit score on applications, eviction rate, late-payment / NSF rate, and stable-employment percentage? A property-management company in the area should have these aggregated.
- How much new for-sale + rental construction is in the pipeline within 1–3 miles? Heavy new supply typically softens prices + rents 12–24 months out; constrained supply supports both.
Investment metrics
- 1% rule
- 0.86% ✗
- Cap rate
- 5.36%
- Cash-on-cash
- -3.32%
- DSCR
- 0.85
- GRM
- 9.7
CMA / ARV
- ARV (median comp)
- $307,748
- List price
- $320,000
- Delta
- 3.98%
- Verdict
- FAIR
- Comps
- 20 within 1.0 mi
Show comp detail 12 sales within ~0.75 mi
| Address | Dist | Beds/Ba | Sqft | Sold | Price | $/sf | Match |
|---|---|---|---|---|---|---|---|
| 18042 Noble Forest Dr | 0.17mi | 5/2.5 | 2,639 (-2%) | 4mo | $264,000 | $100 | 85 |
| 5055 Blue Spruce Hill St | 0.15mi | 6/2.5 (+1) | 2,660 (-1%) | 2mo | $283,000 | $106 | 84 |
| 5022 Drew Forest Ln | 0.31mi | 5/2.5 | 2,667 (-1%) | 3mo | $275,000 | $103 | 81 |
| 4939 Falcon Forest Dr | 0.23mi | 4/2.5 (-1) | 2,639 (-2%) | 3mo | $210,000 | $80 | 78 |
| 17702 Trail Mountain Ct | 0.44mi | 4/2.5 (-1) | 2,729 (+1%) | 1mo | $385,000 | $141 | 72 |
| 12223 English Brook Cir | 0.26mi | 4/2.5 (-1) | 2,397 (-11%) | 1mo | $239,500 | $100 | 64 |
| 12115 Pinelands Park Ln | 0.56mi | 4/2.5 (-1) | 2,772 (+3%) | 2mo | $450,000 | $162 | 62 |
| 12419 Adams Ridge Ln | 0.31mi | 4/2.0 (-1) | 2,437 (-10%) | 1mo | $320,000 | $131 | 62 |
| 17619 Sequoia View Ln | 0.66mi | 4/2.0 (-1) | 2,700 (+0%) | 4mo | $229,900 | $85 | 58 |
| 17914 June Forest Dr | 0.52mi | 4/2.5 (-1) | 2,384 (-12%) | 1mo | $289,500 | $121 | 50 |
| 12630 Blackstone River Dr | 0.60mi | 4/2.5 (-1) | 2,965 (+10%) | 1mo | $414,000 | $140 | 50 |
| 4954 Winding Timbers Cir | 0.45mi | 4/2.0 (-1) | 2,319 (-14%) | 0mo | $277,600 | $120 | 49 |
Match score weights: distance 35% · size 25% · config 20% · recency 20%. Top-matched comps best support the ARV.
Projected returns pro-forma
-0.95% appreciation · 0.09% rent growth · sell at horizon
- IRR
- -12.4%
- Equity multiple
- 0.48×
- Total profit
- $-46,894
- Equity at exit
- $77,949
- IRR
- -8.6%
- Equity multiple
- 0.28×
- Total profit
- $-64,087
- Equity at exit
- $82,454
Cash invested: $89,600 (down + closing). Projections, not guarantees.
Landlord ↔ Tenant lean methodology
- Overall (STATE)
- 87 Strongly Landlord-Friendly
- State Texas
- 87 Strongly Landlord-Friendly · R+5
- County
- — inherits STATE
- City
- — inherits STATE
ZIP-level market 77346
- Home prices YoY
- -0.4%
- Rents YoY
- 0.1%
- Active inventory
- 682
- Price-to-rent
- 9.7×
Monthly cashflow live
- Estimated rent
- $2,758 high interval (Pro) →
- Mortgage (P&I)
- −$1,678
- Tax from tax record
- −$582 /mo · $6,984/yr
- Insurance
- −$133
- HOA
- −$33
- Vacancy / Maint / Mgmt
- −$579
- Net cashflow
- $-248
Break-even live
Sensitivity live
| Price | -10% $-67 | -5% $-157 | +0% $-248 | +5% $-338 | +10% $-429 |
|---|---|---|---|---|---|
| Rent | -10% $-466 | -5% $-357 | +0% $-248 | +5% $-139 | +10% $-30 |
| Rate | -1.0pp $-87 | -0.5pp $-167 | base $-248 | +0.5pp $-331 | +1.0pp $-415 |
UW: 25.0% down · 7.5% · 30yr · 1.5% tax · 5.0% vac · 8.0% maint · 8.0% mgmt
Financing live
Cash to close
- Down payment
- $80,000
- Closing costs
- $9,600
- Reserves months
- —
- Total cash needed
- —
Loan-product check · same deal, 3 products live
Conventional
25% down · 7.5% · 30yr
- Down + closing
- —
- Monthly P&I
- —
- Monthly cashflow
- —
- DSCR
- —
- Eligible?
- —
Personal DTI + credit; lowest rate.
DSCR
20% down · 8.5% · 30yr
- Down + closing
- —
- Monthly P&I
- —
- Monthly cashflow
- —
- DSCR
- —
- Eligible?
- —
No personal income docs; deal must DSCR.
Hard money
10% down · 12.0% · 12mo
- Down + closing
- —
- Monthly P&I
- —
- Monthly cashflow
- —
- DSCR
- —
- Eligible?
- —
Short-term bridge; refi at stabilization.
Rent comps 12 comps
| Address | Beds | Baths | Sqft | Rent | $/sqft | DOM | Units | Dist |
|---|---|---|---|---|---|---|---|---|
| 18123 Noble Forest Dr Humble, TX | 4.0 | 2.5 | 2328 | $2,595 | $1.11 | 7d | 1 | 0.23mi |
| 12214 Landsdown Ridge Way Humble, TX | 4.0 | 2.5 | 2389 | $2,165 | $0.91 | 13d | 1 | 0.33mi |
| 18222 Noble Forest Dr Humble, TX | 4.0 | 2.5 | 3265 | $2,681 | $0.82 | 0d | 1 | 0.35mi |
| 18030 June Forest Dr Humble, TX | 4.0 | 2.5 | 2341 | $2,156 | $0.92 | 0d | 1 | 0.47mi |
| 18103 Yellowstone Trl Humble, TX | 4.0 | 2.5 | 2602 | $2,371 | $0.91 | 45d | 1 | 0.70mi |
| 12643 Jamestown Crossing Ln Humble, TX | 4.0 | 2.0 | 2450 | $4,995 | $2.04 | 26d | 1 | 0.74mi |
| 17923 Diamond Peak Ct Humble, TX | 4.0 | 2.0 | 2171 | $2,306 | $1.06 | 0d | 1 | 0.79mi |
| 18406 S Roaring River Ct Humble, TX | 4.0 | 4.0 | 3319 | $3,600 | $1.08 | 45d | 1 | 0.90mi |
| 4110 Forest Rain Ln Humble, TX | 4.0 | 2.5 | 2845 | $2,370 | $0.83 | 26d | 1 | 1.00mi |
| 16807 Hemlock Grove Dr Humble, TX | 4.0 | 3.0 | 2476 | $3,100 | $1.25 | 45d | 1 | 1.33mi |
| 18810 Woodbreeze Dr Humble, TX | 4.0 | 2.5 | 2200 | $2,279 | $1.04 | 26d | 1 | 1.40mi |
| 18810 Summer Anne Dr Humble, TX | 4.0 | 2.5 | 3000 | $2,376 | $0.79 | 45d | 1 | 1.49mi |
HOA detail
- Monthly dues
- $33 · $396/yr
Listing history 17 events
-
2026-06-21days on market $320,000 Active 51 DOM
-
2026-06-18days on market $320,000 Active 48 DOM
-
2026-06-17days on market $320,000 Active 47 DOM
-
2026-06-16days on market $320,000 Active 46 DOM
-
2026-06-15days on market $320,000 Active 45 DOM
-
2026-06-13days on market $320,000 Active 43 DOM
-
2026-06-13days on market $320,000 Active 42 DOM
-
2026-06-09days on market $320,000 Active 39 DOM
-
2026-06-08days on market $320,000 Active 38 DOM
-
2026-06-07days on market $320,000 Active 37 DOM
-
2026-06-04pricedays on market $320,000 Active 34 DOM
-
2026-06-03days on market $340,000 Active 33 DOM
-
2026-06-02days on market $340,000 Active 32 DOM
-
2026-06-01days on market $340,000 Active 31 DOM
-
2026-05-31days on market $340,000 Active 30 DOM
-
2026-05-19price $340,000 302-char remark
-
2026-05-01$350,000 Active 302-char remark
ⓘ Source: listings_history table (triggers on properties + properties_extension) + one-shot
backfill from property_details.listing_events for pre-trigger history.
Tax reassessment forecast TX · Resets to sale price
- Current annual tax
- $6,984 · $582/mo
- Projected year-2 tax
- $6,984 · $582/mo
- Expected delta
- $0/yr ($0/mo · 0.0%)
ⓘ Screening estimate from a state-policy table — verify with the county assessor before closing.
Climate risk First Street
- Flood 1/10 Low FEMA zone X (unshaded) · 0% chance over 30 yrs
- Wildfire 3/10 Moderate
- Heat 9/10 Extreme 7 d/yr ≥110°F today · 24 d/yr by 30 yrs out
- Wind 9/10 Extreme 99% chance of damaging wind over 30 yrs
- Air quality 3/10 Moderate 3 unhealthy d/yr today · 3 by 30 yrs out
Nearby sold comps map
Loading sold comps map…
Walkable amenities ~0.75 mi
Loading nearby amenities…
Taxation est. · year 1
- Rental income
- $33,092
- − Mortgage interest
- −$17,925
- − Property taxes
- −$6,984
- − Insurance
- −$1,600
- − Repairs & maintenance
- −$2,647
- − Management
- −$2,647
- − HOA
- −$396
- − Depreciation
- −$9,309
- Taxable loss
- −$8,417
- Est. tax savings @ 24.0%
- +$2,020
- After-tax cash flow
- $-955/yr
For passive investors: Depreciation is non-cash, so a rental often shows a tax loss while cash-flowing — sheltering income. Rental losses are passive: they offset passive income freely, and up to $25,000/yr can offset ordinary (W-2) income if you actively participate and your MAGI is under $100k (phasing out to $0 by $150k); unused losses carry forward. On sale, claimed depreciation is recaptured at up to 25%, and gains may owe capital-gains tax (a 1031 exchange can defer both). Figures are a year-1 estimate at your 24.0% rate — not tax advice; consult a CPA.
Schools (NCES district)
- District
- Humble ISD
- NCES district ID
- 4823910
- Math proficiency
- 38% ▼ -11.00%
- Reading proficiency
- 44% ▼ -7.00%
- Median HH income
- $83,946
- Composite
- 38.55/100
- National rank
- #4171
- State rank
- #262 of 826 in TX
Livability — Atascocita
- Score
- 70/100
- State rank
- #346
- US rank
- #7586
Category grades
Schools grade is shown separately in the Schools card above.
Census & demographics
- Census place
- Atascocita, TX
- County
- Harris County · 4,702,590 people
- City population
- 79,538
- Metro
- Houston-The Woodlands-Sugar Land, TX
- Population (ZIP)
- 79,538
- Household income
- $122,241
- Rent vs Own
- Severe rent burden
- 1072.0
Population outlook (Harris County) Hauer SSP2
- Today (2025)
- 5,571,493 people
- By 2030
- 6,089,821 · +9.3%
- By 2040
- 7,142,806 · +28.2%
- By 2050
- 8,185,864 · +46.9%
- By 2075
- 10,574,329 · +89.8%
- By 2100
- 12,109,958 · +117.4%
Race, ethnicity, and origin ACS 2023
- Neighborhood character
- Diverse neighborhood (Simpson 0.70)
- Race & ethnicity
- White 42% Hispanic / Latino 28% Black 21% Two or more races 18% Asian 4%
- Hispanic origin (detail)
- Mexican 20% Puerto Rican 2%
- Common ancestry
- Lithuanian 4% Slovak 1% Italian 1%
- Foreign-born
- 10% · Canada, Vietnam, China
- Languages at home
- 78% English-only · Spanish 17% Other Indo-European 1% German/W. Germanic 1%
Political lean MEDSL · Harris
- 2024 margin
- Lean D (+5.5) · D 52.0% · R 46.4% · Other 1.6%
- 2008→2024 swing
- +3.9pp toward D · 2008: 1.6pp · 2024: 5.5pp
- All cycles
- 2024: D+5.5 2020: D+13.3 2016: D+12.4 2012: D+0.1 2008: D+1.6
Not yet ingested
- Civics
- —
Market trends
- HPI YoY
- ▼ -0.95%
- Current HPI
- 218.0478
- Rent YoY
- ▲ 0.09%
- Metro
- Houston-The Woodlands-Sugar Land, TX
- State GDP YoY
- ▲ 3.95%
- F500 in state
- 110
Industry mix (Fortune 500 HQ in TX)
| Industry | F500 HQs | Revenue |
|---|---|---|
| Energy | 16 | $1,198B |
|
||
| Technology | 5 | $198B |
|
||
| Engineering / Construction | 4 | $72B |
|
||
| Energy Services | 3 | $60B |
|
||
| Utilities | 3 | $41B |
|
||
| Healthcare | 2 | $330B |
|
||
Price history
-8.6% since first listed3 events — show timeline
- 2026-06-03 Price Changed $320,000 HARMLS
- 2026-05-19 Price Changed $340,000 HARMLS
- 2026-05-01 Listed $350,000 HARMLS
Property tax history
+2.2%/yrLatest (2025): $6,984 · -1.8% YoY. Source: county tax records.
Cash-flow waterfall
monthlySold comps — $/sqft
last 12 mo · ≤1 miLoading sold comps…