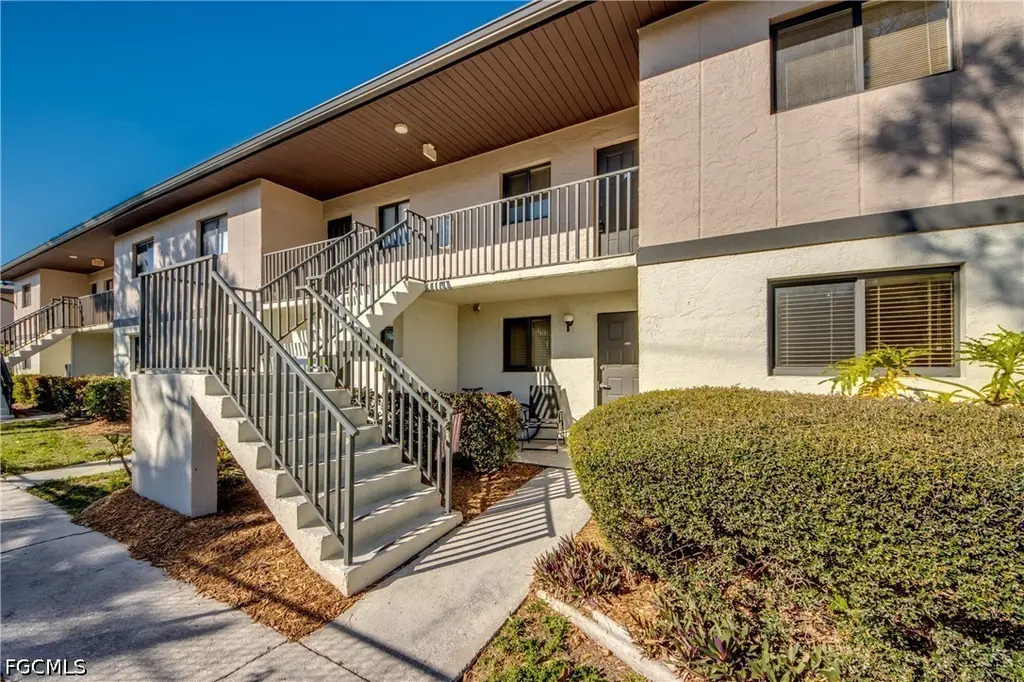
1211 Barrett Rd #1108 · North Fort Myers, FL
Flood risk 5/10 · Moderate
- FEMA flood zone
- X (shaded)
- Chance of flooding over 30 yrs
- 0.24%
- Est. flood insurance / yr
- $507 – $1,088
Fire risk 2/10 · Minimal
- Est. fire insurance / yr
- $947 – $1,759
Heat risk 10/10 · Severe
- Hot days now (above 106°F)
- 7 days/yr
- Hot days in 30 yrs
- 29 days/yr
Wind risk 10/10 · Severe
- Chance of severe wind over 30 yrs
- 99.0%
Air-quality risk 2/10 · Minimal
- Unhealthy air days now
- 1 days/yr
- Unhealthy air days in 30 yrs
- 1 days/yr
Risk factors via First Street. Map © Google.
Why this score? — see what drove the C- grade
The composite is a weighted blend of 9 inputs, each scored 0–100. Each bar is that input's sub-score; the figure is the points it added to the 100-point composite (weight × sub-score).
- Cash flow +18.8/30.0
- 1% rule +7.8/10.0
- ARV discount +7.5/15.0
- DSCR +5.9/10.0
- Schools +4.1/10.0
- Livability +3.7/5.0
- Condition / age +2.5/5.0
- Rent growth +2.0/5.0
- Appreciation +0.0/10.0
$120,000
🖨 Deal sheet 📄 Offer letter ✓ Due diligence
Listing remarks
Opportunity awaits in this 2-bedroom, 2-bath condo located in the gated North Fort Myers community of Country Pines. Priced to sell and currently the lowest-priced condo in the development, this is a rare chance to find an affordable property in a hard-to-find price range. Whether you are looking for a full-time residence, winter getaway, or investment opportunity, this move-in-ready home offers excellent value and plenty of potential to make it your own. Beautifully maintained and updated, it also features a new HVAC installed in March 2026. Country Pines offers affordable association dues, a gated entrance, full perimeter fencing, and more than 5 acres of beautifully landscaped grounds wi
Key facts
- $278 HOA
- Parking
- Community pool
Property features AI
Finance
- Other: Pets allowed conditionally — contact for details; maximum 1 pet up to 25 lbs
- HOA & community: Homeowners association with quarterly fee; Quarterly association fee of $835; Association covers management, insurance, legal/accounting, grounds maintenance, pest control, recreation facilities, street lights and trash; Community amenities include pool, barbecue, picnic area and sidewalks
Exterior
- Parking: Assigned parking (one space)
- Security: Gated community; Street lights
- Utilities: Cable available; Public water; Public sewer
- Home design: 2-story building; Entry level: 2; Faces east; Resale property
- Construction: Block, concrete and stucco construction; Shingle roof
- Exterior features: Balcony; Community pool; Paved road access; West exposure
Interior
- Kitchen: Dishwasher; Microwave; Range; Refrigerator
- Bedrooms: Other (room type listed as Other)
- Flooring: Carpet; Tile
- Bathrooms: 2 full bathrooms
- Heating & cooling: Central heating (electric); Central air conditioning (electric)
- Interior features: Furnished; Living/dining room; Pantry; Shower-only bath with separate shower; Single-hung windows
- Laundry & utility: Washer; Dryer
Neighborhood map
What this means for you Summary
Snapshot
- This is a 2-bed/2.0-bath condo listed at $120k.
Deal economics
- At list price, monthly cash flow is $122 ($1k/yr) — positive.
- The deal already cash-flows at list — no discount required.
- Meets the 1% rule at list price ($2k rent vs $120k).
- Recommended offer: $113k (6.0% below list) — sets the bar for market timing.
- Cap rate 7.5% vs local median 3.6% in North Fort Myers — top-decile yield for the area; either an underpriced asset or a hidden risk that comps aren't pricing in. Stress-test before assuming the spread holds.
Location & tenants
- Location reads 74/100 on livability (#269 in FL, #4,409 nationally) — a middle-class / working-renter tenant base. Strengths: cost of living A+, housing A+, health & safety A+; Watch: employment C-, amenities F, commute F.
- Lee (suburban): math 47% / reading 50% proficiency, ranked #42 of 73 in FL (top 58%) — families likely to look elsewhere, expect single-tenant / working-renter base with shorter leases.
- Market conditions: Rents soft (-1.9%/yr); 472 active listings in the ZIP; 30 comparable units currently listed for rent nearby; rentals at typical pace (median 24d on market — plan ~3-4 weeks tenant-placement turnaround); 15,411 units permitted in Lee County in 2024 (4,686 in 5+ unit buildings).
- This rent runs 32% of the median local income ($57k/yr) — at the standard rent-burdened threshold; future hikes will face affordability resistance.
Forward outlook
- Local home prices are declining (-3.0%/yr); year-one equity from $830 of loan paydown is wiped out by about $4k of value loss. Plan a longer hold.
- Lee County population projected at +44% by 2050 — long-run rental-demand tailwind backs the buy-and-hold thesis.
Negotiation context
- It's been on market 83 days — a 6% lower offer ($113k) is reasonable based on typical stale-listing flexibility.
- Current owner paid $40k; list at $120k implies a 201% gain — meaningful room to come down on a strong offer.
Risks & watch-outs
- Climate carrying-cost: moderate flood risk; severe wind risk, 99% chance of damaging wind over 30y; extreme-heat days projected 7→29/yr by 2055 (HVAC capex compounding) — expect insurance premiums to compound above CPI over the hold.
Questions for the listing agent
- It's been on market 83 days. Have you received any prior offers? Is the seller open to a 6% concession, seller financing, or rate buy-down credit?
- What does the HOA fee cover, when was the last increase, and are there any pending special assessments or reserve-fund shortfalls?
- Any open or pending special assessments — roof, HVAC, plumbing, elevator, façade? What's the per-unit balance and payoff schedule, and is the seller paying it off at close or rolling it to the buyer?
- Why hasn't it sold? Are there any deal-killer items the seller is aware of (foundation, flood, title, zoning, code violations)?
- Is there a deadline driving the sale (1031 exchange, divorce, estate, relocation)? That informs how much negotiation room exists.
- What's the average days-on-market for RENTAL listings here right now (not sales)? A rising rental-DOM trend means longer vacancies and softer asking-rent achievability than the comps imply.
- What's the recent tenant-quality profile in this submarket — average credit score on applications, eviction rate, late-payment / NSF rate, and stable-employment percentage? A property-management company in the area should have these aggregated.
- How much new apartment / multifamily construction is in the pipeline within 1–3 miles? Heavy new supply (>2% of stock underway) typically softens rents 12–24 months out; light construction supports rent growth.
Investment metrics
- 1% rule
- 1.28% ✓
- Cap rate
- 7.51%
- Cash-on-cash
- 4.34%
- DSCR
- 1.19
- GRM
- 6.5
CMA / ARV
No comps found within radius.
Projected returns pro-forma
-3.0% appreciation · 0.0% rent growth · sell at horizon
- IRR
- -13.8%
- Equity multiple
- 0.52×
- Total profit
- $-16,016
- Equity at exit
- $17,892
- IRR
- -12.6%
- Equity multiple
- 0.39×
- Total profit
- $-20,602
- Equity at exit
- $10,375
Cash invested: $33,600 (down + closing). Projections, not guarantees.
Landlord ↔ Tenant lean methodology
- Overall (STATE)
- 87 Strongly Landlord-Friendly
- State Florida
- 87 Strongly Landlord-Friendly · R+3
- County
- — inherits STATE
- City
- — inherits STATE
ZIP-level market 33903
- Rents YoY
- -1.9%
- Active inventory
- 472
- Price-to-rent
- 6.5×
Monthly cashflow live
- Estimated rent
- $1,534 high interval (Pro) →
- Mortgage (P&I)
- −$629
- Tax from tax record
- −$133 /mo · $1,592/yr
- Insurance
- −$50
- HOA
- −$278
- Vacancy / Maint / Mgmt
- −$322
- Net cashflow
- $122
Break-even live
UW: 25.0% down · 7.5% · 30yr · 1.5% tax · 5.0% vac · 8.0% maint · 8.0% mgmt
Financing live
Cash to close
- Down payment
- $30,000
- Closing costs
- $3,600
- Reserves months
- —
- Total cash needed
- —
Loan-product check · same deal, 3 products live
Conventional
25% down · 7.5% · 30yr
- Down + closing
- —
- Monthly P&I
- —
- Monthly cashflow
- —
- DSCR
- —
- Eligible?
- —
Personal DTI + credit; lowest rate.
DSCR
20% down · 8.5% · 30yr
- Down + closing
- —
- Monthly P&I
- —
- Monthly cashflow
- —
- DSCR
- —
- Eligible?
- —
No personal income docs; deal must DSCR.
Hard money
10% down · 12.0% · 12mo
- Down + closing
- —
- Monthly P&I
- —
- Monthly cashflow
- —
- DSCR
- —
- Eligible?
- —
Short-term bridge; refi at stabilization.
Rent comps 30 comps
| Address | Beds | Baths | Sqft | Rent | $/sqft | DOM | Units | Dist |
|---|---|---|---|---|---|---|---|---|
| 750 Pondella Rd North Fort Myers, FL | 2.0–3.0 | 1.0–2.0 | 1200 | $1,099 | $0.92 | 2d | 6 | 0.11mi |
| 1288 Waite Dr North Fort Myers, FL | 2.0 | 2.0 | 972 | $2,200 | $2.26 | 24d | 1 | 0.49mi |
| 1260 Joerin Ave North Fort Myers, FL | 1.0 | 1.0 | 936 | $1,105 | $1.18 | 24d | 1 | 0.53mi |
| 2500 Ne Pine Island Rd North Fort Myers, FL | 1.0–3.0 | 1.0–2.0 | 962 | $2,018 | $2.10 | 3d | 19 | 0.82mi |
| 3050 Steeple Cir Cape Coral, FL | 1.0–3.0 | 1.0–2.0 | 1003 | $1,668 | $1.66 | 3d | 27 | 0.85mi |
| 1100 Pondella Rd Cape Coral, FL | 2.0 | 2.0 | 938 | $1,600 | $1.71 | 3d | 1 | 0.88mi |
| 521 NE 24th Pl Apt 2 Cape Coral, FL | 2.0 | 2.0 | 1090 | $1,400 | $1.28 | 24d | 1 | 0.89mi |
| 509 NE 24th Pl Unit A Cape Coral, FL | 2.0 | 2.0 | 1113 | $1,395 | $1.25 | 3d | 1 | 0.92mi |
| 509 NE 24th Pl Unit A Cape Coral, FL | 2.0 | 2.0 | 1113 | $1,445 | $1.30 | 19d | 1 | 0.92mi |
| 501 NE 24th Pl Unit 501 Cape Coral, FL | 2.0 | 1.0 | 891 | $1,400 | $1.57 | 24d | 1 | 0.94mi |
| 2505 Liberty Park Dr Cape Coral, FL | 1.0–2.0 | 1.0–2.0 | 1092 | $2,203 | $2.02 | 3d | 14 | 0.99mi |
| 2308 NE 6th St Cape Coral, FL | 2.0 | 1.0 | 1009 | $1,450 | $1.44 | 16d | 1 | 1.04mi |
| 2308 NE 6th St Unit 1 Cape Coral, FL | 2.0 | 1.5 | 1009 | $1,450 | $1.44 | 20d | 1 | 1.04mi |
| 2303 NE 6th St #3 Cape Coral, FL | 2.0 | 1.0 | 861 | $1,400 | $1.63 | 24d | 1 | 1.04mi |
| 325 NE 23rd Ave Cape Coral, FL | 3.0 | 2.0 | 1104 | $1,496 | $1.36 | 3d | 1 | 1.14mi |
| 8049 Stillwater Ct North Fort Myers, FL | 1.0–2.0 | 1.0–2.0 | 720 | $1,600 | $2.22 | 24d | 1 | 1.18mi |
| 2700 Diplomat Pkwy E Cape Coral, FL | 1.0–3.0 | 1.0–2.0 | 1116 | $2,382 | $2.13 | 3d | 41 | 1.20mi |
| 4789 Orange Grove Blvd #12 North Fort Myers, FL | 2.0 | 1.0 | 741 | $1,300 | $1.75 | 3d | 1 | 1.29mi |
| 4789 Orange Grove Blvd North Fort Myers, FL | 2.0 | 1.0 | 741 | $1,300 | $1.75 | 21d | 1 | 1.29mi |
| 4773 Orange Grove Blvd #7 North Fort Myers, FL | 2.0 | 1.0 | 741 | $1,500 | $2.02 | 24d | 1 | 1.30mi |
| 446 San Bernardino St North Fort Myers, FL | 2.0 | 1.0 | 1104 | $1,590 | $1.44 | 10d | 1 | 1.31mi |
| 4777 Orange Grove Blvd North Fort Myers, FL | 2.0 | 1.0 | 741 | $1,200 | $1.62 | 24d | 1 | 1.31mi |
| 240 W Mariana Ave Apt B North Fort Myers, FL | 1.0 | 1.0 | 600 | $1,295 | $2.16 | 24d | 1 | 1.33mi |
| 4749 # F3 # N Unit Orange Grove Blvd unit North Fort Myers, FL | 2.0 | 1.0 | 741 | $1,095 | $1.48 | 24d | 1 | 1.35mi |
| 3260 Stockton St North Fort Myers, FL | 3.0 | 1.0–2.0 | 976 | $2,371 | $2.43 | 2d | 27 | 1.35mi |
| 538 State St North Fort Myers, FL | 3.0 | 1.5 | 1000 | $1,199 | $1.20 | 24d | 1 | 1.37mi |
| 4495 Frankie Ct North Fort Myers, FL | 2.0 | 1.5 | 1000 | $1,295 | $1.29 | 24d | 1 | 1.44mi |
| 3490 N Key Dr #203 North Fort Myers, FL | 1.0 | 1.5 | 840 | $1,300 | $1.55 | 24d | 1 | 1.45mi |
| 3490 N Key Dr #514 North Fort Myers, FL | 2.0 | 2.0 | 1103 | $1,495 | $1.36 | 24d | 1 | 1.45mi |
| 3460 N Key Dr #203 North Fort Myers, FL | 1.0 | 1.5 | 840 | $3,250 | $3.87 | 24d | 1 | 1.49mi |
HOA detail condo
- Monthly dues
- $278 · $3,336/yr
- Likely covers
- landscapingsecurity
- Assessments
- None detected in remarks — confirm with the listing agent.
Listing history 14 events
-
2026-06-17days on market $120,000 Active 83 DOM
-
2026-06-16days on market $120,000 Active 82 DOM
-
2026-06-15days on market $120,000 Active 81 DOM
-
2026-06-13days on market $120,000 Active 79 DOM
-
2026-06-10days on market $120,000 Active 76 DOM
-
2026-06-09days on market $120,000 Active 75 DOM
-
2026-06-07days on market $120,000 Active 73 DOM
-
2026-06-03days on market $120,000 Active 69 DOM
-
2026-06-02days on market $120,000 Active 68 DOM
-
2026-06-01days on market $120,000 Active 67 DOM
-
2026-06-01days on market $120,000 Active 66 DOM
-
2026-05-13price $120,000
-
2026-03-24$125,000 Active
-
1983-08-01soldstatus $39,900
ⓘ Source: listings_history table (triggers on properties + properties_extension) + one-shot
backfill from property_details.listing_events for pre-trigger history.
Tax reassessment forecast FL · Resets to sale price
- Current annual tax
- $1,592 · $133/mo
- Projected year-2 tax
- $1,592 · $133/mo
- Expected delta
- $0/yr ($0/mo · 0.0%)
ⓘ Screening estimate from a state-policy table — verify with the county assessor before closing.
Climate risk First Street
- Flood 5/10 Major FEMA zone X (shaded) · 24% chance over 30 yrs
- Wildfire 2/10 Low
- Heat 10/10 Extreme 7 d/yr ≥106°F today · 29 d/yr by 30 yrs out
- Wind 10/10 Extreme 99% chance of damaging wind over 30 yrs
- Air quality 2/10 Low 1 unhealthy d/yr today · 1 by 30 yrs out
Nearby sold comps map
Loading sold comps map…
Walkable amenities ~0.75 mi
Loading nearby amenities…
Taxation est. · year 1
- Rental income
- $18,402
- − Mortgage interest
- −$6,722
- − Property taxes
- −$1,592
- − Insurance
- −$600
- − Repairs & maintenance
- −$1,472
- − Management
- −$1,472
- − HOA
- −$3,336
- − Depreciation
- −$3,491
- Taxable loss
- −$283
- Est. tax savings @ 24.0%
- +$68
- After-tax cash flow
- $1,526/yr
For passive investors: Depreciation is non-cash, so a rental often shows a tax loss while cash-flowing — sheltering income. Rental losses are passive: they offset passive income freely, and up to $25,000/yr can offset ordinary (W-2) income if you actively participate and your MAGI is under $100k (phasing out to $0 by $150k); unused losses carry forward. On sale, claimed depreciation is recaptured at up to 25%, and gains may owe capital-gains tax (a 1031 exchange can defer both). Figures are a year-1 estimate at your 24.0% rate — not tax advice; consult a CPA.
Schools (NCES district)
- District
- Lee
- NCES district ID
- 1201080
- Math proficiency
- 47% ▼ -11.00%
- Reading proficiency
- 50% ▼ -4.00%
- Median HH income
- $49,518
- Composite
- 41.49/100
- National rank
- #3458
- State rank
- #42 of 73 in FL
Livability — North Fort Myers
- Score
- 74/100
- State rank
- #269
- US rank
- #4409
Category grades
Schools grade is shown separately in the Schools card above.
Census & demographics
- Census place
- North Fort Myers, FL
- County
- Lee County · 788,662 people
- City population
- 57,035
- Metro
- Cape Coral-Fort Myers, FL
- Population (ZIP)
- 23,655
- Household income
- $56,993
- Rent vs Own
- Severe rent burden
- 468.0
Population outlook (Lee County) Hauer SSP2
- Today (2025)
- 871,946 people
- By 2030
- 955,468 · +9.6%
- By 2040
- 1,113,587 · +27.7%
- By 2050
- 1,256,891 · +44.1%
- By 2075
- 1,560,270 · +78.9%
- By 2100
- 1,726,848 · +98.0%
Race, ethnicity, and origin ACS 2023
- Neighborhood character
- Predominantly White (81%)
- Race & ethnicity
- White 81% Hispanic / Latino 14% Two or more races 8% Black 2%
- Hispanic origin (detail)
- Mexican 3% Puerto Rican 3% Cuban 3%
- Common ancestry
- Lithuanian 4% Romanian 4% Italian 3%
- Foreign-born
- 11% · Canada
- Languages at home
- 88% English-only · Spanish 9% Other Indo-European 1%
Political lean MEDSL · Lee
- 2024 margin
- Strong R (+28.4) · D 35.5% · R 63.9%
- 2008→2024 swing
- -18.0pp toward R · 2008: -10.4pp · 2024: -28.4pp
- All cycles
- 2024: R+28.4 2020: R+19.2 2016: R+20.4 2012: R+16.6 2008: R+10.4
Not yet ingested
- Civics
- —
Market trends
- HPI YoY
- ▼ -172.26%
- Current HPI
- 256.773
- Rent YoY
- ▼ -1.94%
- Metro
- Cape Coral-Fort Myers, FL
- State GDP YoY
- ▲ 3.28%
- F500 in state
- 36
Industry mix (Fortune 500 HQ in FL)
| Industry | F500 HQs | Revenue |
|---|---|---|
| Industrial Technology | 2 | $29B |
|
||
| Insurance | 2 | $17B |
|
||
| Retail | 1 | $60B |
|
||
| Technology Distribution | 1 | $58B |
|
||
| Homebuilding | 1 | $35B |
|
||
| Technology Manufacturing | 1 | $35B |
|
||
Price history
+200.8% since first listed3 events — show timeline
- 2026-05-13 Price Changed $120,000 FORTMLS
- 2026-03-24 Listed $125,000 FORTMLS
- 1983-08-01 Sold (Public Records) $39,900 Public Records
Property tax history
+10.7%/yrLatest (2025): $1,592 · -6.3% YoY. Source: county tax records.
Cash-flow waterfall
monthlySold comps — $/sqft
last 12 mo · ≤1 miLoading sold comps…