Eldorado 125 · East Carroll, PA
Flood risk 1/10 · Minimal
- FEMA flood zone
- X (unshaded)
- Chance of flooding over 30 yrs
- 0.0%
- Est. flood insurance / yr
- $473 – $860
Fire risk 1/10 · Minimal
- Est. fire insurance / yr
- $511 – $949
Heat risk 2/10 · Minimal
- Hot days now (above 90°F)
- 7 days/yr
- Hot days in 30 yrs
- 17 days/yr
Wind risk 2/10 · Minimal
- Chance of severe wind over 30 yrs
- —
Air-quality risk 2/10 · Minimal
- Unhealthy air days now
- 1 days/yr
- Unhealthy air days in 30 yrs
- 3 days/yr
Risk factors via First Street. Map © Google.
Why this score? — see what drove the B+ grade
The composite is a weighted blend of 9 inputs, each scored 0–100. Each bar is that input's sub-score; the figure is the points it added to the 100-point composite (weight × sub-score).
- Cash flow +30.0/30.0
- 1% rule +10.0/10.0
- DSCR +10.0/10.0
- ARV discount +7.5/15.0
- Appreciation +6.7/10.0
- Schools +3.8/10.0
- Rent growth +2.5/5.0
- Livability +2.5/5.0
- Condition / age +2.5/5.0
$38,900
🖨 Deal sheet 📄 Offer letter ✓ Due diligence
Listing remarks MLS
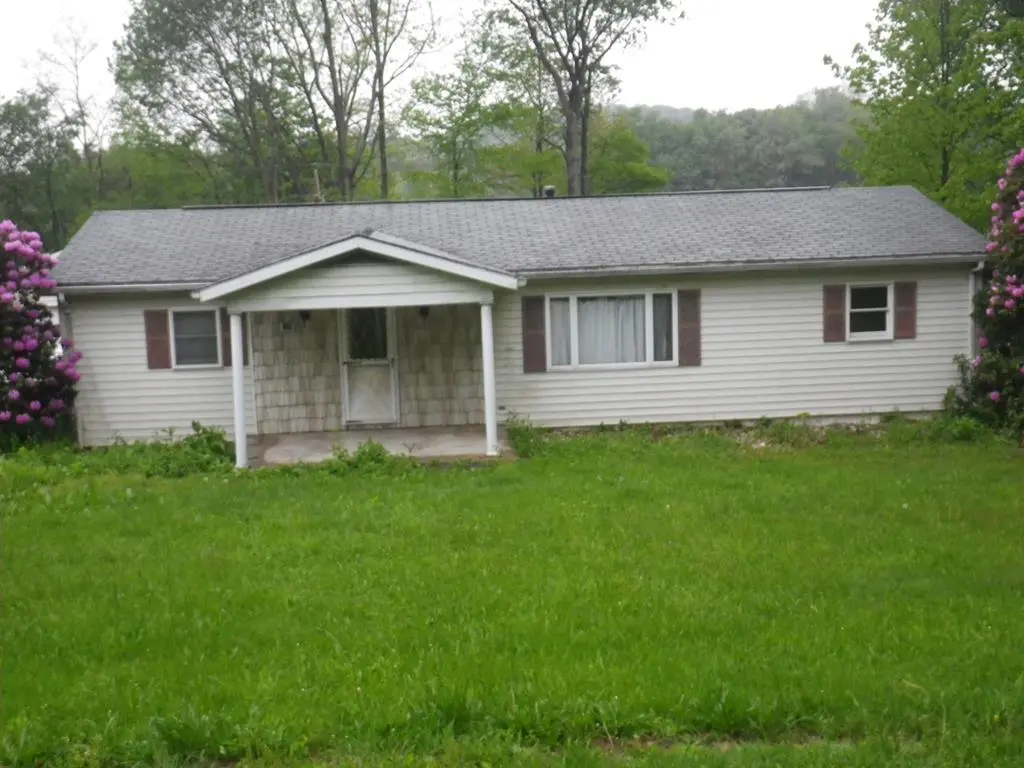
New Listing- East Carroll Twp- 3BR, 2 1/2 bath doublewide on over 1/2 acre lot. Oil FA heat. 2 car detached garage.
Key facts
- 2 garage spots
- Built 1986
- Listed 6 days
Property features AI
Finance
- Other: Located in the Cambria subdivision
Exterior
- Parking: Detached garage; 2 covered garage spaces; Off-street parking and driveway; Additional open parking
- Utilities: Electricity connected (100 amp service, circuit breakers); Septic tank
- Home design: Manufactured double-wide home; Single-story (manufactured house); Residential property
- Construction: Vinyl siding; Shingle roof; Built as a manufactured house
- Exterior features: Covered patio/porch; Paved road frontage (150'); Residential zoning
Interior
- Kitchen: Includes appliances (unspecified/other)
- Bathrooms: 1 full bathroom
- Heating & cooling: Forced air heating (oil); No central cooling
- Interior features: Eat-in kitchen; Insulated windows; No fireplace
- Laundry & utility: Laundry in common area; Crawl space basement
Neighborhood map
What this means for you Summary
Snapshot
- This is a 3-bed/1.0-bath single-family listed at $39k.
Deal economics
- At list price, monthly cash flow is $539 ($6k/yr) — positive.
- The deal already cash-flows at list — no discount required.
- Meets the 1% rule at list price ($1k rent vs $39k).
Location & tenants
- Location reads: area grade B — affects rentability + tenant quality, not the cash-flow math above.
- Cambria Heights SD (rural): math 27% / reading 63% proficiency, ranked #280 of 539 in PA (top 52%) — families likely to look elsewhere, expect single-tenant / working-renter base with shorter leases.
- Zoned schools: Cambria Heights El Sch (math 32% / reading 59%, grade D-, #801 of 1,518 statewide, top 53%, 535 students, 51% FRL); Cambria Heights Ms (math 12% / reading 62%, grade F, #298 of 512 statewide, top 60%, 306 students, 49% FRL); Cambria Heights Shs (math 67% / reading 77%, grade B+, #39 of 437 statewide, top 9%, 437 students, 31% FRL).
- Market conditions: 4 active listings in the ZIP; 64 units permitted in Cambria County in 2024 (0 in 5+ unit buildings).
Forward outlook
- In year one you build about $2k of equity ($269 loan paydown + $1k appreciation (3.4% local appreciation)).
- Cambria County population projected at -28% by 2050 — secular population decline; favor cash flow + early exit over multi-decade hold.
- At projected returns (3.4% appreciation + 3.0% rent growth), your $11k cash investment doubles in ~2 years — after that, you're playing with house money.
Negotiation context
- Only 6 days on market — expect competitive offers; lowballing is unlikely to land.
- 4 sale attempts since 19y ago with the ask held roughly flat each time — persistent listings suggest the price (not the market) is what's stuck; bring a comps-based counter.
Risks & watch-outs
- Watch-outs: property tax is 4.1% of price.
Questions for the listing agent
- Property tax is high relative to price — has the assessment been appealed recently, and will the sale trigger a re-assessment?
- Is there a deadline driving the sale (1031 exchange, divorce, estate, relocation)? That informs how much negotiation room exists.
- What's the average days-on-market for RENTAL listings here right now (not sales)? A rising rental-DOM trend means longer vacancies and softer asking-rent achievability than the comps imply.
- What's the recent tenant-quality profile in this submarket — average credit score on applications, eviction rate, late-payment / NSF rate, and stable-employment percentage? A property-management company in the area should have these aggregated.
- How much new for-sale + rental construction is in the pipeline within 1–3 miles? Heavy new supply typically softens prices + rents 12–24 months out; constrained supply supports both.
Investment metrics
- 1% rule
- 2.91% ✓
- Cap rate
- 22.91%
- Cash-on-cash
- 59.36%
- DSCR
- 3.64
- GRM
- 2.9
CMA / ARV
No comps found within radius.
Projected returns pro-forma
3.41% appreciation · 3.0% rent growth · sell at horizon
- IRR
- 64.7%
- Equity multiple
- 4.67×
- Total profit
- $39,927
- Equity at exit
- $18,400
- IRR
- 63.9%
- Equity multiple
- 9.55×
- Total profit
- $93,103
- Equity at exit
- $29,085
Cash invested: $10,892 (down + closing). Projections, not guarantees.
Landlord ↔ Tenant lean methodology
- Overall (STATE)
- 62 Landlord-Friendly
- State Pennsylvania
- 62 Landlord-Friendly · EVEN
- County
- — inherits STATE
- City
- — inherits STATE
ZIP-level market 15722
- Home prices YoY
- 3.5%
- Active inventory
- 4
- Price-to-rent
- 2.9×
Monthly cashflow live
- Estimated rent
- $1,131 medium interval (Pro) →
- Mortgage (P&I)
- −$204
- Tax from tax record
- −$134 /mo · $1,612/yr
- Insurance
- −$16
- HOA
- −$0
- Vacancy / Maint / Mgmt
- −$237
- Net cashflow
- $539
Break-even live
UW: 25.0% down · 7.5% · 30yr · 1.5% tax · 5.0% vac · 8.0% maint · 8.0% mgmt
Financing live
Cash to close
- Down payment
- $9,725
- Closing costs
- $1,167
- Reserves months
- —
- Total cash needed
- —
Loan-product check · same deal, 3 products live
Conventional
25% down · 7.5% · 30yr
- Down + closing
- —
- Monthly P&I
- —
- Monthly cashflow
- —
- DSCR
- —
- Eligible?
- —
Personal DTI + credit; lowest rate.
DSCR
20% down · 8.5% · 30yr
- Down + closing
- —
- Monthly P&I
- —
- Monthly cashflow
- —
- DSCR
- —
- Eligible?
- —
No personal income docs; deal must DSCR.
Hard money
10% down · 12.0% · 12mo
- Down + closing
- —
- Monthly P&I
- —
- Monthly cashflow
- —
- DSCR
- —
- Eligible?
- —
Short-term bridge; refi at stabilization.
Listing history 7 events
-
2026-06-18days on market $38,900 Active 6 DOM
-
2026-06-17days on market $38,900 Active 5 DOM
-
2026-06-16days on market $38,900 Active 4 DOM
-
2026-06-16remarks 435-char remark
-
2026-06-15days on market $38,900 Active 3 DOM
-
2026-06-12remarks 370-char remark
-
2026-06-12$38,900 Active 1 DOM
ⓘ Source: listings_history table (triggers on properties + properties_extension) + one-shot
backfill from property_details.listing_events for pre-trigger history.
Tax reassessment forecast PA · Partial reset (capped growth)
- Current annual tax
- $1,612 · $134/mo
- Projected year-2 tax
- $1,612 · $134/mo
- Expected delta
- $0/yr ($0/mo · 0.0%)
ⓘ Screening estimate from a state-policy table — verify with the county assessor before closing.
Climate risk First Street
- Flood 1/10 Low FEMA zone X (unshaded) · 0% chance over 30 yrs
- Wildfire 1/10 Low
- Heat 2/10 Low 7 d/yr ≥90°F today · 17 d/yr by 30 yrs out
- Wind 2/10 Low
- Air quality 2/10 Low 1 unhealthy d/yr today · 3 by 30 yrs out
Nearby sold comps map
Loading sold comps map…
Walkable amenities ~0.75 mi
Loading nearby amenities…
Taxation est. · year 1
- Rental income
- $13,570
- − Mortgage interest
- −$2,179
- − Property taxes
- −$1,612
- − Insurance
- −$194
- − Repairs & maintenance
- −$1,086
- − Management
- −$1,086
- − Depreciation
- −$1,132
- Taxable income
- $6,281
- Est. tax owed @ 24.0%
- −$1,508
- After-tax cash flow
- $4,958/yr
For passive investors: Depreciation is non-cash, so a rental often shows a tax loss while cash-flowing — sheltering income. Rental losses are passive: they offset passive income freely, and up to $25,000/yr can offset ordinary (W-2) income if you actively participate and your MAGI is under $100k (phasing out to $0 by $150k); unused losses carry forward. On sale, claimed depreciation is recaptured at up to 25%, and gains may owe capital-gains tax (a 1031 exchange can defer both). Figures are a year-1 estimate at your 24.0% rate — not tax advice; consult a CPA.
Schools (NCES district)
- District
- Cambria Heights SD
- NCES district ID
- 4204740
- Math proficiency
- 27% ▼ -15.00%
- Reading proficiency
- 63% ▼ -11.00%
- Median HH income
- $44,855
- Composite
- 38.0/100
- National rank
- #4291
- State rank
- #280 of 539 in PA
Livability — East Carroll
No livability data for this city. (Only ~50 U.S. cities are tracked.)
Census & demographics
- Population (ZIP)
- 2,382
Population outlook (Cambria County) Hauer SSP2
- Today (2025)
- 122,754 people
- By 2030
- 115,827 · -5.6%
- By 2040
- 101,309 · -17.5%
- By 2050
- 88,379 · -28.0%
- By 2075
- 65,237 · -46.9%
- By 2100
- 46,909 · -61.8%
Race, ethnicity, and origin ACS 2023
- Neighborhood character
- Predominantly White (97%)
- Race & ethnicity
- White 97% Hispanic / Latino 2% Two or more races 1%
- Common ancestry
- Romanian 13% Iranian 8% Lithuanian 2%
- Foreign-born
- 0%
- Languages at home
- 99% English-only · Spanish 1%
Political lean MEDSL · Cambria
- 2024 margin
- Solid R (+39.7) · D 29.8% · R 69.5%
- 2008→2024 swing
- -40.4pp toward R · 2008: 0.7pp · 2024: -39.7pp
- All cycles
- 2024: R+39.7 2020: R+37.3 2016: R+37.8 2012: R+17.8 2008: D+0.7
Not yet ingested
- Civics
- —
Market trends
- HPI YoY
- ▲ 3.41%
- Current HPI
- 100.5281
- Rent YoY
- —
- Metro
- —
- State GDP YoY
- ▲ 1.68%
- F500 in state
- 34
Industry mix (Fortune 500 HQ in PA)
| Industry | F500 HQs | Revenue |
|---|---|---|
| Healthcare | 2 | $309B |
|
||
| Insurance | 2 | $27B |
|
||
| Telecommunications / Media | 1 | $124B |
|
||
| Industrial Distribution | 1 | $22B |
|
||
| Financial Services | 1 | $20B |
|
||
| Chemicals / Materials | 1 | $18B |
|
||
Price history
+94.5% since first listed9 events — show timeline
- 2026-06-12 Listed $38,900 HCBR
- 2014-10-20 Sold (Public Records) $38,650 Public Records
- 2014-10-20 Sold (MLS) $38,650 AHARMLS
- 2013-08-25 Listed $42,500 AHARMLS
- 2008-12-22 Sold (MLS) $49,000 CSMLS
- 2008-11-24 Sold (Public Records) $49,000 Public Records
- 2008-04-17 Listed $54,900 CSMLS
- 2007-09-27 Listed $79,900 AHARMLS
- 1981-06-01 Sold (Public Records) $20,000 Public Records
Property tax history
+1.4%/yrLatest (2026): $1,612 · +3.9% YoY. Source: county tax records.
Cash-flow waterfall
monthlySold comps — $/sqft
last 12 mo · ≤1 miLoading sold comps…