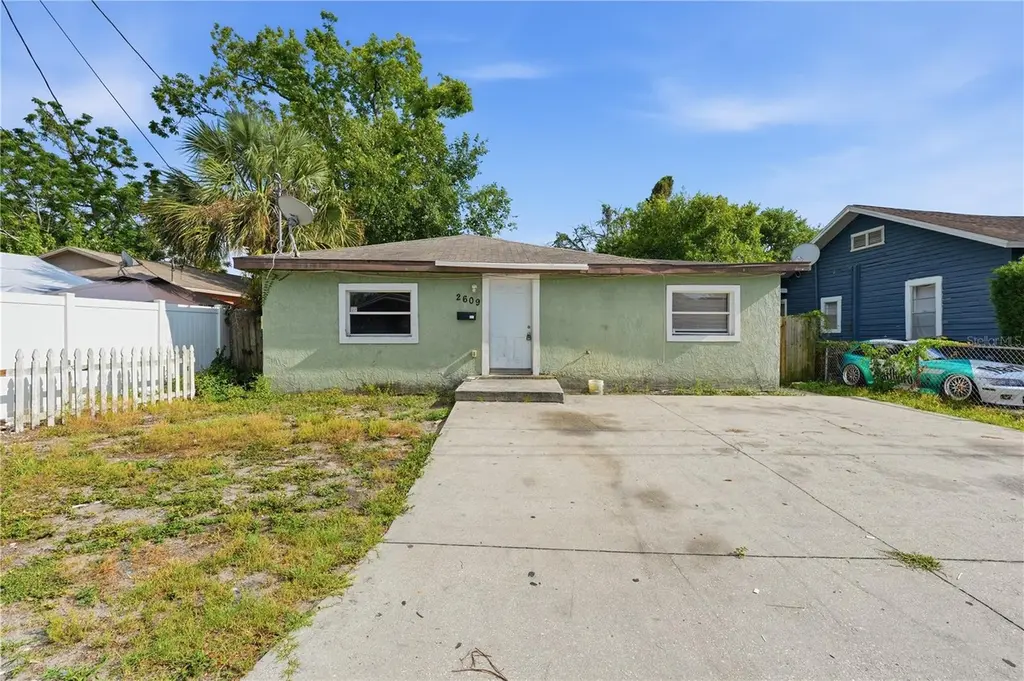
2609 E 28th Ave · Tampa, FL
Flood risk 1/10 · Minimal
- FEMA flood zone
- X (unshaded)
- Chance of flooding over 30 yrs
- 0.0%
- Est. flood insurance / yr
- $507 – $1,088
Fire risk 1/10 · Minimal
- Est. fire insurance / yr
- $947 – $1,759
Heat risk 10/10 · Severe
- Hot days now (above 108°F)
- 7 days/yr
- Hot days in 30 yrs
- 26 days/yr
Wind risk 9/10 · Severe
- Chance of severe wind over 30 yrs
- 99.0%
Air-quality risk 3/10 · Minor
- Unhealthy air days now
- 3 days/yr
- Unhealthy air days in 30 yrs
- 4 days/yr
Risk factors via First Street. Map © Google.
Why this score? — see what drove the B- grade
The composite is a weighted blend of 9 inputs, each scored 0–100. Each bar is that input's sub-score; the figure is the points it added to the 100-point composite (weight × sub-score).
- Cash flow +22.0/30.0
- Appreciation +10.0/10.0
- ARV discount +7.5/15.0
- DSCR +7.0/10.0
- 1% rule +5.3/10.0
- Schools +4.2/10.0
- Livability +4.0/5.0
- Rent growth +2.6/5.0
- Condition / age +2.5/5.0
$199,900
🖨 Deal sheet 📄 Offer letter ✓ Due diligence
Listing remarks MLS
BANK OWNED!! NOT A SHORT SALE!! 3 BEDROOM 1 BATHROOM HOME IN GREAT CONDITION, GREAT OPPRTUNITY TO BUY A HOUSE THAT NEEDS MINOR TLC AND MAKE IT YOUR OWNLOCATED CLOSE TO SCHOOLS, INTERSTATE, AND SHOPPING!
Key facts
- Open living spaces
- One story layout
- Fenced lot
Tags
Property features AI
Finance
- Other: Zoning: RM-16; Total living area reported as 1,279 square feet; Building area reported as 4,750 square feet; Lot size approximately 441 square meters; Direction faces north
- HOA & community: No association; Pets allowed
Exterior
- Parking: Driveway
- Utilities: Public water; Public sewer; Electricity available; Phone available; Water available
- Home design: Single Family Residence; Residential property; One story; Faces north; Property condition: Fixer
- Construction: Frame construction; Shingle roof; Foundation: Slab/Other; Built on approximately 0.11 acre
- Exterior features: Level lot; Sidewalk; Paved; Private mailbox; Storage
Interior
- Kitchen: Cooktop; Refrigerator
- Bedrooms: 3 bedrooms
- Flooring: Laminate; Tile
- Bathrooms: 2 full bathrooms
- Heating & cooling: Central heating; Central air
- Interior features: Cooktop; Refrigerator; Private mailbox; Storage; Laminate flooring; Tile flooring; Central heating; Central air
- Laundry & utility: Laundry: Other
Neighborhood map
What this means for you Summary
Snapshot
- This is a 2-bed/1.0-bath single-family listed at $200k.
Deal economics
- At list price, monthly cash flow is $318 ($4k/yr) — positive.
- The deal already cash-flows at list — no discount required.
- Meets the 1% rule at list price ($2k rent vs $200k).
- Recommended offer: $197k (1.5% below list) — sets the bar for market timing.
Location & tenants
- Location reads 79/100 on livability (#142 in FL, #2,135 nationally) — a middle-class / working-renter tenant base. Strengths: commute A+, housing A+, health & safety A+; Watch: crime D+.
- Hillsborough (suburban): math 47% / reading 50% proficiency, ranked #41 of 73 in FL (top 56%) — families likely to look elsewhere, expect single-tenant / working-renter base with shorter leases.
- Zoned schools: Middleton High School (math 23% / reading 51%, grade F, #340 of 667 statewide, top 52%, 1,511 students, 57% FRL).
- Market conditions: Rents flat; 187 active listings in the ZIP; 40 comparable units currently listed for rent nearby; rentals at typical pace (median 21d on market — plan ~3-4 weeks tenant-placement turnaround); lower-income renter base — watch delinquency; 9,053 units permitted in Hillsborough County in 2024 (4,555 in 5+ unit buildings).
- At $2,059/mo this rent would consume 67% of the median local household income ($37k/yr) (locally 1374% of renters already pay >50% of income on rent) — very limited rent-growth headroom before tenants either downsize or default.
Forward outlook
- In year one you build about $21k of equity ($1k loan paydown + $20k appreciation (10.0% local appreciation)).
- Hillsborough County population projected at +37% by 2050 — long-run rental-demand tailwind backs the buy-and-hold thesis.
- At projected returns (10.0% appreciation + 0.6% rent growth), your $56k cash investment doubles in ~3 years — after that, you're playing with house money.
- By year 2, paydown + projected appreciation supports a ~$34k cash-out refi (75% LTV) — recoverable capital for the next deal without selling this one.
Negotiation context
- It's been on market 20 days — a 2% lower offer ($197k) is reasonable based on typical stale-listing flexibility.
- 4 sale attempts since 19y ago with the ask held roughly flat each time — persistent listings suggest the price (not the market) is what's stuck; bring a comps-based counter.
Risks & watch-outs
- Watch-outs: built in 1947 — expect roof / HVAC / electrical / plumbing capex.
- Climate carrying-cost: severe wind risk, 99% chance of damaging wind over 30y; extreme-heat days projected 7→26/yr by 2055 (HVAC capex compounding) — expect insurance premiums to compound above CPI over the hold.
Questions for the listing agent
- Built in 1947 — when were the roof, HVAC, electrical panel, plumbing, and water heater last replaced?
- Is there a deadline driving the sale (1031 exchange, divorce, estate, relocation)? That informs how much negotiation room exists.
- Crime grade is D in this area — have there been break-ins, vandalism, or insurance claims at this property in the last 3 years? What carrier currently insures it and at what premium?
- What's the average days-on-market for RENTAL listings here right now (not sales)? A rising rental-DOM trend means longer vacancies and softer asking-rent achievability than the comps imply.
- What's the recent tenant-quality profile in this submarket — average credit score on applications, eviction rate, late-payment / NSF rate, and stable-employment percentage? A property-management company in the area should have these aggregated.
- How much new for-sale + rental construction is in the pipeline within 1–3 miles? Heavy new supply typically softens prices + rents 12–24 months out; constrained supply supports both.
Investment metrics
- 1% rule
- 1.03% ✓
- Cap rate
- 8.20%
- Cash-on-cash
- 6.82%
- DSCR
- 1.30
- GRM
- 8.1
CMA / ARV
No comps found within radius.
Projected returns pro-forma
10.0% appreciation · 0.58% rent growth · sell at horizon
- IRR
- 28.3%
- Equity multiple
- 3.22×
- Total profit
- $124,216
- Equity at exit
- $180,086
- IRR
- 24.0%
- Equity multiple
- 7.09×
- Total profit
- $340,857
- Equity at exit
- $388,362
Cash invested: $55,972 (down + closing). Projections, not guarantees.
Landlord ↔ Tenant lean methodology
- Overall (STATE)
- 87 Strongly Landlord-Friendly
- State Florida
- 87 Strongly Landlord-Friendly · R+3
- County
- — inherits STATE
- City
- — inherits STATE
ZIP-level market 33605
- Home prices YoY
- 3.7%
- Rents YoY
- 0.6%
- Active inventory
- 187
- Price-to-rent
- 8.1×
Monthly cashflow live
- Estimated rent
- $2,059 high interval (Pro) →
- Mortgage (P&I)
- −$1,048
- Tax from tax record
- −$177 /mo · $2,123/yr
- Insurance
- −$83
- HOA
- −$0
- Vacancy / Maint / Mgmt
- −$432
- Net cashflow
- $318
Break-even live
UW: 25.0% down · 7.5% · 30yr · 1.5% tax · 5.0% vac · 8.0% maint · 8.0% mgmt
Financing live
Cash to close
- Down payment
- $49,975
- Closing costs
- $5,997
- Reserves months
- —
- Total cash needed
- —
Loan-product check · same deal, 3 products live
Conventional
25% down · 7.5% · 30yr
- Down + closing
- —
- Monthly P&I
- —
- Monthly cashflow
- —
- DSCR
- —
- Eligible?
- —
Personal DTI + credit; lowest rate.
DSCR
20% down · 8.5% · 30yr
- Down + closing
- —
- Monthly P&I
- —
- Monthly cashflow
- —
- DSCR
- —
- Eligible?
- —
No personal income docs; deal must DSCR.
Hard money
10% down · 12.0% · 12mo
- Down + closing
- —
- Monthly P&I
- —
- Monthly cashflow
- —
- DSCR
- —
- Eligible?
- —
Short-term bridge; refi at stabilization.
Rent comps 40 comps
| Address | Beds | Baths | Sqft | Rent | $/sqft | DOM | Units | Dist |
|---|---|---|---|---|---|---|---|---|
| 2610 E Lake Ave Tampa, FL | 3.0 | 2.0 | 1698 | $2,250 | $1.33 | 2d | 1 | 0.14mi |
| 2205 Chipco St Tampa, FL | 2.0 | 1.0 | 1100 | $1,600 | $1.45 | 24d | 1 | 0.27mi |
| 3107 Chipco St Tampa, FL | 3.0 | 1.0 | 1268 | $1,799 | $1.42 | 24d | 1 | 0.32mi |
| 3716 N 31st St Tampa, FL | 3.0 | 2.0 | 1200 | $1,895 | $1.58 | 5d | 1 | 0.36mi |
| 2108 E 22nd Ave Tampa, FL | 3.0 | 3.0 | 1308 | $2,100 | $1.61 | 5d | 1 | 0.47mi |
| 2108 E 22nd Ave Tampa, FL | 3.0 | 3.0 | 1308 | $2,100 | $1.61 | 3d | 1 | 0.47mi |
| 4204 N 29th St Tampa, FL | 3.0 | 1.0 | 957 | $1,800 | $1.88 | 24d | 1 | 0.50mi |
| 2214 E 18th Ave Tampa, FL | 3.0 | 2.0 | 1188 | $2,295 | $1.93 | 5d | 1 | 0.58mi |
| 3002 E 38th Ave Tampa, FL | 3.0 | 2.0 | 1413 | $2,600 | $1.84 | 24d | 1 | 0.59mi |
| 3101 E 18th Ave Tampa, FL | 3.0 | 1.0 | 1050 | $1,750 | $1.67 | 3d | 1 | 0.61mi |
| 3507 E 29th Ave Tampa, FL | 3.0 | 2.0 | 928 | $1,700 | $1.83 | 24d | 1 | 0.61mi |
| 4303 N 30th St Tampa, FL | 3.0 | 2.0 | 1260 | $3,200 | $2.54 | 1d | 1 | 0.64mi |
| 2703 N 24th St Unit 1 Tampa, FL | 3.0 | 3.0 | 1164 | $2,295 | $1.97 | 14d | 1 | 0.64mi |
| 3511 Bishop Eddie Newkirk Way Tampa, FL | 3.0 | 1.0 | 1056 | $1,800 | $1.70 | 10d | 1 | 0.66mi |
| 3511 Bishop Eddie Newkirk Way Tampa, FL | 3.0 | 1.0 | 1056 | $1,800 | $1.70 | 24d | 1 | 0.66mi |
| 3517 Bishop Eddie Newkirk Way Tampa, FL | 3.0 | 2.0 | 1200 | $2,500 | $2.08 | 24d | 1 | 0.69mi |
| 1807 E 20th Ave Tampa, FL | 3.0 | 2.0 | 1131 | $2,900 | $2.56 | 24d | 1 | 0.69mi |
| 2104 E Columbus Dr Unit 301 Tampa, FL | 3.0 | 2.0 | 1083 | $2,050 | $1.89 | 24d | 1 | 0.70mi |
| 2104 E Columbus Dr Tampa, FL | 3.0 | 2.0 | 1231 | $1,995 | $1.62 | 24d | 1 | 0.70mi |
| 2308 E 15th Ave Tampa, FL | 3.0 | 1.0 | 936 | $1,895 | $2.02 | 14d | 1 | 0.70mi |
| 2006 E Columbus Dr Unit A Tampa, FL | 2.0 | 1.0 | 896 | $1,495 | $1.67 | 1d | 1 | 0.73mi |
| 1515 E 31st Ave Tampa, FL | 2.0 | 1.0 | 914 | $1,500 | $1.64 | 5d | 1 | 0.74mi |
| 2708 N 19th St Tampa, FL | 3.0 | 2.0 | 1680 | $2,200 | $1.31 | 16d | 1 | 0.77mi |
| 3021 Sanchez St Tampa, FL | 3.0 | 1.0 | 1300 | $2,195 | $1.69 | 24d | 1 | 0.79mi |
| 2615 E Curtis St Tampa, FL | 3.0 | 2.0 | 1572 | $1,850 | $1.18 | 20d | 1 | 0.81mi |
| 1808 E Columbus Dr #5 Tampa, FL | 2.0 | 2.5 | 1620 | $1,900 | $1.17 | 2d | 1 | 0.82mi |
| 1520 E 21st Ave Tampa, FL | 3.0 | 2.0 | 1671 | $2,350 | $1.41 | 16d | 1 | 0.83mi |
| 1504 E 33rd Ave Tampa, FL | 3.0 | 2.0 | 1108 | $2,900 | $2.62 | 24d | 1 | 0.83mi |
| 2504 E 12th Ave Tampa, FL | 3.0 | 2.0 | 1422 | $2,500 | $1.76 | 5d | 1 | 0.83mi |
| 1709 E Chelsea St Unit F Tampa, FL | 2.0 | 1.0 | 1041 | $1,625 | $1.56 | 23d | 1 | 0.83mi |
| 1716 E Columbus Dr Unit A Tampa, FL | 2.0 | 1.0 | 924 | $1,800 | $1.95 | 24d | 1 | 0.86mi |
| 1602 E North Bay St Tampa, FL | 3.0 | 2.0 | 1200 | $2,100 | $1.75 | 24d | 1 | 0.87mi |
| 3705 E North Bay St Tampa, FL | 3.0 | 2.0 | 969 | $1,850 | $1.91 | 3d | 1 | 0.87mi |
| 2810 N 16th St Tampa, FL | 2.0 | 1.0 | 1066 | $2,550 | $2.39 | 12d | 1 | 0.89mi |
| 2907 N 15th St Unit D Tampa, FL | 3.0 | 2.0 | 888 | $1,850 | $2.08 | 5d | 1 | 0.91mi |
| 2312 E 10th Ave Tampa, FL | 3.0 | 1.0 | 1520 | $2,400 | $1.58 | 17d | 1 | 0.94mi |
| 3601 N 13th St Tampa, FL | 3.0 | 2.5 | 1800 | $2,550 | $1.42 | 24d | 1 | 0.94mi |
| 3411 N 13th St Tampa, FL | 3.0 | 2.0 | 978 | $1,895 | $1.94 | 24d | 1 | 0.94mi |
| 1305 E Louise Ave Tampa, FL | 3.0 | 2.0 | 1384 | $2,700 | $1.95 | 24d | 1 | 0.95mi |
| 3724 E 38th Ave Tampa, FL | 3.0 | 2.0 | 1188 | $1,895 | $1.60 | 24d | 1 | 0.96mi |
Listing history 16 events
-
2026-06-13statusdays on market $199,900 Pending 20 DOM
-
2026-06-09days on market $199,900 Active 19 DOM
-
2026-06-08days on market $199,900 Active 18 DOM
-
2026-06-07days on market $199,900 Active 17 DOM
-
2026-06-04days on market $199,900 Active 14 DOM
-
2026-06-03days on market $199,900 Active 13 DOM
-
2026-06-02days on market $199,900 Active 12 DOM
-
2026-06-01days on market $199,900 Active 11 DOM
-
2026-05-31days on market $199,900 Active 10 DOM
-
2026-05-21$199,900 Active
-
2013-07-25soldstatus $273,100
-
2009-05-08soldstatus $35,000 203-char remark
Show marketing remark (203 chars)
BANK OWNED!! NOT A SHORT SALE!! 3 BEDROOM 1 BATHROOM HOME IN GREAT CONDITION, GREAT OPPRTUNITY TO BUY A HOUSE THAT NEEDS MINOR TLC AND MAKE IT YOUR OWNLOCATED CLOSE TO SCHOOLS, INTERSTATE, AND SHOPPING!
-
2009-03-25$36,900 203-char remark
Show marketing remark (203 chars)
BANK OWNED!! NOT A SHORT SALE!! 3 BEDROOM 1 BATHROOM HOME IN GREAT CONDITION, GREAT OPPRTUNITY TO BUY A HOUSE THAT NEEDS MINOR TLC AND MAKE IT YOUR OWNLOCATED CLOSE TO SCHOOLS, INTERSTATE, AND SHOPPING!
-
2007-12-18$169,000
-
2007-02-01historical
-
2007-01-04$145,000
ⓘ Source: listings_history table (triggers on properties + properties_extension) + one-shot
backfill from property_details.listing_events for pre-trigger history.
Tax reassessment forecast FL · Resets to sale price
- Current annual tax
- $2,123 · $177/mo
- Projected year-2 tax
- $2,123 · $177/mo
- Expected delta
- $0/yr ($0/mo · 0.0%)
ⓘ Screening estimate from a state-policy table — verify with the county assessor before closing.
Climate risk First Street
- Flood 1/10 Low FEMA zone X (unshaded) · 0% chance over 30 yrs
- Wildfire 1/10 Low
- Heat 10/10 Extreme 7 d/yr ≥108°F today · 26 d/yr by 30 yrs out
- Wind 9/10 Extreme 99% chance of damaging wind over 30 yrs
- Air quality 3/10 Moderate 3 unhealthy d/yr today · 4 by 30 yrs out
Nearby sold comps map
Loading sold comps map…
Walkable amenities ~0.75 mi
Loading nearby amenities…
Taxation est. · year 1
- Rental income
- $24,707
- − Mortgage interest
- −$11,198
- − Property taxes
- −$2,123
- − Insurance
- −$1,000
- − Repairs & maintenance
- −$1,977
- − Management
- −$1,977
- − Depreciation
- −$5,815
- Taxable income
- $618
- Est. tax owed @ 24.0%
- −$148
- After-tax cash flow
- $3,668/yr
For passive investors: Depreciation is non-cash, so a rental often shows a tax loss while cash-flowing — sheltering income. Rental losses are passive: they offset passive income freely, and up to $25,000/yr can offset ordinary (W-2) income if you actively participate and your MAGI is under $100k (phasing out to $0 by $150k); unused losses carry forward. On sale, claimed depreciation is recaptured at up to 25%, and gains may owe capital-gains tax (a 1031 exchange can defer both). Figures are a year-1 estimate at your 24.0% rate — not tax advice; consult a CPA.
Schools (NCES district)
- District
- Hillsborough
- NCES district ID
- 1200870
- Math proficiency
- 47% ▼ -8.00%
- Reading proficiency
- 50% ▼ -4.00%
- Median HH income
- $50,622
- Composite
- 41.6/100
- National rank
- #3435
- State rank
- #41 of 73 in FL
Livability — Tampa
- Score
- 79/100
- State rank
- #142
- US rank
- #2135
Category grades
Schools grade is shown separately in the Schools card above.
Census & demographics
- Census place
- Tampa, FL
- County
- Hillsborough County · 1,540,968 people
- City population
- 523,346
- Metro
- Tampa-St. Petersburg-Clearwater, FL
- Population (ZIP)
- 16,030
- Household income
- $36,975
- Rent vs Own
- Severe rent burden
- 1374.0
Population outlook (Hillsborough County) Hauer SSP2
- Today (2025)
- 1,607,022 people
- By 2030
- 1,733,968 · +7.9%
- By 2040
- 1,979,565 · +23.2%
- By 2050
- 2,203,427 · +37.1%
- By 2075
- 2,667,893 · +66.0%
- By 2100
- 2,891,558 · +79.9%
Race, ethnicity, and origin ACS 2023
- Neighborhood character
- Diverse neighborhood (Simpson 0.66)
- Race & ethnicity
- Black 48% Hispanic / Latino 28% Two or more races 18% White 17% Asian 1%
- Hispanic origin (detail)
- Mexican 6% Puerto Rican 8% Cuban 6% Dominican 1%
- Common ancestry
- Hispanic 2% Romanian 1% Lithuanian 1%
- Foreign-born
- 17% · Canada, Vietnam, Jamaica
- Languages at home
- 72% English-only · Spanish 24% French/Haitian/Cajun 3% Other Asian/Pacific 1%
Political lean MEDSL · Hillsborough
- 2024 margin
- Toss-up / Even · D 47.8% · R 50.9% · Other 1.3%
- 2008→2024 swing
- -10.2pp toward R · 2008: 7.1pp · 2024: -3.1pp
- All cycles
- 2024: R+3.1 2020: D+6.9 2016: D+6.8 2012: D+6.7 2008: D+7.1
Not yet ingested
- Civics
- —
Market trends
- HPI YoY
- ▲ 17.43%
- Current HPI
- 494.1871
- Rent YoY
- ▲ 0.58%
- Metro
- Tampa-St. Petersburg-Clearwater, FL
- State GDP YoY
- ▲ 3.28%
- F500 in state
- 36
Industry mix (Fortune 500 HQ in FL)
| Industry | F500 HQs | Revenue |
|---|---|---|
| Industrial Technology | 2 | $29B |
|
||
| Insurance | 2 | $17B |
|
||
| Retail | 1 | $60B |
|
||
| Technology Distribution | 1 | $58B |
|
||
| Homebuilding | 1 | $35B |
|
||
| Technology Manufacturing | 1 | $35B |
|
||
Price history
+37.9% since first listed7 events — show timeline
- 2026-05-21 Listed $199,900 Stellar MLS as Distributed by MLS Grid
- 2013-07-25 Sold (Public Records) $273,100 Public Records
- 2009-05-08 Sold (MLS) $35,000 Stellar MLS as Distributed by MLS Grid
- 2009-03-25 Listed $36,900 Stellar MLS as Distributed by MLS Grid
- 2007-12-18 Listed $169,000 Stellar MLS as Distributed by MLS Grid
- 2007-02-01 Listing Removed — Stellar MLS as Distributed by MLS Grid
- 2007-01-04 Listed $145,000 Stellar MLS as Distributed by MLS Grid
Property tax history
+11.0%/yrLatest (2025): $2,123 · +11.5% YoY. Source: county tax records.
Cash-flow waterfall
monthlySold comps — $/sqft
last 12 mo · ≤1 miLoading sold comps…