 Fourplex
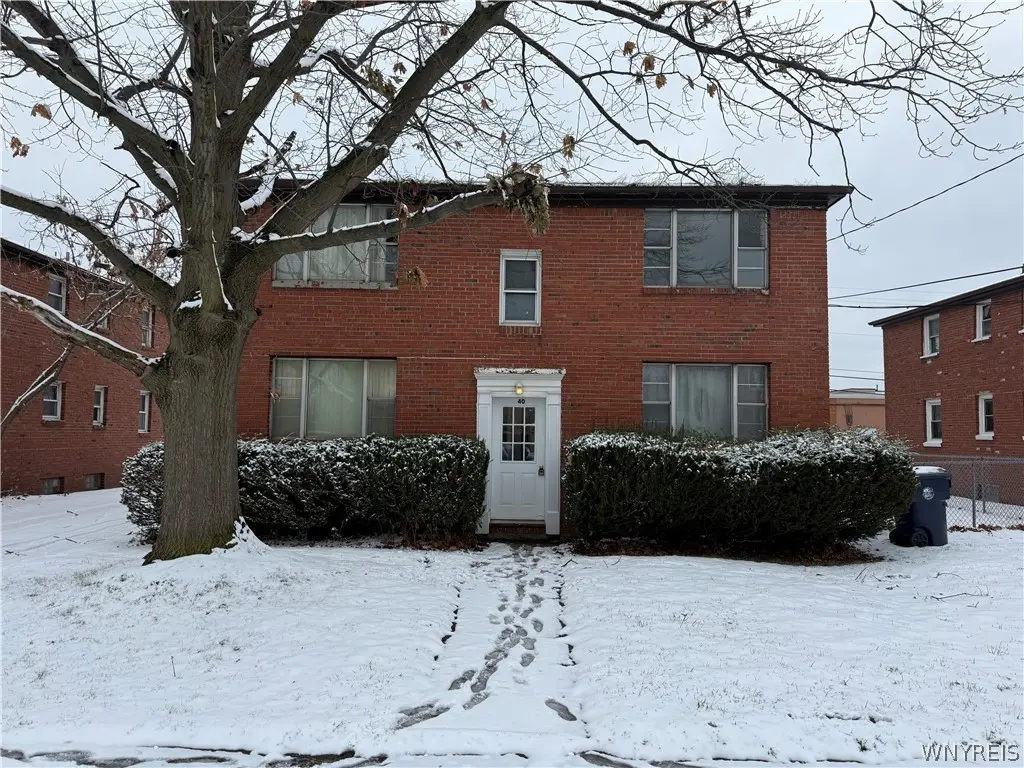
40 Eagan Dr · Lackawanna, NY
Flood risk 1/10 · Minimal
- FEMA flood zone
- X (unshaded)
- Chance of flooding over 30 yrs
- 0.0%
- Est. flood insurance / yr
- $473 – $860
Fire risk 1/10 · Minimal
- Est. fire insurance / yr
- $691 – $1,283
Heat risk 3/10 · Minor
- Hot days now (above 92°F)
- 7 days/yr
- Hot days in 30 yrs
- 17 days/yr
Wind risk 1/10 · Minimal
- Chance of severe wind over 30 yrs
- —
Air-quality risk 4/10 · Minor
- Unhealthy air days now
- 3 days/yr
- Unhealthy air days in 30 yrs
- 8 days/yr
Risk factors via First Street. Map © Google.
Why this score? — see what drove the B- grade
The composite is a weighted blend of 9 inputs, each scored 0–100. Each bar is that input's sub-score; the figure is the points it added to the 100-point composite (weight × sub-score).
- Cash flow +30.0/30.0
- 1% rule +10.0/10.0
- DSCR +10.0/10.0
- ARV discount +7.5/15.0
- Livability +3.8/5.0
- Rent growth +2.5/5.0
- Condition / age +2.2/5.0
- Schools +2.0/10.0
- Appreciation +0.0/10.0
$349,900
🖨 Deal sheet (PDF) 📄 Offer letter ✓ Due diligence
Multi-family units
County records classify this as Multi-Family (2-4 Unit). Listing-text estimate: 4 units. confirmed
Listing remarks
Great brick 4 unit in Lackawanna! Cash cow! Tenants are long term and great payers. One unit left vacant for showings. Open house Saturday 3/21/26 1pm-3pm. Offers due Sunday 3/22/26 at 5pm.
Key facts
- 6,600 sq ft lot
- 2 parking spots
- Built 1900
Neighborhood map
What this means for you Summary
Snapshot
- This is a 4 × 6-bed/4.0-bath units multifamily listed at $350k. Condition is rated fair.
Deal economics
- At list price, monthly cash flow is $2k ($29k/yr) — positive. Per door: $596/mo.
- The deal already cash-flows at list — no discount required.
- Meets the 1% rule at list price ($6k rent vs $350k).
- Cap rate 14.5% vs local median 5.4% in Lackawanna — top-decile yield for the area; either an underpriced asset or a hidden risk that comps aren't pricing in. Stress-test before assuming the spread holds.
Location & tenants
- Location reads 75/100 on livability (#254 in NY, #4,026 nationally) — a middle-class / working-renter tenant base. Strengths: commute A+, cost of living A+, housing A+; Watch: crime C-, employment D+, amenities F.
- Lackawanna City School District (suburban): math 19% / reading 29% proficiency, ranked #588 of 590 in NY (top 100%) — low school quality limits family demand, transient renter base, plan for 1-2y turnover; 71% free/reduced lunch — lower-income household profile, screen leases tightly.
- Zoned schools: Martin Road Elementary School (math 12% / reading 29%, grade F, #1,944 of 2,108 statewide, top 92%, 560 students, 86% FRL); Lackawanna Middle School (math 5% / reading 27%, grade F, #702 of 729 statewide, top 96%, 407 students, 80% FRL); Lackawanna High School (math 72%, 560 students, 71% FRL).
- Market conditions: 92 active listings in the ZIP; 1,244 units permitted in Erie County in 2024 (563 in 5+ unit buildings).
Forward outlook
- Local home prices are declining (-3.0%/yr); year-one equity from $2k of loan paydown is wiped out by about $10k of value loss. Plan a longer hold.
- At projected returns (-3.0% appreciation + 3.0% rent growth), your $98k cash investment doubles in ~5 years — after that, you're playing with house money.
Negotiation context
- Only 7 days on market — expect competitive offers; lowballing is unlikely to land.
Risks & watch-outs
- Watch-outs: built in 1900 — expect roof / HVAC / electrical / plumbing capex.
Questions for the listing agent
- Can we see the unit-by-unit rent roll, current vacancy, and any below-market leases? What's the average tenancy length?
- What capital expenditures (roof, boiler, parking lot, exteriors) have been made in the last 5 years, and what's planned in the next 2?
- Have any recent inspections been done? Can we get a copy of the seller's disclosures and any deferred-maintenance estimates?
- Built in 1900 — when were the roof, HVAC, electrical panel, plumbing, and water heater last replaced?
- Is there a deadline driving the sale (1031 exchange, divorce, estate, relocation)? That informs how much negotiation room exists.
- Schools are D-rated, which usually means shorter tenancies and higher turnover. Who's the typical renter profile here, and what's been the actual vacancy rate?
- What's the average days-on-market for RENTAL listings here right now (not sales)? A rising rental-DOM trend means longer vacancies and softer asking-rent achievability than the comps imply.
- What's the recent tenant-quality profile in this submarket — average credit score on applications, eviction rate, late-payment / NSF rate, and stable-employment percentage? A property-management company in the area should have these aggregated.
- How much new apartment / multifamily construction is in the pipeline within 1–3 miles? Heavy new supply (>2% of stock underway) typically softens rents 12–24 months out; light construction supports rent growth.
Investment metrics
- 1% rule
- 1.74% ✓
- Cap rate
- 14.48%
- Cash-on-cash
- 29.22%
- DSCR
- 2.30
- GRM
- 4.8
CMA / ARV
No comps found within radius.
Projected returns pro-forma
-3.0% appreciation · 3.0% rent growth · sell at horizon
- IRR
- 23.7%
- Equity multiple
- 1.97×
- Total profit
- $95,353
- Equity at exit
- $52,171
- IRR
- 31.6%
- Equity multiple
- 3.85×
- Total profit
- $279,077
- Equity at exit
- $30,253
Cash invested: $97,972 (down + closing). Projections, not guarantees.
Landlord ↔ Tenant lean methodology
- Overall (STATE)
- 15 Strongly Tenant-Friendly
- State New York
- 15 Strongly Tenant-Friendly · D+10
- County
- — inherits STATE
- City
- — inherits STATE
ZIP-level market 14218
- Home prices YoY
- -9.2%
- Active inventory
- 92
- Price-to-rent
- 19.2×
Monthly cashflow live
- Estimated rent
- $6,081 medium interval (Pro) →
- Mortgage (P&I)
- −$1,835
- Tax est. 1.5%
- −$437 /mo · $5,248/yr
- Insurance
- −$146
- HOA
- −$0
- Vacancy / Maint / Mgmt
- −$1,277
- Net cashflow
- $2,386
Break-even live
Sensitivity live
| Price | -10% $2,628 | -5% $2,507 | +0% $2,386 | +5% $2,265 | +10% $2,144 |
|---|---|---|---|---|---|
| Rent | -10% $1,906 | -5% $2,146 | +0% $2,386 | +5% $2,626 | +10% $2,866 |
| Rate | -1.0pp $2,562 | -0.5pp $2,475 | base $2,386 | +0.5pp $2,295 | +1.0pp $2,203 |
4-unit breakdown (identical units grouped — click to expand)
| Units | Beds | Baths | Est. rent |
|---|---|---|---|
| 4× units | 6 | 4 | $6,080 |
| #1 | 6 | 4 | $1,520 |
| #2 | 6 | 4 | $1,520 |
| #3 | 6 | 4 | $1,520 |
| #4 | 6 | 4 | $1,520 |
| Total (4 units) | $6,081 | ||
UW: 25.0% down · 7.5% · 30yr · 1.5% tax · 5.0% vac · 8.0% maint · 8.0% mgmt
Financing live
Cash to close
- Down payment
- $87,475
- Closing costs
- $10,497
- Reserves months
- —
- Total cash needed
- —
Loan-product check · same deal, 3 products live
Conventional
25% down · 7.5% · 30yr
- Down + closing
- —
- Monthly P&I
- —
- Monthly cashflow
- —
- DSCR
- —
- Eligible?
- —
Personal DTI + credit; lowest rate.
DSCR
20% down · 8.5% · 30yr
- Down + closing
- —
- Monthly P&I
- —
- Monthly cashflow
- —
- DSCR
- —
- Eligible?
- —
No personal income docs; deal must DSCR.
Hard money
10% down · 12.0% · 12mo
- Down + closing
- —
- Monthly P&I
- —
- Monthly cashflow
- —
- DSCR
- —
- Eligible?
- —
Short-term bridge; refi at stabilization.
Listing history 2 events
-
2026-03-23status Pending
-
2026-03-16$349,900 Active
ⓘ Source: listings_history table (triggers on properties + properties_extension) + one-shot
backfill from property_details.listing_events for pre-trigger history.
Climate risk First Street
- Flood 1/10 Low FEMA zone X (unshaded) · 0% chance over 30 yrs
- Wildfire 1/10 Low
- Heat 3/10 Moderate 7 d/yr ≥92°F today · 17 d/yr by 30 yrs out
- Wind 1/10 Low
- Air quality 4/10 Moderate 3 unhealthy d/yr today · 8 by 30 yrs out
Nearby sold comps map
Loading sold comps map…
Walkable amenities ~0.75 mi
Loading nearby amenities…
Taxation est. · year 1
- Rental income
- $72,972
- − Mortgage interest
- −$19,600
- − Property taxes
- −$5,248
- − Insurance
- −$1,750
- − Repairs & maintenance
- −$5,838
- − Management
- −$5,838
- − Depreciation
- −$10,179
- Taxable income
- $24,520
- Est. tax owed @ 24.0%
- −$5,885
- After-tax cash flow
- $22,746/yr
For passive investors: Depreciation is non-cash, so a rental often shows a tax loss while cash-flowing — sheltering income. Rental losses are passive: they offset passive income freely, and up to $25,000/yr can offset ordinary (W-2) income if you actively participate and your MAGI is under $100k (phasing out to $0 by $150k); unused losses carry forward. On sale, claimed depreciation is recaptured at up to 25%, and gains may owe capital-gains tax (a 1031 exchange can defer both). Figures are a year-1 estimate at your 24.0% rate — not tax advice; consult a CPA.
Condition & rehab AI · 1 photo
A fair condition 4-unit property in Lackawanna with moderate rehab needs, primarily focusing on exterior paint and landscaping.
Repairs flagged
- Minor exterior paint — Brick facade appears weathered
- Minor landscaping — Snow-covered yard and bushes
Value-add opportunities
- Both landscaping and exterior paint — Enhances curb appeal and property value
- Rental HVAC maintenance — Improves tenant satisfaction and reduces utility costs
Renovation cost estimate screening
| Repair item | Severity | Est. cost |
|---|---|---|
| exterior paint · Brick facade appears weathered | Minor | $500–3,000 |
| landscaping · Snow-covered yard and bushes | Minor | $500–3,000 |
| Total estimated repair cost · 2 items | $1,000–6,000 |
Value-add ROI direction
- Both landscaping and exterior paint — Enhances curb appeal and property value ↑
- Rental HVAC maintenance — Improves tenant satisfaction and reduces utility costs ↑
ⓘ Cost ranges are severity-bucket heuristics (US national rule-of-thumb). Get contractor quotes + a written scope before underwriting a rehab budget.
Schools (NCES district)
- District
- Lackawanna City School District
- NCES district ID
- 3616440
- Math proficiency
- 19% ▼ -10.00%
- Reading proficiency
- 29% ▲ 3.00%
- Median HH income
- $35,041
- Composite
- 19.76/100
- National rank
- #8708
- State rank
- #588 of 590 in NY
Livability — Lackawanna
- Score
- 75/100
- State rank
- #254
- US rank
- #4026
Category grades
Schools grade is shown separately in the Schools card above.
Census & demographics
- Census place
- Lackawanna, NY
- City population
- 20,661
- Population (ZIP)
- 20,661
Population outlook (Erie County) Hauer SSP2
- Today (2025)
- 933,037 people
- By 2030
- 935,181 · +0.2%
- By 2040
- 928,531 · -0.5%
- By 2050
- 905,725 · -2.9%
- By 2075
- 834,037 · -10.6%
- By 2100
- 708,033 · -24.1%
Race, ethnicity, and origin ACS 2023
- Neighborhood character
- Predominantly White (73%)
- Race & ethnicity
- White 73% Black 13% Hispanic / Latino 10% Two or more races 5%
- Hispanic origin (detail)
- Puerto Rican 8%
- Common ancestry
- Romanian 18% Lithuanian 2% Slovak 1%
- Foreign-born
- 7% · Canada
- Languages at home
- 80% English-only · Arabic 11% Spanish 6% Russian/Polish/Slavic 1%
Political lean MEDSL · Erie
- 2024 margin
- Lean D (+9.7) · D 54.8% · R 45.2%
- 2008→2024 swing
- -7.9pp toward R · 2008: 17.5pp · 2024: 9.7pp
- All cycles
- 2024: D+9.7 2020: D+14.7 2016: D+4.8 2012: D+15.6 2008: D+17.5
Not yet ingested
- Civics
- —
Market trends
- HPI YoY
- ▼ -39.44%
- Current HPI
- 389.0188
- Rent YoY
- —
- Metro
- —
- State GDP YoY
- ▲ 2.60%
- F500 in state
- 92
Industry mix (Fortune 500 HQ in NY)
| Industry | F500 HQs | Revenue |
|---|---|---|
| Financial Services | 10 | $950B |
|
||
| Consumer Goods | 9 | $162B |
|
||
| Insurance | 4 | $225B |
|
||
| Telecommunications | 2 | $144B |
|
||
| Pharmaceuticals | 2 | $112B |
|
||
| Media / Entertainment | 2 | $69B |
|
||
Price history
2 events — show timeline
- 2026-03-23 Pending — WNYREIS
- 2026-03-16 Listed $349,900 WNYREIS
Cash-flow waterfall
monthlySold comps — $/sqft
last 12 mo · ≤1 miLoading sold comps…