 🏗️ New Construction
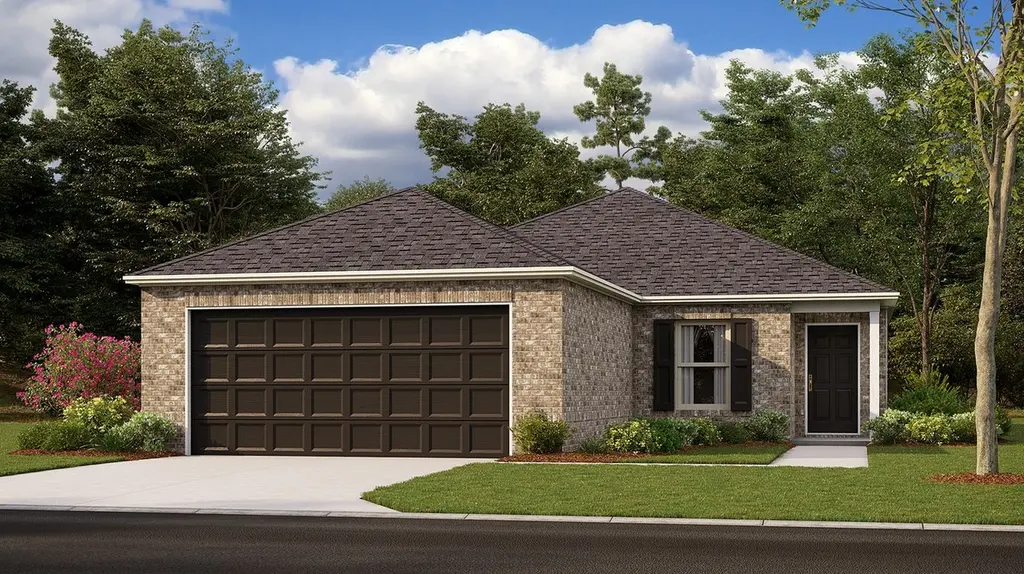
Rc Bridgeport Plan · Jonesboro, AR
Flood risk 1/10 · Minimal
- FEMA flood zone
- X
- Chance of flooding over 30 yrs
- 0.0%
- Est. flood insurance / yr
- $507 – $1,088
Fire risk 3/10 · Minor
- Est. fire insurance / yr
- $1,499 – $2,785
Heat risk 5/10 · Moderate
- Hot days now (above 109°F)
- 7 days/yr
- Hot days in 30 yrs
- 20 days/yr
Wind risk 4/10 · Minor
- Chance of severe wind over 30 yrs
- 10.0%
Air-quality risk 2/10 · Minimal
- Unhealthy air days now
- 0 days/yr
- Unhealthy air days in 30 yrs
- 2 days/yr
Risk factors via First Street. Map © Google.
Why this score? — see what drove the D+ grade
The composite is a weighted blend of 9 inputs, each scored 0–100. Each bar is that input's sub-score; the figure is the points it added to the 100-point composite (weight × sub-score).
- Cash flow +15.0/30.0
- ARV discount +7.5/15.0
- Schools +5.2/10.0
- DSCR +4.6/10.0
- 1% rule +4.1/10.0
- Condition / age +4.0/5.0
- Livability +3.2/5.0
- Rent growth +2.7/5.0
- Appreciation +0.0/10.0
$226,900
🖨 Deal sheet (PDF) 📄 Offer letter ✓ Due diligence
Listing remarks MLS
This new single-story home is designed to provide ample room to grow and entertain. Off the entry is a hallway leading to three versatile bedrooms centered around a convenient full-sized bathroom. At the back is a cohesive open layout shared between the spacious living room, intimate dining room and well-equipped kitchen. The owner's suite is a peaceful retreat with an attached bathroom and walk-in closet.
Key facts
- Living room
- Open layout
- Dining room
Tags
Neighborhood map
What this means for you Summary
Snapshot
- This is a 4-bed/2.0-bath single-family listed at $227k. Condition is rated good.
Deal economics
- At list price, monthly cash flow is $68 ($816/yr) — positive.
- The deal already cash-flows at list — no discount required.
- To meet the 1% rule (rent ≥ 1% of price), the offer needs to be $202k (11.0% below list).
- Recommended offer: $200k (12.0% below list) — sets the bar for market timing.
- Cap rate 6.7% vs local median 4.4% in Jonesboro — top-decile yield for the area; either an underpriced asset or a hidden risk that comps aren't pricing in. Stress-test before assuming the spread holds.
Location & tenants
- Location reads 65/100 on livability (#145 in AR) — a middle-class / working-renter tenant base. Strengths: cost of living A+, housing A+, health & safety A+; Watch: crime F, amenities F, commute F.
- Valley View School District (rural): math 55% / reading 60% proficiency, ranked #4 of 238 in AR (top 2%) — acceptable for families but not a draw, mixed tenant base, ~2y average lease; only 19% free/reduced lunch — higher-income household profile.
- Zoned schools: Valley View Intermediate School (math 61% / reading 58%, grade B-, #38 of 454 statewide, top 9%, 893 students, 30% FRL); Valley View Junior High School (math 54% / reading 65%, grade B, #12 of 201 statewide, top 6%, 712 students, 25% FRL); Valley View High School (math 32% / reading 52%, grade F, #38 of 292 statewide, top 14%, 631 students, 22% FRL).
- Market conditions: Rents flat; 309 active listings in the ZIP; 2 comparable units currently listed for rent nearby; 926 units permitted in Craighead County in 2024 (69 in 5+ unit buildings).
- This rent runs 34% of the median local income ($70k/yr) — at the standard rent-burdened threshold; future hikes will face affordability resistance.
Forward outlook
- Local home prices are declining (-3.0%/yr); year-one equity from $2k of loan paydown is wiped out by about $7k of value loss. Plan a longer hold.
- Craighead County population projected at +38% by 2050 — long-run rental-demand tailwind backs the buy-and-hold thesis.
Negotiation context
- It's been on market 125 days — a 12% lower offer ($200k) is reasonable based on typical stale-listing flexibility.
Risks & watch-outs
- Climate carrying-cost: extreme-heat days projected 7→20/yr by 2055 (HVAC capex compounding) — expect insurance premiums to compound above CPI over the hold.
Questions for the listing agent
- It's been on market 125 days. Have you received any prior offers? Is the seller open to a 12% concession, seller financing, or rate buy-down credit?
- Why hasn't it sold? Are there any deal-killer items the seller is aware of (foundation, flood, title, zoning, code violations)?
- Is there a deadline driving the sale (1031 exchange, divorce, estate, relocation)? That informs how much negotiation room exists.
- Schools are D-rated, which usually means shorter tenancies and higher turnover. Who's the typical renter profile here, and what's been the actual vacancy rate?
- Crime grade is F in this area — have there been break-ins, vandalism, or insurance claims at this property in the last 3 years? What carrier currently insures it and at what premium?
- The area grade is low — what's the realistic commute time and amenity access for the typical tenant pool here? Any planned neighborhood developments (good or bad) we should know about?
- What's the average days-on-market for RENTAL listings here right now (not sales)? A rising rental-DOM trend means longer vacancies and softer asking-rent achievability than the comps imply.
- What's the recent tenant-quality profile in this submarket — average credit score on applications, eviction rate, late-payment / NSF rate, and stable-employment percentage? A property-management company in the area should have these aggregated.
- How much new for-sale + rental construction is in the pipeline within 1–3 miles? Heavy new supply typically softens prices + rents 12–24 months out; constrained supply supports both.
Investment metrics
- 1% rule
- 0.91% ✗
- Cap rate
- 6.66%
- Cash-on-cash
- 1.32%
- DSCR
- 1.06
- GRM
- 9.1
CMA / ARV
- ARV (median comp)
- $220,900
- List price
- $226,900
- Delta
- 2.72%
- Verdict
- FAIR
- Comps
- 20 within 1.0 mi
Show comp detail 12 sales within ~0.75 mi
| Address | Dist | Beds/Ba | Sqft | Sold | Price | $/sf | Match |
|---|---|---|---|---|---|---|---|
| 5249 Orchard Pass Pass | 0.02mi | 4/2.0 | 1,496 (0%) | 1mo | $219,900 | $147 | 98 |
| 5245 Orchard Pass Pass | 0.02mi | 3/2.0 (-1) | 1,523 (+2%) | 1mo | $220,900 | $145 | 90 |
| 6005 Beaver Creek Ln | 0.25mi | 3/2.0 (-1) | 1,508 (+1%) | 0mo | $242,500 | $161 | 82 |
| 5300 Orchard Pass Pass | 0.03mi | 4/2.0 | 1,640 (+10%) | 1mo | $235,900 | $144 | 82 |
| 5246 Orchard Pass | 0.03mi | 4/2.0 | 1,640 (+10%) | 2mo | $226,500 | $138 | 81 |
| 5317 Orchard Pass Pass | 0.02mi | 3/2.0 (-1) | 1,355 (-9%) | 0mo | $220,900 | $163 | 78 |
| 5241 Orchard Pass Pass | 0.02mi | 3/2.0 (-1) | 1,355 (-9%) | 1mo | $212,000 | $156 | 77 |
| 5304 Orchard Pass Pass | 0.03mi | 3/2.0 (-1) | 1,355 (-9%) | 1mo | $214,900 | $159 | 77 |
| 5238 Orchard Pass Pass | 0.03mi | 3/2.0 (-1) | 1,355 (-9%) | 1mo | $216,900 | $160 | 77 |
| 3624 Leafy Pass | 0.17mi | 3/2.0 (-1) | 1,595 (+7%) | 1mo | $228,000 | $143 | 75 |
| 5313 Orchard Pass Pass | 0.02mi | 3/2.0 (-1) | 1,288 (-14%) | 0mo | $215,900 | $168 | 71 |
| 5237 Orchard Pass Pass | 0.02mi | 3/2.0 (-1) | 1,288 (-14%) | 1mo | $208,100 | $162 | 70 |
Match score weights: distance 35% · size 25% · config 20% · recency 20%. Top-matched comps best support the ARV.
Projected returns pro-forma
-3.0% appreciation · 0.74% rent growth · sell at horizon
- IRR
- -16.8%
- Equity multiple
- 0.42×
- Total profit
- $-35,923
- Equity at exit
- $32,937
- IRR
- -13.3%
- Equity multiple
- 0.30×
- Total profit
- $-43,184
- Equity at exit
- $19,099
Cash invested: $61,852 (down + closing). Projections, not guarantees.
Landlord ↔ Tenant lean methodology
- Overall (STATE)
- 92 Strongly Landlord-Friendly
- State Arkansas
- 92 Strongly Landlord-Friendly · R+14
- County
- — inherits STATE
- City
- — inherits STATE
ZIP-level market 72404
- Home prices YoY
- -14.5%
- Rents YoY
- 0.7%
- Active inventory
- 309
- Price-to-rent
- 9.4×
Monthly cashflow live
- Estimated rent
- $2,018 medium interval (Pro) →
- Mortgage (P&I)
- −$1,158
- Tax est. 1.5%
- −$276 /mo · $3,314/yr
- Insurance
- −$92
- HOA
- −$0
- Vacancy / Maint / Mgmt
- −$424
- Net cashflow
- $68
Break-even live
Sensitivity live
| Price | -10% $221 | -5% $144 | +0% $68 | +5% $-8 | +10% $-85 |
|---|---|---|---|---|---|
| Rent | -10% $-91 | -5% $-12 | +0% $68 | +5% $148 | +10% $227 |
| Rate | -1.0pp $179 | -0.5pp $124 | base $68 | +0.5pp $11 | +1.0pp $-47 |
UW: 25.0% down · 7.5% · 30yr · 1.5% tax · 5.0% vac · 8.0% maint · 8.0% mgmt
Financing live
Cash to close
- Down payment
- $55,225
- Closing costs
- $6,627
- Reserves months
- —
- Total cash needed
- —
Loan-product check · same deal, 3 products live
Conventional
25% down · 7.5% · 30yr
- Down + closing
- —
- Monthly P&I
- —
- Monthly cashflow
- —
- DSCR
- —
- Eligible?
- —
Personal DTI + credit; lowest rate.
DSCR
20% down · 8.5% · 30yr
- Down + closing
- —
- Monthly P&I
- —
- Monthly cashflow
- —
- DSCR
- —
- Eligible?
- —
No personal income docs; deal must DSCR.
Hard money
10% down · 12.0% · 12mo
- Down + closing
- —
- Monthly P&I
- —
- Monthly cashflow
- —
- DSCR
- —
- Eligible?
- —
Short-term bridge; refi at stabilization.
Rent comps 2 comps
| Address | Beds | Baths | Sqft | Rent | $/sqft | DOM | Units | Dist |
|---|---|---|---|---|---|---|---|---|
| 5242 Orchard Pass Jonesboro, AR | 4.0 | 1.0 | 1500 | $1,700 | $1.13 | 45d | 1 | 0.03mi |
| 3632 Leafy Pass Jonesboro, AR | 3.0 | 2.0 | 1662 | $1,750 | $1.05 | 45d | 1 | 0.14mi |
Listing history 20 events
-
2026-06-21days on market $226,900 Active 125 DOM
-
2026-06-19days on market $226,900 Active 123 DOM
-
2026-06-18days on market $226,900 Active 122 DOM
-
2026-06-17days on market $226,900 Active 121 DOM
-
2026-06-16days on market $226,900 Active 120 DOM
-
2026-06-15days on market $226,900 Active 119 DOM
-
2026-06-14days on market $226,900 Active 117 DOM
-
2026-06-13days on market $226,900 Active 116 DOM
-
2026-06-10days on market $226,900 Active 114 DOM
-
2026-06-09days on market $226,900 Active 113 DOM
-
2026-06-08days on market $226,900 Active 112 DOM
-
2026-06-07days on market $226,900 Active 111 DOM
-
2026-06-05days on market $226,900 Active 108 DOM
-
2026-06-03days on market $226,900 Active 107 DOM
-
2026-06-02days on market $226,900 Active 106 DOM
-
2026-06-01days on market $226,900 Active 105 DOM
-
2026-05-31days on market $226,900 Active 104 DOM
-
2026-05-30days on market $226,900 Active 103 DOM
-
2026-02-28price $226,900 409-char remark
Show marketing remark (409 chars)
This new single-story home is designed to provide ample room to grow and entertain. Off the entry is a hallway leading to three versatile bedrooms centered around a convenient full-sized bathroom. At the back is a cohesive open layout shared between the spacious living room, intimate dining room and well-equipped kitchen. The owner's suite is a peaceful retreat with an attached bathroom and walk-in closet.
-
2026-02-16$231,900 Active 409-char remark
Show marketing remark (409 chars)
This new single-story home is designed to provide ample room to grow and entertain. Off the entry is a hallway leading to three versatile bedrooms centered around a convenient full-sized bathroom. At the back is a cohesive open layout shared between the spacious living room, intimate dining room and well-equipped kitchen. The owner's suite is a peaceful retreat with an attached bathroom and walk-in closet.
ⓘ Source: listings_history table (triggers on properties + properties_extension) + one-shot
backfill from property_details.listing_events for pre-trigger history.
Climate risk First Street
- Flood 1/10 Low FEMA zone X · 0% chance over 30 yrs
- Wildfire 3/10 Moderate
- Heat 5/10 Major 7 d/yr ≥109°F today · 20 d/yr by 30 yrs out
- Wind 4/10 Moderate 10% chance of damaging wind over 30 yrs
- Air quality 2/10 Low 0 unhealthy d/yr today · 2 by 30 yrs out
Nearby sold comps map
Loading sold comps map…
Walkable amenities ~0.75 mi
Loading nearby amenities…
Taxation est. · year 1
- Rental income
- $24,222
- − Mortgage interest
- −$12,374
- − Property taxes
- −$3,314
- − Insurance
- −$1,104
- − Repairs & maintenance
- −$1,938
- − Management
- −$1,938
- − Depreciation
- −$6,426
- Taxable loss
- −$2,872
- Est. tax savings @ 24.0%
- +$689
- After-tax cash flow
- $1,505/yr
For passive investors: Depreciation is non-cash, so a rental often shows a tax loss while cash-flowing — sheltering income. Rental losses are passive: they offset passive income freely, and up to $25,000/yr can offset ordinary (W-2) income if you actively participate and your MAGI is under $100k (phasing out to $0 by $150k); unused losses carry forward. On sale, claimed depreciation is recaptured at up to 25%, and gains may owe capital-gains tax (a 1031 exchange can defer both). Figures are a year-1 estimate at your 24.0% rate — not tax advice; consult a CPA.
Condition & rehab AI · 3 photos
This single-story home is in good condition with a modern design and ample space. It is move-in ready with minimal maintenance required.
Value-add opportunities
- Both Painting the exterior and interior walls — Fresh paint can enhance curb appeal and interior aesthetics.
- Both Landscaping improvements — Enhanced landscaping can boost curb appeal and attract potential buyers/tenants.
- Both Add smart home features — Smart home features can increase both resale and rental value by making the home more modern and convenient.
Renovation cost estimate screening
Value-add ROI direction
- Both Painting the exterior and interior walls — Fresh paint can enhance curb appeal and interior aesthetics. ↑
- Both Landscaping improvements — Enhanced landscaping can boost curb appeal and attract potential buyers/tenants. ↑
- Both Add smart home features — Smart home features can increase both resale and rental value by making the home more modern and convenient. ↑
ⓘ Cost ranges are severity-bucket heuristics (US national rule-of-thumb). Get contractor quotes + a written scope before underwriting a rehab budget.
Schools (NCES district)
- District
- Valley View School District
- NCES district ID
- 0513380
- Math proficiency
- 55% ▼ -11.00%
- Reading proficiency
- 60% ▼ -10.00%
- Median HH income
- $79,148
- Composite
- 51.78/100
- National rank
- #1672
- State rank
- #4 of 238 in AR
Livability — Jonesboro
- Score
- 65/100
- State rank
- #145
- US rank
- #12692
Category grades
Schools grade is shown separately in the Schools card above.
Census & demographics
- Census place
- Jonesboro, AR
- County
- Craighead County · 97,185 people
- City population
- 91,245
- Metro
- Jonesboro, AR
- Population (ZIP)
- 29,968
- Household income
- $70,269
- Rent vs Own
- Severe rent burden
- 869.0
Population outlook (Craighead County) Hauer SSP2
- Today (2025)
- 122,235 people
- By 2030
- 131,338 · +7.4%
- By 2040
- 149,862 · +22.6%
- By 2050
- 168,034 · +37.5%
- By 2075
- 208,094 · +70.2%
- By 2100
- 233,251 · +90.8%
Race, ethnicity, and origin ACS 2023
- Neighborhood character
- Predominantly White (72%)
- Race & ethnicity
- White 72% Black 18% Two or more races 5% Hispanic / Latino 4% Asian 2%
- Common ancestry
- Slovak 3% Lithuanian 1% Italian 1%
- Foreign-born
- 5% · Canada, China, South Korea
- Languages at home
- 95% English-only · Spanish 3% Chinese 1%
Political lean MEDSL · Craighead
- 2024 margin
- Solid R (+37.4) · D 30.1% · R 67.5% · Other 2.4%
- 2008→2024 swing
- -12.9pp toward R · 2008: -24.5pp · 2024: -37.4pp
- All cycles
- 2024: R+37.4 2020: R+35.4 2016: R+35.2 2012: R+31.1 2008: R+24.5
Not yet ingested
- Civics
- —
Market trends
- HPI YoY
- ▼ -35.22%
- Current HPI
- 208.3772
- Rent YoY
- ▲ 0.74%
- Metro
- Jonesboro, AR
- State GDP YoY
- ▲ 3.80%
- F500 in state
- 10
Industry mix (Fortune 500 HQ in AR)
| Industry | F500 HQs | Revenue |
|---|---|---|
| Retail | 1 | $681B |
|
||
| Food / Agriculture | 1 | $53B |
|
||
| Retail / Energy | 1 | $22B |
|
||
| Transportation / Logistics | 1 | $12B |
|
||
| Energy | 1 | $4B |
|
||
Price history
-2.2% since first listed2 events — show timeline
- 2026-02-28 Price Changed $226,900 Zillow
- 2026-02-16 Listed $231,900 Zillow
Cash-flow waterfall
monthlySold comps — $/sqft
last 12 mo · ≤1 miLoading sold comps…