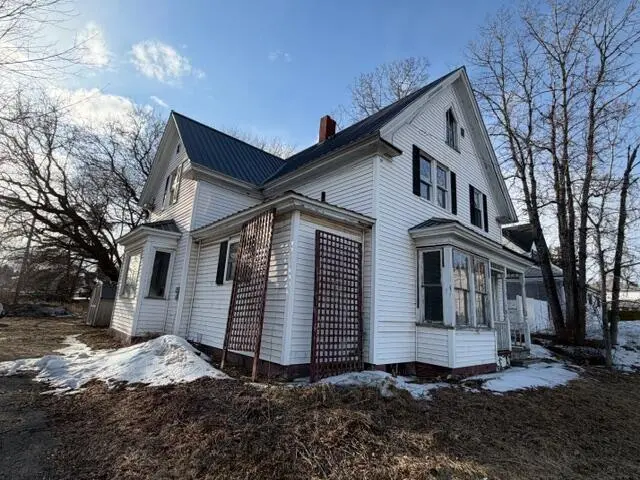
43 Washburn St · Caribou, ME
Flood risk 1/10 · Minimal
- FEMA flood zone
- X
- Chance of flooding over 30 yrs
- 0.0%
- Est. flood insurance / yr
- $507 – $1,088
Fire risk 1/10 · Minimal
- Est. fire insurance / yr
- $669 – $1,243
Heat risk 2/10 · Minimal
- Hot days now (above 87°F)
- 7 days/yr
- Hot days in 30 yrs
- 15 days/yr
Wind risk 4/10 · Minor
- Chance of severe wind over 30 yrs
- 10.0%
Air-quality risk 1/10 · Minimal
- Unhealthy air days now
- 0 days/yr
- Unhealthy air days in 30 yrs
- 0 days/yr
Risk factors via First Street. Map © Google.
Why this score? — see what drove the B grade
The composite is a weighted blend of 9 inputs, each scored 0–100. Each bar is that input's sub-score; the figure is the points it added to the 100-point composite (weight × sub-score).
- Cash flow +30.0/30.0
- 1% rule +10.0/10.0
- DSCR +10.0/10.0
- ARV discount +7.5/15.0
- Schools +6.9/10.0
- Livability +3.7/5.0
- Rent growth +2.5/5.0
- Condition / age +2.5/5.0
- Appreciation +0.0/10.0
$55,000
🖨 Deal sheet 📄 Offer letter ✓ Due diligence
Listing remarks MLS
Downtown Caribou fixer-upper on a generous . 32-acre lot -- an ideal canvas for investors or DIY homeowners. Classic charm waiting for modernization; walkable location close to shops, restaurants, and community amenities. Bring your vision and make this centrally located property your next rewarding project. All bids must be submitted at vrmproperties. Agents must register as a User, enter the property address, and click on ''Start Bid''. This property may qualify for Seller Financing (Vendee). If property was built prior to 1978, Lead Based Paint Potentially Exists.
Key facts
- Generous lot
- Walkable location
- 0.32 acre lot
Tags
Neighborhood map
What this means for you Summary
Snapshot
- This is a 3-bed/2.0-bath single-family listed at $55k.
Deal economics
- At list price, monthly cash flow is $468 ($6k/yr) — positive.
- The deal already cash-flows at list — no discount required.
- Meets the 1% rule at list price ($1k rent vs $55k).
- Recommended offer: $52k (6.0% below list) — sets the bar for market timing.
- Cap rate 16.5% vs local median 3.6% in Caribou — top-decile yield for the area; either an underpriced asset or a hidden risk that comps aren't pricing in. Stress-test before assuming the spread holds.
Location & tenants
- Location reads 74/100 on livability (#46 in ME, #4,849 nationally) — a middle-class / working-renter tenant base. Strengths: cost of living A+, housing A+, health & safety A+; Watch: employment D+, schools D, amenities F.
- RSU 39 (town): math 82% / reading 83% proficiency, ranked #79 of 112 in ME (top 70%) — strong family-tenant draw, lease renewals of 3-5y typical.
- Market conditions: 83 active listings in the ZIP; 112 units permitted in Aroostook County in 2024 (45 in 5+ unit buildings).
Forward outlook
- Local home prices are declining (-3.0%/yr); year-one equity from $380 of loan paydown is wiped out by about $2k of value loss. Plan a longer hold.
- Aroostook County population projected at -33% by 2050 — secular population decline; favor cash flow + early exit over multi-decade hold.
- At projected returns (-3.0% appreciation + 3.0% rent growth), your $15k cash investment doubles in ~4 years — after that, you're playing with house money.
Negotiation context
- It's been on market 73 days — a 6% lower offer ($52k) is reasonable based on typical stale-listing flexibility.
Risks & watch-outs
- Watch-outs: built in 1920 — expect roof / HVAC / electrical / plumbing capex.
Questions for the listing agent
- It's been on market 73 days. Have you received any prior offers? Is the seller open to a 6% concession, seller financing, or rate buy-down credit?
- Built in 1920 — when were the roof, HVAC, electrical panel, plumbing, and water heater last replaced?
- Why hasn't it sold? Are there any deal-killer items the seller is aware of (foundation, flood, title, zoning, code violations)?
- Is there a deadline driving the sale (1031 exchange, divorce, estate, relocation)? That informs how much negotiation room exists.
- Schools are D-rated, which usually means shorter tenancies and higher turnover. Who's the typical renter profile here, and what's been the actual vacancy rate?
- What's the average days-on-market for RENTAL listings here right now (not sales)? A rising rental-DOM trend means longer vacancies and softer asking-rent achievability than the comps imply.
- What's the recent tenant-quality profile in this submarket — average credit score on applications, eviction rate, late-payment / NSF rate, and stable-employment percentage? A property-management company in the area should have these aggregated.
- How much new for-sale + rental construction is in the pipeline within 1–3 miles? Heavy new supply typically softens prices + rents 12–24 months out; constrained supply supports both.
Investment metrics
- 1% rule
- 1.95% ✓
- Cap rate
- 16.50%
- Cash-on-cash
- 36.46%
- DSCR
- 2.62
- GRM
- 4.3
CMA / ARV
- ARV (median comp)
- $130,839
- List price
- $55,000
- Delta
- -57.96%
- Verdict
- UNDERPRICED
- Comps
- 20 within 1.0 mi
Show comp detail 12 sales within ~0.75 mi
| Address | Dist | Beds/Ba | Sqft | Sold | Price | $/sf | Match |
|---|---|---|---|---|---|---|---|
| 18 Park St | 0.27mi | 3/1.5 | 1,176 (+3%) | 3mo | $168,000 | $143 | 79 |
| 33 Coolidge Ave | 0.41mi | 2/1.5 (-1) | 1,100 (-4%) | 1mo | $189,900 | $173 | 66 |
| 39 Park St | 0.31mi | 3/2.0 | 1,296 (+13%) | 9mo | $120,000 | $93 | 56 |
| 7 Liberty St | 0.49mi | 3/1.0 | 1,078 (-6%) | 14mo | $165,000 | $153 | 52 |
| 33 Elmwood Ave | 0.51mi | 3/1.0 | 1,272 (+11%) | 3mo | $174,900 | $138 | 51 |
| 80 Garden Cir | 0.71mi | 3/1.0 | 1,092 (-4%) | 10mo | $205,000 | $188 | 47 |
| 13 Elizabeth Ave | 0.35mi | 4/1.0 (+1) | 1,277 (+12%) | 10mo | $179,900 | $141 | 47 |
| 88 Glenn St | 0.56mi | 2/1.0 (-1) | 1,040 (-9%) | 6mo | $135,000 | $130 | 44 |
| 10 Laurette Cir | 0.63mi | 4/1.0 (+1) | 1,248 (+9%) | 6mo | $178,400 | $143 | 41 |
| 34 Spring St | 0.61mi | 3/1.0 | 992 (-13%) | 6mo | $110,000 | $111 | 40 |
| 44 Garden Cir | 0.69mi | 3/1.0 | 1,296 (+13%) | 3mo | $185,000 | $143 | 40 |
| 27 Hillcrest Ave | 0.70mi | 4/1.0 (+1) | 1,036 (-9%) | 15mo | $118,500 | $114 | 30 |
Match score weights: distance 35% · size 25% · config 20% · recency 20%. Top-matched comps best support the ARV.
Projected returns pro-forma
-3.0% appreciation · 3.0% rent growth · sell at horizon
- IRR
- 32.3%
- Equity multiple
- 2.36×
- Total profit
- $20,905
- Equity at exit
- $8,201
- IRR
- 39.3%
- Equity multiple
- 4.68×
- Total profit
- $56,643
- Equity at exit
- $4,755
Cash invested: $15,400 (down + closing). Projections, not guarantees.
Landlord ↔ Tenant lean methodology
- Overall (STATE)
- 41 Moderately Tenant-Leaning
- State Maine
- 41 Moderately Tenant-Leaning · D+2
- County
- — inherits STATE
- City
- — inherits STATE
ZIP-level market 04736
- Home prices YoY
- -18.6%
- Active inventory
- 83
- Price-to-rent
- 4.3×
Monthly cashflow live
- Estimated rent
- $1,073 medium interval (Pro) →
- Mortgage (P&I)
- −$288
- Tax est. 1.5%
- −$69 /mo · $825/yr
- Insurance
- −$23
- HOA
- −$0
- Vacancy / Maint / Mgmt
- −$225
- Net cashflow
- $468
Break-even live
UW: 25.0% down · 7.5% · 30yr · 1.5% tax · 5.0% vac · 8.0% maint · 8.0% mgmt
Financing live
Cash to close
- Down payment
- $13,750
- Closing costs
- $1,650
- Reserves months
- —
- Total cash needed
- —
Loan-product check · same deal, 3 products live
Conventional
25% down · 7.5% · 30yr
- Down + closing
- —
- Monthly P&I
- —
- Monthly cashflow
- —
- DSCR
- —
- Eligible?
- —
Personal DTI + credit; lowest rate.
DSCR
20% down · 8.5% · 30yr
- Down + closing
- —
- Monthly P&I
- —
- Monthly cashflow
- —
- DSCR
- —
- Eligible?
- —
No personal income docs; deal must DSCR.
Hard money
10% down · 12.0% · 12mo
- Down + closing
- —
- Monthly P&I
- —
- Monthly cashflow
- —
- DSCR
- —
- Eligible?
- —
Short-term bridge; refi at stabilization.
Listing history 17 events
-
2026-06-18days on market $55,000 Active 73 DOM
-
2026-06-17days on market $55,000 Active 72 DOM
-
2026-06-16days on market $55,000 Active 71 DOM
-
2026-06-15days on market $55,000 Active 70 DOM
-
2026-06-13days on market $55,000 Active 68 DOM
-
2026-06-12pricedays on market $55,000 Active 67 DOM
-
2026-06-09days on market $60,000 Active 64 DOM
-
2026-06-08days on market $60,000 Active 63 DOM
-
2026-06-07days on market $60,000 Active 62 DOM
-
2026-06-07days on market $60,000 Active 61 DOM
-
2026-06-04days on market $60,000 Active 58 DOM
-
2026-06-02days on market $60,000 Active 57 DOM
-
2026-06-01days on market $60,000 Active 56 DOM
-
2026-05-31days on market $60,000 Active 55 DOM
-
2026-05-31days on market $60,000 Active 54 DOM
-
2026-05-12price $60,000 573-char remark
Show marketing remark (573 chars)
Downtown Caribou fixer-upper on a generous . 32-acre lot -- an ideal canvas for investors or DIY homeowners. Classic charm waiting for modernization; walkable location close to shops, restaurants, and community amenities. Bring your vision and make this centrally located property your next rewarding project. All bids must be submitted at vrmproperties. Agents must register as a User, enter the property address, and click on ''Start Bid''. This property may qualify for Seller Financing (Vendee). If property was built prior to 1978, Lead Based Paint Potentially Exists.
-
2026-04-06$66,000 Active 573-char remark
Show marketing remark (573 chars)
Downtown Caribou fixer-upper on a generous . 32-acre lot -- an ideal canvas for investors or DIY homeowners. Classic charm waiting for modernization; walkable location close to shops, restaurants, and community amenities. Bring your vision and make this centrally located property your next rewarding project. All bids must be submitted at vrmproperties. Agents must register as a User, enter the property address, and click on ''Start Bid''. This property may qualify for Seller Financing (Vendee). If property was built prior to 1978, Lead Based Paint Potentially Exists.
ⓘ Source: listings_history table (triggers on properties + properties_extension) + one-shot
backfill from property_details.listing_events for pre-trigger history.
Climate risk First Street
- Flood 1/10 Low FEMA zone X · 0% chance over 30 yrs
- Wildfire 1/10 Low
- Heat 2/10 Low 7 d/yr ≥87°F today · 15 d/yr by 30 yrs out
- Wind 4/10 Moderate 10% chance of damaging wind over 30 yrs
- Air quality 1/10 Low 0 unhealthy d/yr today · 0 by 30 yrs out
Nearby sold comps map
Loading sold comps map…
Walkable amenities ~0.75 mi
Loading nearby amenities…
Taxation est. · year 1
- Rental income
- $12,881
- − Mortgage interest
- −$3,081
- − Property taxes
- −$825
- − Insurance
- −$275
- − Repairs & maintenance
- −$1,030
- − Management
- −$1,030
- − Depreciation
- −$1,600
- Taxable income
- $5,039
- Est. tax owed @ 24.0%
- −$1,209
- After-tax cash flow
- $4,405/yr
For passive investors: Depreciation is non-cash, so a rental often shows a tax loss while cash-flowing — sheltering income. Rental losses are passive: they offset passive income freely, and up to $25,000/yr can offset ordinary (W-2) income if you actively participate and your MAGI is under $100k (phasing out to $0 by $150k); unused losses carry forward. On sale, claimed depreciation is recaptured at up to 25%, and gains may owe capital-gains tax (a 1031 exchange can defer both). Figures are a year-1 estimate at your 24.0% rate — not tax advice; consult a CPA.
Schools (NCES district)
- District
- RSU 39
- NCES district ID
- 2314794
- Math proficiency
- 82% ▲ 55.00%
- Reading proficiency
- 83% ▲ 39.00%
- Median HH income
- $38,159
- Composite
- 68.6/100
- National rank
- #341
- State rank
- #79 of 112 in ME
Livability — Caribou
- Score
- 74/100
- State rank
- #46
- US rank
- #4849
Category grades
Schools grade is shown separately in the Schools card above.
Census & demographics
- Census place
- Caribou, ME
- City population
- 9,107
- Population (ZIP)
- 9,107
Population outlook (Aroostook County) Hauer SSP2
- Today (2025)
- 61,905 people
- By 2030
- 57,815 · -6.6%
- By 2040
- 49,240 · -20.5%
- By 2050
- 41,386 · -33.1%
- By 2075
- 27,664 · -55.3%
- By 2100
- 18,974 · -69.3%
Race, ethnicity, and origin ACS 2023
- Neighborhood character
- Predominantly White (93%)
- Race & ethnicity
- White 93% Two or more races 5%
- Common ancestry
- Lithuanian 28% Slovak 3% Serbian 1%
- Foreign-born
- 3% · Canada
- Languages at home
- 92% English-only · French/Haitian/Cajun 7%
Political lean MEDSL · Aroostook
- 2024 margin
- Strong R (+26.2) · D 36.2% · R 62.4% · Other 1.4%
- 2008→2024 swing
- -35.8pp toward R · 2008: 9.6pp · 2024: -26.2pp
- All cycles
- 2024: R+26.2 2020: R+19.9 2016: R+17.3 2012: D+7.7 2008: D+9.6
Not yet ingested
- Civics
- —
Market trends
- HPI YoY
- ▼ -50.06%
- Current HPI
- 219.5142
- Rent YoY
- —
- Metro
- —
- State GDP YoY
- —
- F500 in state
- 0
Price history
-9.1% since first listed2 events — show timeline
- 2026-05-12 Price Changed $60,000 MREIS
- 2026-04-06 Listed $66,000 MREIS
Property tax history
+4.3%/yrLatest (2024): $2,936 · +9.8% YoY. Source: county tax records.
Cash-flow waterfall
monthlySold comps — $/sqft
last 12 mo · ≤1 miLoading sold comps…