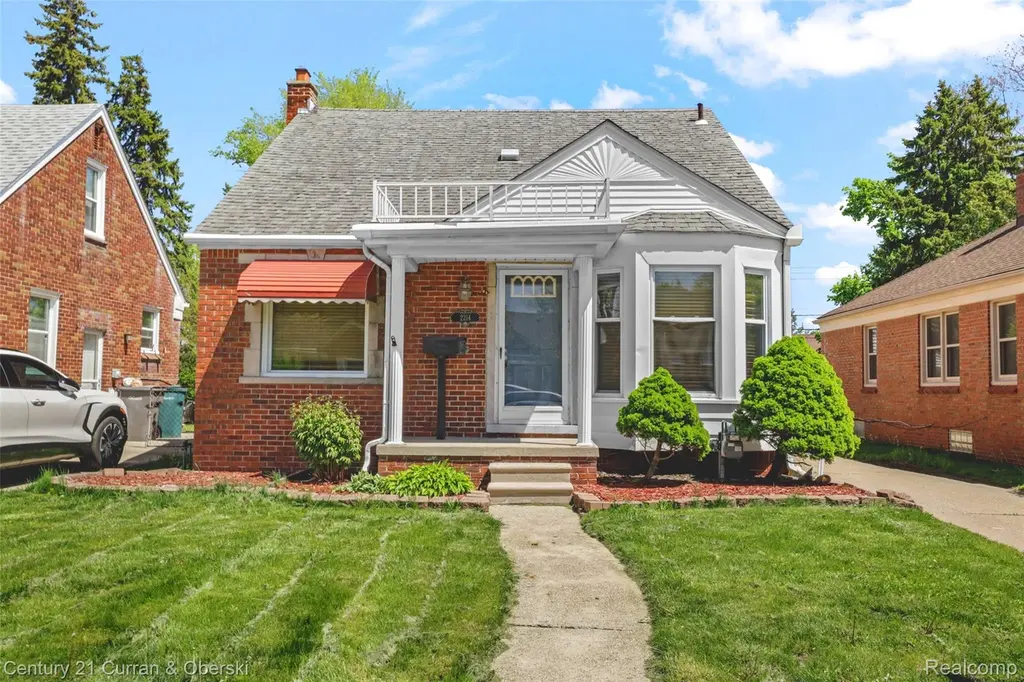
2214 N Lafayette St · Dearborn, MI
Flood risk 1/10 · Minimal
- FEMA flood zone
- X (unshaded)
- Chance of flooding over 30 yrs
- 0.0%
- Est. flood insurance / yr
- $473 – $860
Fire risk 1/10 · Minimal
- Est. fire insurance / yr
- $784 – $1,456
Heat risk 3/10 · Minor
- Hot days now (above 98°F)
- 7 days/yr
- Hot days in 30 yrs
- 15 days/yr
Wind risk 2/10 · Minimal
- Chance of severe wind over 30 yrs
- —
Air-quality risk 2/10 · Minimal
- Unhealthy air days now
- 1 days/yr
- Unhealthy air days in 30 yrs
- 2 days/yr
Risk factors via First Street. Map © Google.
Why this score? — see what drove the F grade
The composite is a weighted blend of 9 inputs, each scored 0–100. Each bar is that input's sub-score; the figure is the points it added to the 100-point composite (weight × sub-score).
- ARV discount +10.5/15.0
- Cash flow +6.5/30.0
- Livability +4.0/5.0
- Schools +2.8/10.0
- Rent growth +2.5/5.0
- Condition / age +2.5/5.0
- 1% rule +1.8/10.0
- DSCR +0.8/10.0
- Appreciation +0.0/10.0
$269,900
🖨 Deal sheet (PDF) 📄 Offer letter ✓ Due diligence
Listing remarks MLS
WELCOME TO THIS BEAUTIFULLY LOCATED 3 BEDROOM, 2 FULL BATH BRICK BUNGALOW IN THE HIGHLY DESIRABLE LEVAGOOD PARK AREA! THIS HOME OFFERS A FANTASTIC FLOOR PLAN WITH SPACIOUS ROOMS AND GREAT NATURAL LIGHT THROUGHOUT. NESTLED IN A PRIME LOCATION, YOU'RE JUST A SHORT WALK FROM SHOPPING, SCHOOLS, AND LOCAL AMENITIES. WHETHER YOU'RE A FIRST-TIME BUYER OR LOOKING TO UPGRADE, THIS HOME PRESENTS A GREAT OPPORTUNITY TO LIVE IN ONE OF THE AREA'S MOST SOUGHT-AFTER NEIGHBORHOODS. DON'T MISS YOUR CHANCE - SCHEDULE YOUR SHOWING TODAY!
Key facts
- 5,663 sq ft lot
- 2 garage spots
- Built 1948
Property features AI
Exterior
- Parking: Detached garage with about 2.5 car spaces
- Utilities: Public water; Public sewer
- Home design: Single-family residence; One and one-half stories; Ground-level entry
- Construction: Brick construction; Block foundation
- Exterior features: Paved road access; Lot approximately 0.13 acres (40 x 137)
Interior
- Bathrooms: Two full bathrooms
- Heating & cooling: Central air conditioning; Forced air heating; Natural gas heat
- Interior features: Finished basement; Six total rooms
Neighborhood map
What this means for you Summary
Snapshot
- This is a 3-bed/2.0-bath single-family listed at $270k.
Deal economics
- At list price, monthly cash flow is $-458 ($-6k/yr) — negative.
- To cash-flow at today's rent, offer at most $189k (30.0% below list).
- To meet the 1% rule (rent ≥ 1% of price), the offer needs to be $183k (32.3% below list).
- Recommended offer: $183k (32.3% below list) — sets the bar for 1% rule.
Location & tenants
- Location reads 80/100 on livability (#84 in MI, #1,904 nationally) — a professional / high-income tenant draw. Strengths: commute A+, cost of living A+, housing A+; Watch: amenities D.
- Dearborn City School District (urban): math 26% / reading 39% proficiency, ranked #325 of 540 in MI (top 60%) — families likely to look elsewhere, expect single-tenant / working-renter base with shorter leases; 66% free/reduced lunch — lower-income household profile, screen leases tightly.
- Zoned schools: Haigh Elementary School (math 43% / reading 67%, grade C, #271 of 1,397 statewide, top 20%, 559 students, 57% FRL); Bryant Middle School (math 33% / reading 55%, grade D, #173 of 493 statewide, top 36%, 796 students, 58% FRL); Dearborn High School (math 33% / reading 54%, grade F, #257 of 713 statewide, top 36%, 1,969 students, 63% FRL).
- Zoned-school proficiency averages 48% at this address vs 32% district-wide (+15 pts) — the actual schools serving this property are materially stronger than the Dearborn City School District average implies; a family-tenant draw the district grade alone would hide.
- Market conditions: 37 active listings in the ZIP; 11 comparable units currently listed for rent nearby; rentals at typical pace (median 20d on market — plan ~3-4 weeks tenant-placement turnaround); 2,639 units permitted in Wayne County in 2024 (1,216 in 5+ unit buildings).
Forward outlook
- Local home prices are declining (-3.0%/yr); year-one equity from $2k of loan paydown is wiped out by about $8k of value loss. Plan a longer hold.
- Wayne County population projected at -17% by 2050 — secular population decline; favor cash flow + early exit over multi-decade hold.
Negotiation context
- Only 10 days on market — expect competitive offers; lowballing is unlikely to land.
- 12 sale attempts since 18y ago with the ask held roughly flat each time — persistent listings suggest the price (not the market) is what's stuck; bring a comps-based counter.
Risks & watch-outs
- Watch-outs: built in 1948 — expect roof / HVAC / electrical / plumbing capex.
Questions for the listing agent
- What do current leases actually rent for vs. the listed asking? Can we see a recent rent roll and the last 12 months of T-12 income?
- Built in 1948 — when were the roof, HVAC, electrical panel, plumbing, and water heater last replaced?
- Is there a deadline driving the sale (1031 exchange, divorce, estate, relocation)? That informs how much negotiation room exists.
- Schools are D-rated, which usually means shorter tenancies and higher turnover. Who's the typical renter profile here, and what's been the actual vacancy rate?
- The area grade is low — what's the realistic commute time and amenity access for the typical tenant pool here? Any planned neighborhood developments (good or bad) we should know about?
- What's the average days-on-market for RENTAL listings here right now (not sales)? A rising rental-DOM trend means longer vacancies and softer asking-rent achievability than the comps imply.
- What's the recent tenant-quality profile in this submarket — average credit score on applications, eviction rate, late-payment / NSF rate, and stable-employment percentage? A property-management company in the area should have these aggregated.
- How much new for-sale + rental construction is in the pipeline within 1–3 miles? Heavy new supply typically softens prices + rents 12–24 months out; constrained supply supports both.
Investment metrics
- 1% rule
- 0.68% ✗
- Cap rate
- 4.25%
- Cash-on-cash
- -7.28%
- DSCR
- 0.68
- GRM
- 12.3
CMA / ARV
- ARV (median comp)
- $289,125
- List price
- $269,900
- Delta
- -6.65%
- Verdict
- FAIR
- Comps
- 20 within 1.0 mi
Show comp detail 12 sales within ~0.75 mi
| Address | Dist | Beds/Ba | Sqft | Sold | Price | $/sf | Match |
|---|---|---|---|---|---|---|---|
| 2211 Drexel St | 0.16mi | 3/2.0 | 1,180 (-6%) | 8mo | $251,000 | $213 | 77 |
| 6043 N Vernon St | 0.35mi | 3/1.0 | 1,250 (-0%) | 9mo | $175,000 | $140 | 72 |
| 6015 Mayburn St W | 0.39mi | 4/1.0 (+1) | 1,256 (+0%) | 5mo | $149,000 | $119 | 68 |
| 1340 N Franklin St | 0.37mi | 3/2.0 | 1,348 (+8%) | 6mo | $325,000 | $241 | 64 |
| 2045 N Vernon St | 0.10mi | 3/1.0 | 1,092 (-13%) | 8mo | $245,000 | $224 | 64 |
| 2213 N Waverly St | 0.35mi | 3/1.0 | 1,328 (+6%) | 8mo | $250,000 | $188 | 63 |
| 5763 N Silvery Ln | 0.30mi | 3/1.0 | 1,110 (-11%) | 2mo | $153,000 | $138 | 62 |
| 6062 Fenton St | 0.38mi | 2/2.0 (-1) | 1,130 (-10%) | 1mo | $205,000 | $181 | 60 |
| 1808 N Melborn St | 0.64mi | 3/1.0 | 1,264 (+1%) | 7mo | $275,000 | $218 | 59 |
| 23752 Hollander St | 0.58mi | 3/1.5 | 1,300 (+4%) | 10mo | $265,000 | $204 | 56 |
| 6180 Colonial St | 0.48mi | 3/1.0 | 1,367 (+9%) | 5mo | $240,000 | $176 | 54 |
| 5959 Rosetta St | 0.66mi | 2/1.0 (-1) | 1,236 (-1%) | 7mo | $485,000 | $392 | 52 |
Match score weights: distance 35% · size 25% · config 20% · recency 20%. Top-matched comps best support the ARV.
Projected returns pro-forma
-3.0% appreciation · 3.0% rent growth · sell at horizon
- IRR
- -29.0%
- Equity multiple
- 0.04×
- Total profit
- $-72,886
- Equity at exit
- $40,243
- IRR
- -28.8%
- Equity multiple
- -0.33×
- Total profit
- $-100,864
- Equity at exit
- $23,336
Cash invested: $75,572 (down + closing). Projections, not guarantees.
Landlord ↔ Tenant lean methodology
- Overall (STATE)
- 62 Landlord-Friendly
- State Michigan
- 62 Landlord-Friendly · EVEN
- County
- — inherits STATE
- City
- — inherits STATE
ZIP-level market 48128
- Active inventory
- 37
- Price-to-rent
- 12.3×
Monthly cashflow live
- Estimated rent
- $1,828 high interval (Pro) →
- Mortgage (P&I)
- −$1,415
- Tax from tax record
- −$375 /mo · $4,498/yr
- Insurance
- −$112
- HOA
- −$0
- Lot rent
- −$0
- Vacancy / Maint / Mgmt
- −$384
- Net cashflow
- $-458
Break-even live
Sensitivity live
| Price | -10% $-306 | -5% $-382 | +0% $-458 | +5% $-535 | +10% $-611 |
|---|---|---|---|---|---|
| Rent | -10% $-603 | -5% $-531 | +0% $-458 | +5% $-386 | +10% $-314 |
| Rate | -1.0pp $-323 | -0.5pp $-390 | base $-458 | +0.5pp $-528 | +1.0pp $-600 |
UW: 25.0% down · 7.5% · 30yr · 1.5% tax · 5.0% vac · 8.0% maint · 8.0% mgmt
Financing live
Cash to close
- Down payment
- $67,475
- Closing costs
- $8,097
- Reserves months
- —
- Total cash needed
- —
Loan-product check · same deal, 3 products live
Conventional
25% down · 7.5% · 30yr
- Down + closing
- —
- Monthly P&I
- —
- Monthly cashflow
- —
- DSCR
- —
- Eligible?
- —
Personal DTI + credit; lowest rate.
DSCR
20% down · 8.5% · 30yr
- Down + closing
- —
- Monthly P&I
- —
- Monthly cashflow
- —
- DSCR
- —
- Eligible?
- —
No personal income docs; deal must DSCR.
Hard money
10% down · 12.0% · 12mo
- Down + closing
- —
- Monthly P&I
- —
- Monthly cashflow
- —
- DSCR
- —
- Eligible?
- —
Short-term bridge; refi at stabilization.
Rent comps 11 comps
| Address | Beds | Baths | Sqft | Rent | $/sqft | DOM | Units | Dist |
|---|---|---|---|---|---|---|---|---|
| 5722 Centralia St Dearborn Heights, MI | 3.0 | 1.0 | 999 | $1,750 | $1.75 | 0d | 1 | 0.78mi |
| 6978 Mayburn St Dearborn Heights, MI | 3.0 | 2.0 | 1250 | $1,800 | $1.44 | 46d | 1 | 1.01mi |
| 7080 Highview St Dearborn Heights, MI | 3.0 | 2.5 | 1105 | $2,000 | $1.81 | 20d | 1 | 1.05mi |
| 7014 Kinmore St Dearborn Heights, MI | 3.0 | 1.0 | 960 | $1,900 | $1.98 | 24d | 1 | 1.08mi |
| 7420 Drexel St Dearborn Heights, MI | 2.0 | 1.0 | 1080 | $1,700 | $1.57 | 46d | 1 | 1.24mi |
| 7420 Drexel St Dearborn Heights, MI | 2.0 | 1.0 | 1080 | $1,700 | $1.57 | 19d | 1 | 1.24mi |
| 7420 Drexel St Dearborn Heights, MI | 2.0 | 1.0 | 1080 | $1,600 | $1.48 | 6d | 1 | 1.24mi |
| 1830 Belmont St Dearborn, MI | 3.0 | 1.5 | 1762 | $2,500 | $1.42 | 46d | 1 | 1.25mi |
| 7462 N Vernon St Dearborn Heights, MI | 4.0 | 1.0 | 1113 | $1,900 | $1.71 | 0d | 1 | 1.27mi |
| 26620 Baldwin St Dearborn Heights, MI | 3.0 | 1.5 | 1156 | $1,800 | $1.56 | 0d | 1 | 1.37mi |
| 26322 Westphal St Dearborn Heights, MI | 1.0–2.0 | 1.0 | 762 | $1,455 | $1.91 | 0d | 25 | 1.40mi |
Listing history 25 events
-
2026-05-15status Pending 524-char remark
Show marketing remark (524 chars)
WELCOME TO THIS BEAUTIFULLY LOCATED 3 BEDROOM, 2 FULL BATH BRICK BUNGALOW IN THE HIGHLY DESIRABLE LEVAGOOD PARK AREA! THIS HOME OFFERS A FANTASTIC FLOOR PLAN WITH SPACIOUS ROOMS AND GREAT NATURAL LIGHT THROUGHOUT. NESTLED IN A PRIME LOCATION, YOU'RE JUST A SHORT WALK FROM SHOPPING, SCHOOLS, AND LOCAL AMENITIES. WHETHER YOU'RE A FIRST-TIME BUYER OR LOOKING TO UPGRADE, THIS HOME PRESENTS A GREAT OPPORTUNITY TO LIVE IN ONE OF THE AREA'S MOST SOUGHT-AFTER NEIGHBORHOODS. DON'T MISS YOUR CHANCE - SCHEDULE YOUR SHOWING TODAY!
-
2026-05-15status Pending 552-char remark
Show marketing remark (524 chars)
WELCOME TO THIS BEAUTIFULLY LOCATED 3 BEDROOM, 2 FULL BATH BRICK BUNGALOW IN THE HIGHLY DESIRABLE LEVAGOOD PARK AREA! THIS HOME OFFERS A FANTASTIC FLOOR PLAN WITH SPACIOUS ROOMS AND GREAT NATURAL LIGHT THROUGHOUT. NESTLED IN A PRIME LOCATION, YOU'RE JUST A SHORT WALK FROM SHOPPING, SCHOOLS, AND LOCAL AMENITIES. WHETHER YOU'RE A FIRST-TIME BUYER OR LOOKING TO UPGRADE, THIS HOME PRESENTS A GREAT OPPORTUNITY TO LIVE IN ONE OF THE AREA'S MOST SOUGHT-AFTER NEIGHBORHOODS. DON'T MISS YOUR CHANCE - SCHEDULE YOUR SHOWING TODAY!
-
2026-05-05$269,900 Active 524-char remark
Show marketing remark (524 chars)
WELCOME TO THIS BEAUTIFULLY LOCATED 3 BEDROOM, 2 FULL BATH BRICK BUNGALOW IN THE HIGHLY DESIRABLE LEVAGOOD PARK AREA! THIS HOME OFFERS A FANTASTIC FLOOR PLAN WITH SPACIOUS ROOMS AND GREAT NATURAL LIGHT THROUGHOUT. NESTLED IN A PRIME LOCATION, YOU'RE JUST A SHORT WALK FROM SHOPPING, SCHOOLS, AND LOCAL AMENITIES. WHETHER YOU'RE A FIRST-TIME BUYER OR LOOKING TO UPGRADE, THIS HOME PRESENTS A GREAT OPPORTUNITY TO LIVE IN ONE OF THE AREA'S MOST SOUGHT-AFTER NEIGHBORHOODS. DON'T MISS YOUR CHANCE - SCHEDULE YOUR SHOWING TODAY!
-
2026-05-05$269,900 Active 552-char remark
Show marketing remark (524 chars)
WELCOME TO THIS BEAUTIFULLY LOCATED 3 BEDROOM, 2 FULL BATH BRICK BUNGALOW IN THE HIGHLY DESIRABLE LEVAGOOD PARK AREA! THIS HOME OFFERS A FANTASTIC FLOOR PLAN WITH SPACIOUS ROOMS AND GREAT NATURAL LIGHT THROUGHOUT. NESTLED IN A PRIME LOCATION, YOU'RE JUST A SHORT WALK FROM SHOPPING, SCHOOLS, AND LOCAL AMENITIES. WHETHER YOU'RE A FIRST-TIME BUYER OR LOOKING TO UPGRADE, THIS HOME PRESENTS A GREAT OPPORTUNITY TO LIVE IN ONE OF THE AREA'S MOST SOUGHT-AFTER NEIGHBORHOODS. DON'T MISS YOUR CHANCE - SCHEDULE YOUR SHOWING TODAY!
-
2012-11-20soldstatus $70,000
-
2012-10-29soldstatus $70,000
Show marketing remark (354 chars)
LEVAGOOD PARK BRICK BUNGALOW - GREAT STARTER HOME AND GREAT PRICE! 2 FULL BATHS - BIG OVERSIZED 2.5 CAR GARAGE - SPRINKLERS - FORMAL DINING ROOM - BRYANT FURNACE & C/A - NEWER ROOF, WINDOWS & HWH. NOT A SHORT SALE OR FORECLOSURE & WILL BE UP TO CODE! WHOLE HOME WATER PURIFIER - APPLIANCES STAYING! GENEROUS CLOSETS - SHOW & SELL!
-
2012-10-01$69,900
Show marketing remark (354 chars)
LEVAGOOD PARK BRICK BUNGALOW - GREAT STARTER HOME AND GREAT PRICE! 2 FULL BATHS - BIG OVERSIZED 2.5 CAR GARAGE - SPRINKLERS - FORMAL DINING ROOM - BRYANT FURNACE & C/A - NEWER ROOF, WINDOWS & HWH. NOT A SHORT SALE OR FORECLOSURE & WILL BE UP TO CODE! WHOLE HOME WATER PURIFIER - APPLIANCES STAYING! GENEROUS CLOSETS - SHOW & SELL!
-
2009-08-11historical
-
2009-06-24$99,900
-
2009-06-24historical
-
2009-06-18$99,900
-
2009-06-18historical
-
2009-06-08$104,900
-
2009-06-08historical
-
2009-05-18$110,000
-
2009-05-18historical
-
2009-01-06$119,900
-
2009-01-06historical
-
2008-09-15$119,900
-
2008-09-15historical
-
2008-07-14$129,900
-
2008-07-11historical
-
2008-01-24$159,900
ⓘ Source: listings_history table (triggers on properties + properties_extension) + one-shot
backfill from property_details.listing_events for pre-trigger history.
Tax reassessment forecast MI · Partial reset (capped growth)
- Current annual tax
- $4,498 · $375/mo
- Projected year-2 tax
- $4,498 · $375/mo
- Expected delta
- $0/yr ($0/mo · 0.0%)
ⓘ Screening estimate from a state-policy table — verify with the county assessor before closing.
Climate risk First Street
- Flood 1/10 Low FEMA zone X (unshaded) · 0% chance over 30 yrs
- Wildfire 1/10 Low
- Heat 3/10 Moderate 7 d/yr ≥98°F today · 15 d/yr by 30 yrs out
- Wind 2/10 Low
- Air quality 2/10 Low 1 unhealthy d/yr today · 2 by 30 yrs out
Nearby sold comps map
Loading sold comps map…
Walkable amenities ~0.75 mi
Loading nearby amenities…
Taxation est. · year 1
- Rental income
- $21,937
- − Mortgage interest
- −$15,119
- − Property taxes
- −$4,498
- − Insurance
- −$1,350
- − Repairs & maintenance
- −$1,755
- − Management
- −$1,755
- − Depreciation
- −$7,852
- Taxable loss
- −$10,391
- Est. tax savings @ 24.0%
- +$2,494
- After-tax cash flow
- $-3,008/yr
For passive investors: Depreciation is non-cash, so a rental often shows a tax loss while cash-flowing — sheltering income. Rental losses are passive: they offset passive income freely, and up to $25,000/yr can offset ordinary (W-2) income if you actively participate and your MAGI is under $100k (phasing out to $0 by $150k); unused losses carry forward. On sale, claimed depreciation is recaptured at up to 25%, and gains may owe capital-gains tax (a 1031 exchange can defer both). Figures are a year-1 estimate at your 24.0% rate — not tax advice; consult a CPA.
Schools (NCES district)
- District
- Dearborn City School District
- NCES district ID
- 2611600
- Math proficiency
- 26% ▼ -14.00%
- Reading proficiency
- 39% ▼ -8.00%
- Median HH income
- $46,884
- Composite
- 27.93/100
- National rank
- #6864
- State rank
- #325 of 540 in MI
Livability — Dearborn
- Score
- 80/100
- State rank
- #84
- US rank
- #1904
Category grades
Schools grade is shown separately in the Schools card above.
Census & demographics
- Census place
- Dearborn, MI
- City population
- 86,476
- Population (ZIP)
- 12,844
Population outlook (Wayne County) Hauer SSP2
- Today (2025)
- 1,675,273 people
- By 2030
- 1,620,300 · -3.3%
- By 2040
- 1,502,341 · -10.3%
- By 2050
- 1,384,039 · -17.4%
- By 2075
- 1,124,592 · -32.9%
- By 2100
- 881,193 · -47.4%
Race, ethnicity, and origin ACS 2023
- Neighborhood character
- Predominantly White (91%)
- Race & ethnicity
- White 91% Hispanic / Latino 4% Two or more races 3% Asian 2% Black 2%
- Common ancestry
- Romanian 11% Slovak 3% Lithuanian 2%
- Foreign-born
- 18% · Canada, China
- Languages at home
- 65% English-only · Arabic 31% Spanish 1% French/Haitian/Cajun 1%
Political lean MEDSL · Wayne
- 2024 margin
- Strong D (+29.0) · D 62.7% · R 33.7% · Other 3.6%
- 2008→2024 swing
- -20.5pp toward R · 2008: 49.5pp · 2024: 29.0pp
- All cycles
- 2024: D+29.0 2020: D+38.1 2016: D+37.3 2012: D+46.9 2008: D+49.5
Not yet ingested
- Civics
- —
Market trends
- HPI YoY
- ▼ -141.10%
- Current HPI
- 250.8859
- Rent YoY
- —
- Metro
- —
- State GDP YoY
- ▲ 1.37%
- F500 in state
- 28
Industry mix (Fortune 500 HQ in MI)
| Industry | F500 HQs | Revenue |
|---|---|---|
| Automotive Parts | 3 | $48B |
|
||
| Automotive | 2 | $372B |
|
||
| Chemicals | 1 | $45B |
|
||
| Automotive Retail | 1 | $29B |
|
||
| Healthcare / Medical Devices | 1 | $23B |
|
||
| Automotive Technology | 1 | $20B |
|
||
Price history
+67.0% since first listed27 events — show timeline
- 2026-05-27 Sold (MLS) $267,000 MiRealSource-MiMLS
- 2026-05-27 Sold (MLS) $267,000 REALCOMP
- 2026-05-15 Pending — MiRealSource-MiMLS
- 2026-05-15 Pending — REALCOMP
- 2026-05-05 Listed $269,900 MiRealSource-MiMLS
- 2026-05-05 Listed $269,900 REALCOMP
- 2012-11-20 Sold (Public Records) $70,000 Public Records
- 2012-10-29 Sold (MLS) $70,000 MiRealSource-MiMLS
- 2012-10-29 Sold (MLS) $70,000 REALCOMP
- 2012-10-01 Listed $69,900 MiRealSource-MiMLS
- 2012-10-01 Listed $69,900 REALCOMP
- 2009-08-11 Listing Removed — REALCOMP
- 2009-06-24 Listing Removed — REALCOMP
- 2009-06-24 Listed $99,900 REALCOMP
- 2009-06-18 Listing Removed — REALCOMP
- 2009-06-18 Listed $99,900 REALCOMP
- 2009-06-08 Listing Removed — REALCOMP
- 2009-06-08 Listed $104,900 REALCOMP
- 2009-05-18 Listing Removed — REALCOMP
- 2009-05-18 Listed $110,000 REALCOMP
- 2009-01-06 Listing Removed — REALCOMP
- 2009-01-06 Listed $119,900 REALCOMP
- 2008-09-15 Listing Removed — REALCOMP
- 2008-09-15 Listed $119,900 REALCOMP
- 2008-07-14 Listed $129,900 REALCOMP
- 2008-07-11 Listing Removed — REALCOMP
- 2008-01-24 Listed $159,900 REALCOMP
Property tax history
+1.6%/yrLatest (2025): $4,498 · -0.3% YoY. Source: county tax records.
Cash-flow waterfall
monthlySold comps — $/sqft
last 12 mo · ≤1 miLoading sold comps…