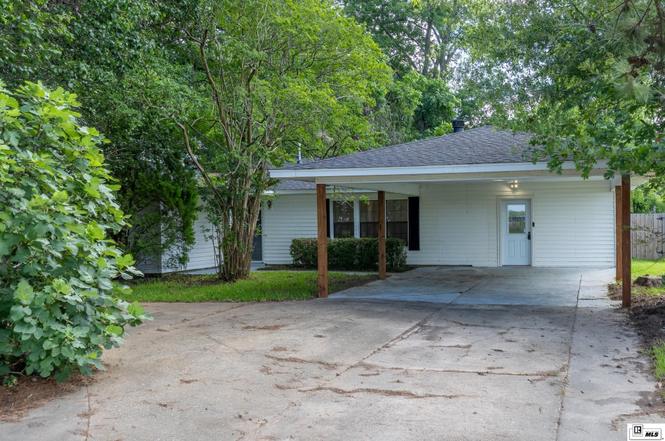
1039 Old Sterlington Rd · Sterlington, LA
Flood risk 1/10 · Minimal
- FEMA flood zone
- X (shaded)
- Chance of flooding over 30 yrs
- 0.0%
- Est. flood insurance / yr
- $507 – $1,088
Fire risk 1/10 · Minimal
- Est. fire insurance / yr
- $1,269 – $2,357
Heat risk 7/10 · Major
- Hot days now (above 111°F)
- 7 days/yr
- Hot days in 30 yrs
- 20 days/yr
Wind risk 6/10 · Moderate
- Chance of severe wind over 30 yrs
- 71.0%
Air-quality risk 1/10 · Minimal
- Unhealthy air days now
- 0 days/yr
- Unhealthy air days in 30 yrs
- 0 days/yr
Risk factors via First Street. Map © Google.
Why this score? — see what drove the D grade
The composite is a weighted blend of 9 inputs, each scored 0–100. Each bar is that input's sub-score; the figure is the points it added to the 100-point composite (weight × sub-score).
- Appreciation +10.0/10.0
- Cash flow +8.1/30.0
- ARV discount +6.7/15.0
- Livability +3.5/5.0
- Schools +3.2/10.0
- Rent growth +2.5/5.0
- Condition / age +2.5/5.0
- DSCR +2.2/10.0
- 1% rule +1.8/10.0
$250,000
🖨 Deal sheet 📄 Offer letter ✓ Due diligence
Listing remarks
Welcome to 1039 Old Sterlington Road, a beautifully renovated 4-bedroom, 2-bath home that combines modern updates with comfortable living spaces. From the moment you enter, you'll appreciate the spacious walk-in entry area, perfect for use as a mudroom, drop zone, or additional flex space. The inviting living room features a cozy fireplace and flows seamlessly into the kitchen and dining area, creating an ideal space for everyday living and entertaining. The primary suite offers a spacious walk-in closet, while three additional bedrooms are situated on the opposite side of the home, providing privacy and a functional layout for families and guests. A large utility room adds convenience, and
Key facts
- Walk-in entry area
- Screened-in porch
- Cozy fireplace
Tags
Property features AI
Finance
- HOA & community: Homeowners association exists (association provides other amenities)
Exterior
- Parking: 2-car garage; Carport; Open parking
- Utilities: Public water; Public sewer; Natural gas available and connected
- Home design: Single-family residence; Site-built home; One level; Entry on level 1
- Construction: Vinyl siding; Slab foundation; Built with traditional construction materials
- Exterior features: Screened and covered patio/porch; Wood fencing; Landscaped corner lot; Paved road access; Workshop structure on property
Interior
- Kitchen: Dishwasher; Gas range
- Bedrooms: 4 bedrooms on the main level
- Bathrooms: 2 full bathrooms, both on the main level
- Heating & cooling: Natural gas heating; Central air conditioning
- Interior features: Ceiling fans; Walk-in closets; Double pane windows; Fireplace (1)
- Laundry & utility: Gas water heater
Neighborhood map
What this means for you Summary
Snapshot
- This is a 3-bed/2.0-bath single-family listed at $250k.
Deal economics
- At list price, monthly cash flow is $-242 ($-3k/yr) — negative.
- To cash-flow at today's rent, offer at most $207k (17.1% below list).
- To meet the 1% rule (rent ≥ 1% of price), the offer needs to be $171k (31.6% below list).
- Recommended offer: $171k (31.6% below list) — sets the bar for 1% rule.
Location & tenants
- Location reads 70/100 on livability (#60 in LA) — a middle-class / working-renter tenant base. Strengths: cost of living A+, housing A+, crime B+; Watch: health & safety D, amenities F, commute F.
- Ouachita Parish (suburban): math 31% / reading 45% proficiency, ranked #26 of 98 in LA (top 26%) — families likely to look elsewhere, expect single-tenant / working-renter base with shorter leases.
- Zoned schools: Sterlington Elementary School (math 56% / reading 65%, grade B-, #62 of 646 statewide, top 10%, 820 students, 45% FRL); Sterlington Middle School (math 50% / reading 58%, grade B-, #19 of 218 statewide, top 9%, 423 students, 48% FRL); Sterlington High School (math 42% / reading 47%, grade F, #58 of 265 statewide, top 23%, 539 students, 41% FRL).
- Zoned-school proficiency averages 53% at this address vs 38% district-wide (+15 pts) — the actual schools serving this property are materially stronger than the Ouachita Parish average implies; a family-tenant draw the district grade alone would hide.
- Market conditions: 189 active listings in the ZIP; 345 units permitted in Ouachita Parish in 2024 (0 in 5+ unit buildings).
Forward outlook
- In year one you build about $27k of equity ($2k loan paydown + $25k appreciation (10.0% local appreciation)).
- By year 2, paydown + projected appreciation supports a ~$43k cash-out refi (75% LTV) — recoverable capital for the next deal without selling this one.
Negotiation context
- Only 8 days on market — expect competitive offers; lowballing is unlikely to land.
Risks & watch-outs
- Watch-outs: built in 1954 — expect roof / HVAC / electrical / plumbing capex.
- Climate carrying-cost: major wind risk, 71% chance of damaging wind over 30y; extreme-heat days projected 7→20/yr by 2055 (HVAC capex compounding) — expect insurance premiums to compound above CPI over the hold.
Questions for the listing agent
- What do current leases actually rent for vs. the listed asking? Can we see a recent rent roll and the last 12 months of T-12 income?
- Built in 1954 — when were the roof, HVAC, electrical panel, plumbing, and water heater last replaced?
- Is there a deadline driving the sale (1031 exchange, divorce, estate, relocation)? That informs how much negotiation room exists.
- Schools are A-rated — typically a magnet for longer-tenancy family renters. What's the average tenant stay here, and is there a school-zone premium baked into asking?
- The area grade is low — what's the realistic commute time and amenity access for the typical tenant pool here? Any planned neighborhood developments (good or bad) we should know about?
- What's the average days-on-market for RENTAL listings here right now (not sales)? A rising rental-DOM trend means longer vacancies and softer asking-rent achievability than the comps imply.
- What's the recent tenant-quality profile in this submarket — average credit score on applications, eviction rate, late-payment / NSF rate, and stable-employment percentage? A property-management company in the area should have these aggregated.
- How much new for-sale + rental construction is in the pipeline within 1–3 miles? Heavy new supply typically softens prices + rents 12–24 months out; constrained supply supports both.
Investment metrics
- 1% rule
- 0.68% ✗
- Cap rate
- 5.13%
- Cash-on-cash
- -4.16%
- DSCR
- 0.82
- GRM
- 12.2
CMA / ARV
- ARV (on-the-fly)
- $245,854
- Comps found
- 4
Show comp detail 4 sales within ~0.75 mi
| Address | Dist | Beds/Ba | Sqft | Sold | Price | $/sf | Match |
|---|---|---|---|---|---|---|---|
| 101 Bartholomew Dr | 0.05mi | 3/3.0 | 2,237 (+8%) | 3mo | $266,700 | $119 | 78 |
| 129 Bartholomew Dr | 0.34mi | 3/2.0 | 1,899 (-8%) | 14mo | $235,000 | $124 | 59 |
| 140 Bartholomew Dr | 0.50mi | 4/2.0 (+1) | 1,917 (-7%) | 18mo | $215,000 | $112 | 44 |
| 6883 Westlake Rd | 0.51mi | 3/2.0 | 1,835 (-11%) | 23mo | $190,500 | $104 | 38 |
Match score weights: distance 35% · size 25% · config 20% · recency 20%. Top-matched comps best support the ARV.
Projected returns pro-forma
10.0% appreciation · 3.0% rent growth · sell at horizon
- IRR
- 21.3%
- Equity multiple
- 2.72×
- Total profit
- $120,656
- Equity at exit
- $225,220
- IRR
- 19.3%
- Equity multiple
- 6.25×
- Total profit
- $367,345
- Equity at exit
- $485,695
Cash invested: $70,000 (down + closing). Projections, not guarantees.
Landlord ↔ Tenant lean methodology
- Overall (STATE)
- 90 Strongly Landlord-Friendly
- State Louisiana
- 90 Strongly Landlord-Friendly · R+12
- County
- — inherits STATE
- City
- — inherits STATE
ZIP-level market 71280
- Home prices YoY
- 4.1%
- Active inventory
- 189
- Price-to-rent
- 12.2×
Monthly cashflow live
- Estimated rent
- $1,711 medium interval (Pro) →
- Mortgage (P&I)
- −$1,311
- Tax from tax record
- −$179 /mo · $2,144/yr
- Insurance
- −$104
- HOA
- −$0
- Vacancy / Maint / Mgmt
- −$359
- Net cashflow
- $-242
Break-even live
UW: 25.0% down · 7.5% · 30yr · 1.5% tax · 5.0% vac · 8.0% maint · 8.0% mgmt
Financing live
Cash to close
- Down payment
- $62,500
- Closing costs
- $7,500
- Reserves months
- —
- Total cash needed
- —
Loan-product check · same deal, 3 products live
Conventional
25% down · 7.5% · 30yr
- Down + closing
- —
- Monthly P&I
- —
- Monthly cashflow
- —
- DSCR
- —
- Eligible?
- —
Personal DTI + credit; lowest rate.
DSCR
20% down · 8.5% · 30yr
- Down + closing
- —
- Monthly P&I
- —
- Monthly cashflow
- —
- DSCR
- —
- Eligible?
- —
No personal income docs; deal must DSCR.
Hard money
10% down · 12.0% · 12mo
- Down + closing
- —
- Monthly P&I
- —
- Monthly cashflow
- —
- DSCR
- —
- Eligible?
- —
Short-term bridge; refi at stabilization.
Listing history 8 events
-
2026-06-19days on market $250,000 Active 8 DOM
-
2026-06-18days on market $250,000 Active 7 DOM
-
2026-06-17days on market $250,000 Active 6 DOM
-
2026-06-16days on market $250,000 Active 5 DOM
-
2026-06-15days on market $250,000 Active 4 DOM
-
2026-06-14days on market $250,000 Active 2 DOM
-
2026-06-13remarks 699-char remark
-
2026-06-13$250,000 Active 1 DOM
ⓘ Source: listings_history table (triggers on properties + properties_extension) + one-shot
backfill from property_details.listing_events for pre-trigger history.
Tax reassessment forecast LA · Resets to sale price
- Current annual tax
- $2,144 · $179/mo
- Projected year-2 tax
- $2,144 · $179/mo
- Expected delta
- $0/yr ($0/mo · 0.0%)
ⓘ Screening estimate from a state-policy table — verify with the county assessor before closing.
Climate risk First Street
- Flood 1/10 Low FEMA zone X (shaded) · 0% chance over 30 yrs
- Wildfire 1/10 Low
- Heat 7/10 Severe 7 d/yr ≥111°F today · 20 d/yr by 30 yrs out
- Wind 6/10 Major 71% chance of damaging wind over 30 yrs
- Air quality 1/10 Low 0 unhealthy d/yr today · 0 by 30 yrs out
Nearby sold comps map
Loading sold comps map…
Walkable amenities ~0.75 mi
Loading nearby amenities…
Taxation est. · year 1
- Rental income
- $20,527
- − Mortgage interest
- −$14,004
- − Property taxes
- −$2,144
- − Insurance
- −$1,250
- − Repairs & maintenance
- −$1,642
- − Management
- −$1,642
- − Depreciation
- −$7,273
- Taxable loss
- −$7,428
- Est. tax savings @ 24.0%
- +$1,783
- After-tax cash flow
- $-1,127/yr
For passive investors: Depreciation is non-cash, so a rental often shows a tax loss while cash-flowing — sheltering income. Rental losses are passive: they offset passive income freely, and up to $25,000/yr can offset ordinary (W-2) income if you actively participate and your MAGI is under $100k (phasing out to $0 by $150k); unused losses carry forward. On sale, claimed depreciation is recaptured at up to 25%, and gains may owe capital-gains tax (a 1031 exchange can defer both). Figures are a year-1 estimate at your 24.0% rate — not tax advice; consult a CPA.
Schools (NCES district)
- District
- Ouachita Parish
- NCES district ID
- 2201200
- Math proficiency
- 31% ▼ -38.00%
- Reading proficiency
- 45% ▼ -31.00%
- Median HH income
- $43,316
- Composite
- 32.14/100
- National rank
- #5791
- State rank
- #26 of 98 in LA
Livability — Sterlington
- Score
- 70/100
- State rank
- #60
- US rank
- #7741
Category grades
Schools grade is shown separately in the Schools card above.
Census & demographics
- Census place
- Sterlington, LA
- Population (ZIP)
- 4,999
Population outlook (Ouachita County) Hauer SSP2
- Today (2025)
- 163,370 people
- By 2030
- 165,520 · +1.3%
- By 2040
- 167,652 · +2.6%
- By 2050
- 166,699 · +2.0%
- By 2075
- 156,348 · -4.3%
- By 2100
- 134,102 · -17.9%
Race, ethnicity, and origin ACS 2023
- Neighborhood character
- Predominantly White (74%)
- Race & ethnicity
- White 74% Black 21% Hispanic / Latino 4%
- Common ancestry
- Lithuanian 4% Iranian 2% Danish 1%
- Foreign-born
- 3% · Canada, Jamaica
- Languages at home
- 98% English-only · Spanish 2%
Political lean MEDSL · Ouachita
- 2024 margin
- Strong R (+27.9) · D 35.5% · R 63.3% · Other 1.2%
- 2008→2024 swing
- -2.7pp toward R · 2008: -25.2pp · 2024: -27.9pp
- All cycles
- 2024: R+27.9 2020: R+23.6 2016: R+25.4 2012: R+20.9 2008: R+25.2
Not yet ingested
- Civics
- —
Market trends
- HPI YoY
- ▲ 11.14%
- Current HPI
- 283.4492
- Rent YoY
- —
- Metro
- —
- State GDP YoY
- ▲ 3.29%
- F500 in state
- 10
Industry mix (Fortune 500 HQ in LA)
| Industry | F500 HQs | Revenue |
|---|---|---|
| Telecommunications | 2 | $23B |
|
||
| Utilities | 1 | $12B |
|
||
| Wholesale / Distribution | 1 | $5B |
|
||
| Advertising | 1 | $2B |
|
||
Price history
2 events — show timeline
- 2026-06-11 Listed $250,000 NELABOR
- 2004-08-01 Sold (Public Records) — Public Records
Property tax history
+2.6%/yrLatest (2025): $2,144 · -0.7% YoY. Source: county tax records.
Cash-flow waterfall
monthlySold comps — $/sqft
last 12 mo · ≤1 miLoading sold comps…