 Duplex
42 & 566 42 Kinney / 566 Piermont St · Piermont, NY
Flood risk 10/10 · Severe
- FEMA flood zone
- X (unshaded)
- Chance of flooding over 30 yrs
- 0.99%
- Est. flood insurance / yr
- $473 – $860
Fire risk 4/10 · Minor
- Est. fire insurance / yr
- $691 – $1,283
Heat risk 6/10 · Moderate
- Hot days now (above 101°F)
- 7 days/yr
- Hot days in 30 yrs
- 16 days/yr
Wind risk 6/10 · Moderate
- Chance of severe wind over 30 yrs
- 27.0%
Air-quality risk 4/10 · Minor
- Unhealthy air days now
- 4 days/yr
- Unhealthy air days in 30 yrs
- 6 days/yr
Risk factors via First Street. Map © Google.
Why this score? — see what drove the B- grade
The composite is a weighted blend of 9 inputs, each scored 0–100. Each bar is that input's sub-score; the figure is the points it added to the 100-point composite (weight × sub-score).
- Cash flow +27.4/30.0
- 1% rule +10.0/10.0
- DSCR +9.6/10.0
- ARV discount +7.5/15.0
- Schools +5.5/10.0
- Livability +3.4/5.0
- Rent growth +2.5/5.0
- Condition / age +2.5/5.0
- Appreciation +0.0/10.0
$350,000
🖨 Deal sheet 📄 Offer letter ✓ Due diligence
Multi-family units
County records classify this as Multi-Family (2-4 Unit). Listing-text estimate: 2 units. confirmed
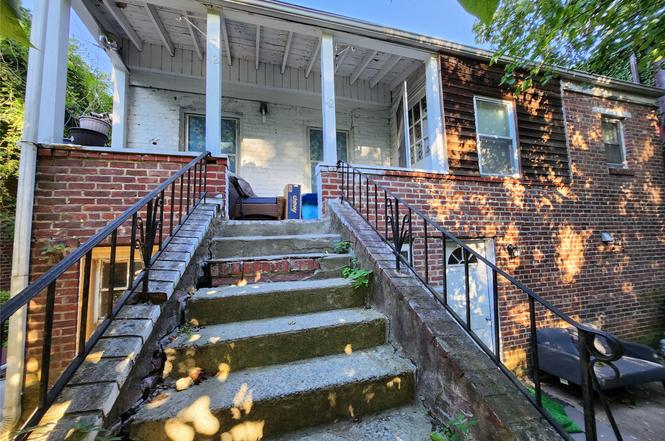
Listing remarks
Drive by Only Short sale. Sold as is. The two unit building straddles 2 streets 1 apartment on 42 Kinney. The other on 566 Piermont
Key facts
- 1,742 sq ft lot
- Built 1920
- Listed 10 days
Neighborhood map
What this means for you Summary
Snapshot
- This is a 2 × 2-bed/1.0-bath units multifamily listed at $350k.
Deal economics
- At list price, monthly cash flow is $972 ($12k/yr) — positive. Per door: $486/mo.
- The deal already cash-flows at list — no discount required.
- Meets the 1% rule at list price ($5k rent vs $350k).
- Cap rate 9.8% vs local median 0.4% in Piermont — top-decile yield for the area; either an underpriced asset or a hidden risk that comps aren't pricing in. Stress-test before assuming the spread holds.
Location & tenants
- Location reads 67/100 on livability (#571 in NY) — a middle-class / working-renter tenant base. Strengths: crime A+, employment A+, housing B; Watch: amenities F, commute F, cost of living F.
- South Orangetown Central School District (suburban): math 52% / reading 66% proficiency, ranked #183 of 590 in NY (top 31%) — acceptable for families but not a draw, mixed tenant base, ~2y average lease; only 8% free/reduced lunch — higher-income household profile.
- Zoned schools: William O Schaefer Elementary School (576 students, 18% FRL); South Orangetown Middle School (math 39% / reading 65%, grade C+, #241 of 729 statewide, top 35%, 633 students, 20% FRL); Tappan Zee High School (math 94% / reading 92%, grade A+, #147 of 1,100 statewide, top 14%, 953 students, 22% FRL).
- Zoned-school proficiency averages 72% at this address vs 59% district-wide (+14 pts) — the actual schools serving this property are materially stronger than the South Orangetown Central School District average implies; a family-tenant draw the district grade alone would hide.
- Market conditions: 29 active listings in the ZIP; 2 comparable units currently listed for rent nearby; high-income renter base; 429 units permitted in Rockland County in 2024 (231 in 5+ unit buildings).
- This rent runs 44% of the median local income ($145k/yr) — at the standard rent-burdened threshold; future hikes will face affordability resistance.
Forward outlook
- Local home prices are declining (-3.0%/yr); year-one equity from $2k of loan paydown is wiped out by about $10k of value loss. Plan a longer hold.
- Rockland County population projected at +7% by 2050 — modest demand growth; plan on rents tracking national, not racing it.
- At projected returns (-3.0% appreciation + 3.0% rent growth), your $98k cash investment doubles in ~10 years — after that, you're playing with house money.
Negotiation context
- Only 10 days on market — expect competitive offers; lowballing is unlikely to land.
- Current owner paid $275k; 27% above their basis — modest negotiation headroom, anchor on the comps not their cost.
Risks & watch-outs
- Watch-outs: property tax is 4.1% of price; flood insurance adds $56/mo; built in 1920 — expect roof / HVAC / electrical / plumbing capex.
- Climate carrying-cost: severe flood risk; major wind risk, 27% chance of damaging wind over 30y; extreme-heat days projected 7→16/yr by 2055 (HVAC capex compounding) — expect insurance premiums to compound above CPI over the hold.
Questions for the listing agent
- Can we see the unit-by-unit rent roll, current vacancy, and any below-market leases? What's the average tenancy length?
- What capital expenditures (roof, boiler, parking lot, exteriors) have been made in the last 5 years, and what's planned in the next 2?
- Built in 1920 — when were the roof, HVAC, electrical panel, plumbing, and water heater last replaced?
- Property tax is high relative to price — has the assessment been appealed recently, and will the sale trigger a re-assessment?
- What's the actual annual flood-insurance premium (NFIP or private), and is the property in a SFHA with mandatory coverage?
- Is there a deadline driving the sale (1031 exchange, divorce, estate, relocation)? That informs how much negotiation room exists.
- What's the average days-on-market for RENTAL listings here right now (not sales)? A rising rental-DOM trend means longer vacancies and softer asking-rent achievability than the comps imply.
- What's the recent tenant-quality profile in this submarket — average credit score on applications, eviction rate, late-payment / NSF rate, and stable-employment percentage? A property-management company in the area should have these aggregated.
- How much new apartment / multifamily construction is in the pipeline within 1–3 miles? Heavy new supply (>2% of stock underway) typically softens rents 12–24 months out; light construction supports rent growth.
Investment metrics
- 1% rule
- 1.52% ✓
- Cap rate
- 9.82%
- Cash-on-cash
- 12.58%
- DSCR
- 1.56
- GRM
- 5.5
CMA / ARV
No comps found within radius.
Projected returns pro-forma
-3.0% appreciation · 3.0% rent growth · sell at horizon
- IRR
- 1.5%
- Equity multiple
- 1.06×
- Total profit
- $5,779
- Equity at exit
- $52,186
- IRR
- 11.3%
- Equity multiple
- 1.89×
- Total profit
- $87,135
- Equity at exit
- $30,262
Cash invested: $98,000 (down + closing). Projections, not guarantees.
Landlord ↔ Tenant lean methodology
- Overall (STATE)
- 15 Strongly Tenant-Friendly
- State New York
- 15 Strongly Tenant-Friendly · D+10
- County
- — inherits STATE
- City
- — inherits STATE
ZIP-level market 10968
- Home prices YoY
- -24.4%
- Active inventory
- 29
- Price-to-rent
- 10.9×
Monthly cashflow live
- Estimated rent
- $5,337 medium interval (Pro) →
- Mortgage (P&I)
- −$1,835
- Tax from tax record
- −$1,207 /mo · $14,489/yr
- Insurance
- −$146
- Flood insurance flood zone
- −$56 /mo · $666/yr
- HOA
- −$0
- Vacancy / Maint / Mgmt
- −$1,121
- Net cashflow
- $972
Break-even live
2-unit breakdown (identical units grouped — click to expand)
| Units | Beds | Baths | Est. rent |
|---|---|---|---|
| 2× units | 2 | 1 | $5,338 |
| #1 | 2 | 1 | $2,669 |
| #2 | 2 | 1 | $2,669 |
| Total (2 units) | $5,337 | ||
UW: 25.0% down · 7.5% · 30yr · 1.5% tax · 5.0% vac · 8.0% maint · 8.0% mgmt
Financing live
Cash to close
- Down payment
- $87,500
- Closing costs
- $10,500
- Reserves months
- —
- Total cash needed
- —
Loan-product check · same deal, 3 products live
Conventional
25% down · 7.5% · 30yr
- Down + closing
- —
- Monthly P&I
- —
- Monthly cashflow
- —
- DSCR
- —
- Eligible?
- —
Personal DTI + credit; lowest rate.
DSCR
20% down · 8.5% · 30yr
- Down + closing
- —
- Monthly P&I
- —
- Monthly cashflow
- —
- DSCR
- —
- Eligible?
- —
No personal income docs; deal must DSCR.
Hard money
10% down · 12.0% · 12mo
- Down + closing
- —
- Monthly P&I
- —
- Monthly cashflow
- —
- DSCR
- —
- Eligible?
- —
Short-term bridge; refi at stabilization.
Rent comps 2 comps
| Address | Beds | Baths | Sqft | Rent | $/sqft | DOM | Units | Dist |
|---|---|---|---|---|---|---|---|---|
| 351 Piermont Ave Piermont, NY | 3.0 | 1.5 | 1694 | $5,295 | $3.13 | 1d | 1 | 0.41mi |
| 306 Piermont Ave Piermont, NY | 3.0 | 2.0 | 1375 | $3,950 | $2.87 | 18d | 1 | 0.49mi |
Listing history 4 events
-
2025-09-16status Pending
-
2025-09-05$350,000 Active
-
2003-05-21soldstatus $275,000
-
1975-02-17soldstatus $78,000
ⓘ Source: listings_history table (triggers on properties + properties_extension) + one-shot
backfill from property_details.listing_events for pre-trigger history.
Tax reassessment forecast NY · Partial reset (capped growth)
- Current annual tax
- $14,489 · $1,207/mo
- Projected year-2 tax
- $14,489 · $1,207/mo
- Expected delta
- $0/yr ($0/mo · 0.0%)
ⓘ Screening estimate from a state-policy table — verify with the county assessor before closing.
Climate risk First Street
- Flood 10/10 Extreme FEMA zone X (unshaded) · 99% chance over 30 yrs
- Wildfire 4/10 Moderate
- Heat 6/10 Major 7 d/yr ≥101°F today · 16 d/yr by 30 yrs out
- Wind 6/10 Major 27% chance of damaging wind over 30 yrs
- Air quality 4/10 Moderate 4 unhealthy d/yr today · 6 by 30 yrs out
Nearby sold comps map
Loading sold comps map…
Walkable amenities ~0.75 mi
Loading nearby amenities…
Taxation est. · year 1
- Rental income
- $64,044
- − Mortgage interest
- −$19,605
- − Property taxes
- −$14,489
- − Insurance
- −$2,416
- − Repairs & maintenance
- −$5,124
- − Management
- −$5,124
- − Depreciation
- −$10,182
- Taxable income
- $7,104
- Est. tax owed @ 24.0%
- −$1,705
- After-tax cash flow
- $9,959/yr
For passive investors: Depreciation is non-cash, so a rental often shows a tax loss while cash-flowing — sheltering income. Rental losses are passive: they offset passive income freely, and up to $25,000/yr can offset ordinary (W-2) income if you actively participate and your MAGI is under $100k (phasing out to $0 by $150k); unused losses carry forward. On sale, claimed depreciation is recaptured at up to 25%, and gains may owe capital-gains tax (a 1031 exchange can defer both). Figures are a year-1 estimate at your 24.0% rate — not tax advice; consult a CPA.
Schools (NCES district)
- District
- South Orangetown Central School District
- NCES district ID
- 3627450
- Math proficiency
- 52% ▼ -15.00%
- Reading proficiency
- 66% ▲ 4.00%
- Median HH income
- $102,606
- Composite
- 55.22/100
- National rank
- #1270
- State rank
- #183 of 590 in NY
Livability — Piermont
- Score
- 67/100
- State rank
- #571
- US rank
- #10275
Category grades
Schools grade is shown separately in the Schools card above.
Census & demographics
- Census place
- Piermont, NY
- County
- Rockland County · 98,828 people
- City population
- 2,456
- Metro
- New York-Newark-Jersey City, NY-NJ-PA
- Population (ZIP)
- 2,456
- Household income
- $145,000
- Rent vs Own
- Severe rent burden
- 82.0
Population outlook (Rockland County) Hauer SSP2
- Today (2025)
- 339,642 people
- By 2030
- 345,987 · +1.9%
- By 2040
- 357,178 · +5.2%
- By 2050
- 362,456 · +6.7%
- By 2075
- 367,281 · +8.1%
- By 2100
- 328,211 · -3.4%
Race, ethnicity, and origin ACS 2023
- Neighborhood character
- Predominantly White (82%)
- Race & ethnicity
- White 82% Asian 10% Hispanic / Latino 5% Two or more races 3% Black 1%
- Common ancestry
- Romanian 7% Scotch-Irish 5% Lithuanian 4%
- Foreign-born
- 12% · South Korea, Canada, China
- Languages at home
- 87% English-only · Korean 6% Other Indo-European 2% Spanish 2%
Political lean MEDSL · Rockland
- 2024 margin
- R (+11.8) · D 44.1% · R 55.9%
- 2008→2024 swing
- -17.7pp toward R · 2008: 5.9pp · 2024: -11.8pp
- All cycles
- 2024: R+11.8 2020: D+1.7 2016: D+5.1 2012: D+6.6 2008: D+5.9
Not yet ingested
- Civics
- —
Market trends
- HPI YoY
- ▼ -72.10%
- Current HPI
- 223.2897
- Rent YoY
- —
- Metro
- New York-Newark-Jersey City, NY-NJ-PA
- State GDP YoY
- ▲ 2.60%
- F500 in state
- 92
Industry mix (Fortune 500 HQ in NY)
| Industry | F500 HQs | Revenue |
|---|---|---|
| Financial Services | 10 | $950B |
|
||
| Consumer Goods | 9 | $162B |
|
||
| Insurance | 4 | $225B |
|
||
| Telecommunications | 2 | $144B |
|
||
| Pharmaceuticals | 2 | $112B |
|
||
| Media / Entertainment | 2 | $69B |
|
||
Price history
+348.7% since first listed4 events — show timeline
- 2025-09-16 Pending — OneKey® MLS as Distributed by MLS Grid
- 2025-09-05 Listed $350,000 OneKey® MLS as Distributed by MLS Grid
- 2003-05-21 Sold (Public Records) $275,000 Public Records
- 1975-02-17 Sold (Public Records) $78,000 Public Records
Property tax history
+0.1%/yrLatest (2025): $14,489 · +49.4% YoY. Source: county tax records.
Cash-flow waterfall
monthlySold comps — $/sqft
last 12 mo · ≤1 miLoading sold comps…