 🏗️ New Construction
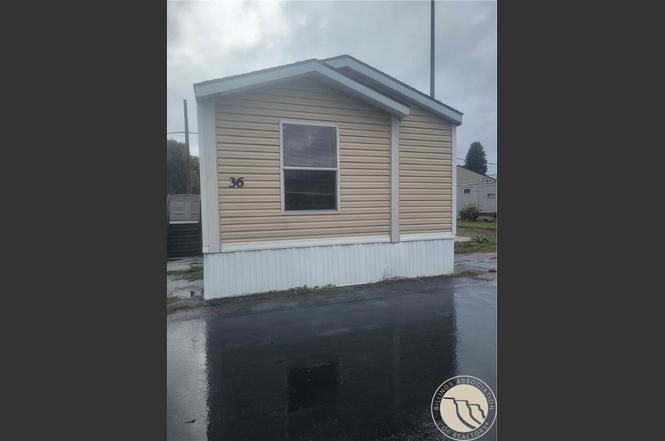
307 S Billings Blvd Blvd #36 · Billings, MT
Flood risk 1/10 · Minimal
- FEMA flood zone
- X (unshaded)
- Chance of flooding over 30 yrs
- 0.0%
- Est. flood insurance / yr
- $507 – $1,088
Fire risk 4/10 · Minor
- Est. fire insurance / yr
- $918 – $1,706
Heat risk 3/10 · Minor
- Hot days now (above 95°F)
- 7 days/yr
- Hot days in 30 yrs
- 15 days/yr
Wind risk 1/10 · Minimal
- Chance of severe wind over 30 yrs
- —
Air-quality risk 4/10 · Minor
- Unhealthy air days now
- 3 days/yr
- Unhealthy air days in 30 yrs
- 5 days/yr
Risk factors via First Street. Map © Google.
Why this score? — see what drove the B grade
The composite is a weighted blend of 9 inputs, each scored 0–100. Each bar is that input's sub-score; the figure is the points it added to the 100-point composite (weight × sub-score).
- Cash flow +30.0/30.0
- 1% rule +10.0/10.0
- DSCR +10.0/10.0
- ARV discount +7.5/15.0
- Livability +4.0/5.0
- Rent growth +3.5/5.0
- Schools +3.2/10.0
- Condition / age +2.5/5.0
- Appreciation +0.0/10.0
$89,000
🖨 Deal sheet 📄 Offer letter ✓ Due diligence
Key facts
- Major renovation
- New flooring
- Central air
Tags
Property features AI
Finance
- HOA & community: Homeowners association with monthly fee of $447; HOA covers grounds and structure maintenance, snow removal, trash, and water
Exterior
- Parking: No designated parking
- Utilities: Public water; Public sewer
- Home design: Manufactured home (single-family residence); One level; New construction
- Construction: Vinyl siding; Asphalt shingle roof
- Exterior features: Front porch; Interior, level lot
Interior
- Kitchen: Dishwasher; Oven; Range; Refrigerator
- Bedrooms: 3 main-level bedrooms
- Bathrooms: 2 full bathrooms (both on the main level)
- Heating & cooling: Central air conditioning; Natural gas forced-air heating
- Interior features: Window coverings / treatments; 5 total rooms; No basement
- Laundry & utility: Washer hookup
Neighborhood map
What this means for you Summary
Snapshot
- This is a 3-bed/2.0-bath manufactured listed at $89k.
Deal economics
- At list price, monthly cash flow is $352 ($4k/yr) — positive.
- The deal already cash-flows at list — no discount required.
- Meets the 1% rule at list price ($1k rent vs $89k).
- Recommended offer: $78k (12.0% below list) — sets the bar for market timing.
- Cap rate 15.7% vs local median 3.0% in Billings — top-decile yield for the area; either an underpriced asset or a hidden risk that comps aren't pricing in. Stress-test before assuming the spread holds.
Location & tenants
- Location reads 80/100 on livability (#10 in MT, #1,830 nationally) — a professional / high-income tenant draw. Strengths: amenities A+, commute A+, housing A+; Watch: crime F.
- Billings H S (urban): math 29% / reading 45% proficiency, ranked #69 of 116 in MT (top 60%) — families likely to look elsewhere, expect single-tenant / working-renter base with shorter leases.
- Zoned schools: Billings West High School (math 34% / reading 52%, grade F, #35 of 132 statewide, top 27%, 2,269 students, 0% FRL).
- Market conditions: Rents rising (+4.0%/yr); 279 active listings in the ZIP; 21 comparable units currently listed for rent nearby; rentals leasing fast (median 14d on market — plan ~1-2 weeks tenant-placement turnaround); 1,401 units permitted in Yellowstone County in 2024 (281 in 5+ unit buildings).
Forward outlook
- Local home prices are declining (-3.0%/yr); year-one equity from $311 of loan paydown is wiped out by about $1k of value loss. Plan a longer hold.
- Yellowstone County population projected at +26% by 2050 — long-run rental-demand tailwind backs the buy-and-hold thesis.
- At projected returns (-3.0% appreciation + 4.0% rent growth), your $13k cash investment doubles in ~4 years — after that, you're playing with house money.
Negotiation context
- It's been on market 253 days — a 12% lower offer ($78k) is reasonable based on typical stale-listing flexibility.
- 2 sale attempts with the ask held roughly flat each time — persistent listings suggest the price (not the market) is what's stuck; bring a comps-based counter.
Risks & watch-outs
- Watch-outs: HOA is 32% of rent.
Questions for the listing agent
- It's been on market 253 days. Have you received any prior offers? Is the seller open to a 12% concession, seller financing, or rate buy-down credit?
- What does the HOA fee cover, when was the last increase, and are there any pending special assessments or reserve-fund shortfalls?
- Why hasn't it sold? Are there any deal-killer items the seller is aware of (foundation, flood, title, zoning, code violations)?
- Is there a deadline driving the sale (1031 exchange, divorce, estate, relocation)? That informs how much negotiation room exists.
- Schools are D-rated, which usually means shorter tenancies and higher turnover. Who's the typical renter profile here, and what's been the actual vacancy rate?
- Crime grade is F in this area — have there been break-ins, vandalism, or insurance claims at this property in the last 3 years? What carrier currently insures it and at what premium?
- What's the average days-on-market for RENTAL listings here right now (not sales)? A rising rental-DOM trend means longer vacancies and softer asking-rent achievability than the comps imply.
- What's the recent tenant-quality profile in this submarket — average credit score on applications, eviction rate, late-payment / NSF rate, and stable-employment percentage? A property-management company in the area should have these aggregated.
- How much new for-sale + rental construction is in the pipeline within 1–3 miles? Heavy new supply typically softens prices + rents 12–24 months out; constrained supply supports both.
Investment metrics
- 1% rule
- 3.12% ✓
- Cap rate
- 15.69%
- Cash-on-cash
- 33.55%
- DSCR
- 2.49
- GRM
- 2.7
CMA / ARV
- ARV (on-the-fly)
- $44,992
- Comps found
- 1
Show comp detail 1 sale within ~0.75 mi
| Address | Dist | Beds/Ba | Sqft | Sold | Price | $/sf | Match |
|---|---|---|---|---|---|---|---|
| 307 South Billings Blvd Blvd #67 | 0.06mi | 3/2.0 | 1,216 (0%) | 15mo | $44,800 | $37 | 85 |
Match score weights: distance 35% · size 25% · config 20% · recency 20%. Top-matched comps best support the ARV.
Projected returns pro-forma
-3.0% appreciation · 3.96% rent growth · sell at horizon
- IRR
- 31.0%
- Equity multiple
- 2.33×
- Total profit
- $16,805
- Equity at exit
- $6,708
- IRR
- 39.2%
- Equity multiple
- 5.00×
- Total profit
- $50,451
- Equity at exit
- $3,890
Cash invested: $12,598 (down + closing). Projections, not guarantees.
Landlord ↔ Tenant lean methodology
- Overall (STATE)
- 82 Strongly Landlord-Friendly
- State Montana
- 82 Strongly Landlord-Friendly · R+11
- County
- — inherits STATE
- City
- — inherits STATE
ZIP-level market 59101
- Rents YoY
- 4.0%
- Active inventory
- 279
- Price-to-rent
- 5.3×
Monthly cashflow live
- Estimated rent
- $1,405 high interval (Pro) →
- Mortgage (P&I)
- −$236
- Tax est. 1.5%
- −$56 /mo · $675/yr
- Insurance
- −$19
- HOA
- −$447
- Vacancy / Maint / Mgmt
- −$295
- Net cashflow
- $352
Break-even live
UW: 25.0% down · 7.5% · 30yr · 1.5% tax · 5.0% vac · 8.0% maint · 8.0% mgmt
Financing live
Cash to close
- Down payment
- $11,248
- Closing costs
- $1,350
- Reserves months
- —
- Total cash needed
- —
Loan-product check · same deal, 3 products live
Conventional
25% down · 7.5% · 30yr
- Down + closing
- —
- Monthly P&I
- —
- Monthly cashflow
- —
- DSCR
- —
- Eligible?
- —
Personal DTI + credit; lowest rate.
DSCR
20% down · 8.5% · 30yr
- Down + closing
- —
- Monthly P&I
- —
- Monthly cashflow
- —
- DSCR
- —
- Eligible?
- —
No personal income docs; deal must DSCR.
Hard money
10% down · 12.0% · 12mo
- Down + closing
- —
- Monthly P&I
- —
- Monthly cashflow
- —
- DSCR
- —
- Eligible?
- —
Short-term bridge; refi at stabilization.
Rent comps 21 comps
| Address | Beds | Baths | Sqft | Rent | $/sqft | DOM | Units | Dist |
|---|---|---|---|---|---|---|---|---|
| 743 Cook Ave Apt B Billings, MT | 2.0 | 1.0 | 900 | $1,400 | $1.56 | 13d | 1 | 0.51mi |
| 635 Cook Ave Billings, MT | 2.0 | 1.0 | 894 | $975 | $1.09 | 13d | 1 | 0.52mi |
| 414 1/2 7th St W Billings, MT | 2.0 | 1.0 | 832 | $955 | $1.15 | 13d | 1 | 0.68mi |
| 4239 Phillip St Billings, MT | 3.0 | 1.0 | 1500 | $1,950 | $1.30 | 21d | 1 | 0.76mi |
| 1332 Eldorado Dr Billings, MT | 2.0 | 1.0 | 800 | $1,495 | $1.87 | 13d | 1 | 0.77mi |
| 1227 Howard Ave Apt 3 Billings, MT | 2.0 | 1.0 | 953 | $1,000 | $1.05 | 13d | 1 | 0.84mi |
| 302 Miles Ave Unit 1 Billings, MT | 4.0 | 1.0 | 1275 | $1,695 | $1.33 | 21d | 1 | 0.84mi |
| 720 Wyoming Ave Billings, MT | 3.0 | 1.0 | 1155 | $1,895 | $1.64 | 21d | 1 | 0.89mi |
| 238 Terry Ave Unit 2 Billings, MT | 2.0 | 1.0 | 768 | $1,275 | $1.66 | 13d | 1 | 0.92mi |
| 238 Terry Ave Unit 1 Billings, MT | 2.0 | 1.0 | 768 | $1,475 | $1.92 | 13d | 1 | 0.92mi |
| 1327 Terry Ave Billings, MT | 2.0 | 1.0 | 817 | $1,495 | $1.83 | 13d | 1 | 1.03mi |
| 318 Yellowstone Ave Billings, MT | 2.0 | 1.0 | 1000 | $950 | $0.95 | 13d | 1 | 1.10mi |
| 1341 Clark Ave Unit 1 Billings, MT | 2.0 | 1.0 | 1008 | $1,600 | $1.59 | 13d | 1 | 1.29mi |
| 1506 Yellowstone Ave Billings, MT | 2.0 | 1.0 | 920 | $950 | $1.03 | 13d | 1 | 1.33mi |
| 1512 Yellowstone Ave Billings, MT | 2.0 | 1.0 | 985 | $1,000 | $1.02 | 21d | 1 | 1.34mi |
| 113 N 35th St Billings, MT | 2.0 | 1.0 | 1200 | $1,800 | $1.50 | 13d | 1 | 1.36mi |
| 520 Avenue B Unit B Billings, MT | 2.0 | 1.0 | 936 | $1,195 | $1.28 | 13d | 1 | 1.40mi |
| 815 Avenue C Unit 815 Billings, MT | 3.0 | 1.0 | 1100 | $1,495 | $1.36 | 13d | 1 | 1.46mi |
| 815 Avenue C Billings, MT | 3.0 | 1.0 | 1100 | $1,595 | $1.45 | 13d | 1 | 1.46mi |
| 103 Alderson Ave Unit 1 Billings, MT | 2.0 | 1.0 | 1152 | $1,100 | $0.95 | 21d | 1 | 1.50mi |
| 103 Alderson Ave Billings, MT | 2.0 | 1.0 | 1152 | $1,100 | $0.95 | 13d | 1 | 1.50mi |
HOA detail
- Monthly dues
- $447 · $5,364/yr
Listing history 19 events
-
2026-06-19days on market $89,000 Active 253 DOM
-
2026-06-18days on market $89,000 Active 252 DOM
-
2026-06-17days on market $89,000 Active 251 DOM
-
2026-06-16days on market $89,000 Active 250 DOM
-
2026-06-15days on market $89,000 Active 249 DOM
-
2026-06-14days on market $89,000 Active 247 DOM
-
2026-06-13days on market $89,000 Active 246 DOM
-
2026-06-10days on market $89,000 Active 244 DOM
-
2026-06-09days on market $89,000 Active 243 DOM
-
2026-06-08days on market $89,000 Active 242 DOM
-
2026-06-07days on market $89,000 Active 241 DOM
-
2026-06-05days on market $89,000 Active 238 DOM
-
2026-06-02days on market $89,000 Active 236 DOM
-
2026-06-01days on market $89,000 Active 235 DOM
-
2026-05-31days on market $89,000 Active 234 DOM
-
2026-05-30days on market $89,000 Active 233 DOM
-
2026-04-06status Active
-
2026-03-30historical Active Under Contract
-
2025-10-08$89,000 Active
ⓘ Source: listings_history table (triggers on properties + properties_extension) + one-shot
backfill from property_details.listing_events for pre-trigger history.
Climate risk First Street
- Flood 1/10 Low FEMA zone X (unshaded) · 0% chance over 30 yrs
- Wildfire 4/10 Moderate
- Heat 3/10 Moderate 7 d/yr ≥95°F today · 15 d/yr by 30 yrs out
- Wind 1/10 Low
- Air quality 4/10 Moderate 3 unhealthy d/yr today · 5 by 30 yrs out
Nearby sold comps map
Loading sold comps map…
Walkable amenities ~0.75 mi
Loading nearby amenities…
Taxation est. · year 1
- Rental income
- $16,862
- − Mortgage interest
- −$2,520
- − Property taxes
- −$675
- − Insurance
- −$225
- − Repairs & maintenance
- −$1,349
- − Management
- −$1,349
- − HOA
- −$5,364
- − Depreciation
- −$1,309
- Taxable income
- $4,071
- Est. tax owed @ 24.0%
- −$977
- After-tax cash flow
- $3,249/yr
For passive investors: Depreciation is non-cash, so a rental often shows a tax loss while cash-flowing — sheltering income. Rental losses are passive: they offset passive income freely, and up to $25,000/yr can offset ordinary (W-2) income if you actively participate and your MAGI is under $100k (phasing out to $0 by $150k); unused losses carry forward. On sale, claimed depreciation is recaptured at up to 25%, and gains may owe capital-gains tax (a 1031 exchange can defer both). Figures are a year-1 estimate at your 24.0% rate — not tax advice; consult a CPA.
Schools (NCES district)
- District
- Billings H S
- NCES district ID
- 3003900
- Math proficiency
- 29% ▼ -4.00%
- Reading proficiency
- 45% ▲ 2.00%
- Median HH income
- $49,863
- Composite
- 31.93/100
- National rank
- #5848
- State rank
- #69 of 116 in MT
Livability — Billings
- Score
- 80/100
- State rank
- #10
- US rank
- #1830
Category grades
Schools grade is shown separately in the Schools card above.
Census & demographics
- Census place
- Billings, MT
- County
- Yellowstone County · 159,426 people
- City population
- 147,124
- Metro
- Billings, MT
- Population (ZIP)
- 42,250
- Household income
- $58,598
- Rent vs Own
- Severe rent burden
- 1534.0
Population outlook (Yellowstone County) Hauer SSP2
- Today (2025)
- 176,227 people
- By 2030
- 185,619 · +5.3%
- By 2040
- 203,543 · +15.5%
- By 2050
- 221,100 · +25.5%
- By 2075
- 266,931 · +51.5%
- By 2100
- 301,141 · +70.9%
Race, ethnicity, and origin ACS 2023
- Neighborhood character
- Predominantly White (75%)
- Race & ethnicity
- White 75% Hispanic / Latino 9% Native American 9% Two or more races 8% Black 1%
- Hispanic origin (detail)
- Mexican 6%
- Common ancestry
- Portuguese 6% Italian 2% Lithuanian 2%
- Foreign-born
- 2% · Canada
- Languages at home
- 96% English-only · Spanish 1%
Political lean MEDSL · Yellowstone
- 2024 margin
- Strong R (+27.1) · D 34.9% · R 62.0% · Other 3.1%
- 2008→2024 swing
- -20.8pp toward R · 2008: -6.3pp · 2024: -27.1pp
- All cycles
- 2024: R+27.1 2020: R+24.0 2016: R+27.1 2012: R+20.6 2008: R+6.3
Not yet ingested
- Civics
- —
Market trends
- HPI YoY
- ▼ -191.74%
- Current HPI
- 201.7039
- Rent YoY
- ▲ 3.96%
- Metro
- Billings, MT
- State GDP YoY
- ▲ 3.41%
- F500 in state
- 2
Industry mix (Fortune 500 HQ in MT)
| Industry | F500 HQs | Revenue |
|---|---|---|
| Technology / Analytics | 1 | $2B |
|
||
Price history
3 events — show timeline
- 2026-04-06 Relisted — BMTMLS
- 2026-03-30 Contingent — BMTMLS
- 2025-10-08 Listed $89,000 BMTMLS
Cash-flow waterfall
monthlySold comps — $/sqft
last 12 mo · ≤1 miLoading sold comps…