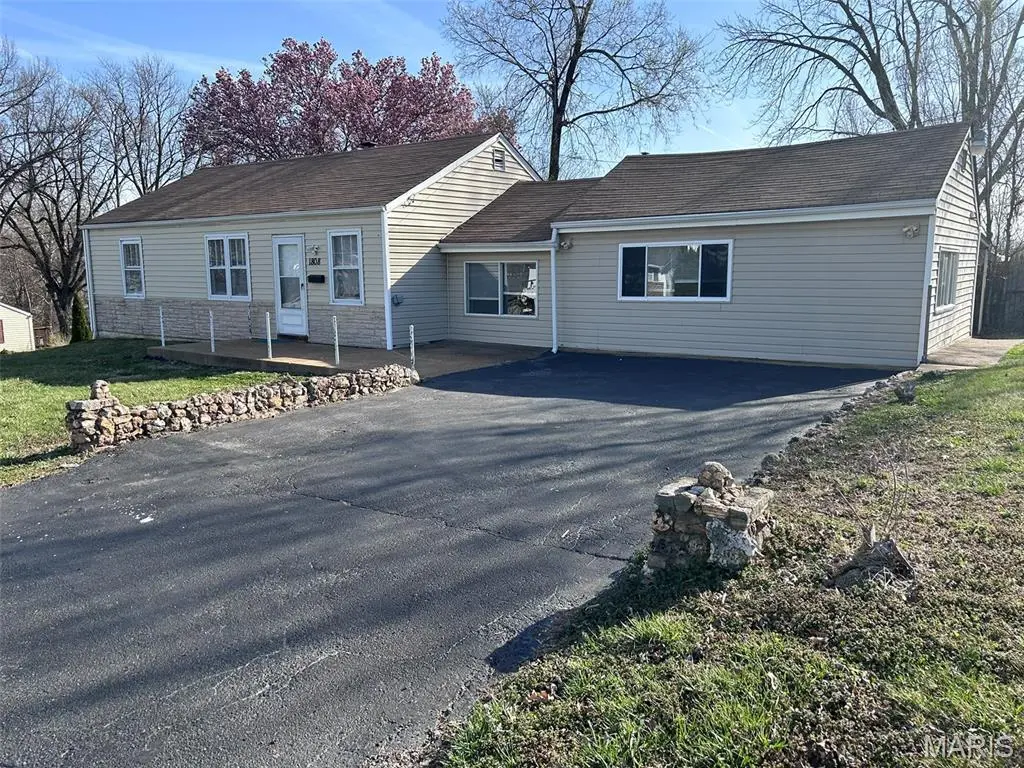
1808 Spencer Ave · Overland, MO
Flood risk 1/10 · Minimal
- FEMA flood zone
- X (unshaded)
- Chance of flooding over 30 yrs
- 0.0%
- Est. flood insurance / yr
- $473 – $860
Fire risk 1/10 · Minimal
- Est. fire insurance / yr
- $1,054 – $1,958
Heat risk 5/10 · Moderate
- Hot days now (above 107°F)
- 7 days/yr
- Hot days in 30 yrs
- 21 days/yr
Wind risk 2/10 · Minimal
- Chance of severe wind over 30 yrs
- 1.0%
Air-quality risk 2/10 · Minimal
- Unhealthy air days now
- 1 days/yr
- Unhealthy air days in 30 yrs
- 3 days/yr
Risk factors via First Street. Map © Google.
Why this score? — see what drove the B- grade
The composite is a weighted blend of 9 inputs, each scored 0–100. Each bar is that input's sub-score; the figure is the points it added to the 100-point composite (weight × sub-score).
- Cash flow +26.3/30.0
- ARV discount +15.0/15.0
- DSCR +8.9/10.0
- 1% rule +6.7/10.0
- Livability +3.1/5.0
- Rent growth +3.0/5.0
- Condition / age +2.5/5.0
- Schools +1.7/10.0
- Appreciation +0.0/10.0
$149,000
🖨 Deal sheet 📄 Offer letter ✓ Due diligence
Listing remarks
Tenant occupied. DO NOT Disturb. No Trespassing. Welcome to 1808 Spencer Avenue, a charming opportunity located in the heart of St. Louis County! This property offers solid potential for investors. Situated on a quiet residential street, this home features a traditional layout with inviting living spaces and plenty of natural light throughout. The property includes a spacious yard, ideal for outdoor entertaining, gardening, or future enhancements. Mature trees and surrounding homes add to the neighborhood’s appeal, providing a sense of privacy and community. Inside, you’ll find a functional floor plan ready for your personal touch. Whether you’re looking to renovate, updat
Key facts
- Spacious yard
- Natural light
- Mature trees
Tags
Property features AI
Finance
- Other: Living area reported as 1,415 (per public records); Lot size approximately 0.1722 acres; Taxes listed (not included per instructions)
- Financial info: Lease not considered
- HOA & community: No HOA information listed
Exterior
- Parking: Driveway
- Security: No security features listed
- Utilities: Public water; Public sewer; Electricity (Ameren); Natural gas connected; Electricity connected; Sewer connected; Water connected
- Home design: Single-family residence; One level
- Construction: Vinyl siding; Has basement
- Exterior features: Front yard; Near public transit
Interior
- Kitchen: Includes dishwasher, gas oven, refrigerator
- Bedrooms: 3 bedrooms (all on the main level)
- Flooring: No flooring details listed
- Bathrooms: No bathrooms listed
- Heating & cooling: Forced air heating; Central air conditioning
- Interior features: Unfinished basement; Dishwasher; Gas oven; Refrigerator
- Laundry & utility: No laundry/utility details listed
Neighborhood map
What this means for you Summary
Snapshot
- This is a 2-bed/1.0-bath single-family listed at $149k.
Deal economics
- At list price, monthly cash flow is $386 ($5k/yr) — positive.
- The deal already cash-flows at list — no discount required.
- Meets the 1% rule at list price ($2k rent vs $149k).
- Cap rate 9.4% vs local median 6.2% in Overland — top-decile yield for the area; either an underpriced asset or a hidden risk that comps aren't pricing in. Stress-test before assuming the spread holds.
Location & tenants
- Location reads 61/100 on livability (#436 in MO) — a middle-class / working-renter tenant base. Strengths: cost of living A+, housing A+; Watch: health & safety C-, crime F, amenities F.
- Ritenour (suburban): math 13% / reading 27% proficiency, ranked #304 of 324 in MO (top 94%) — low school quality limits family demand, transient renter base, plan for 1-2y turnover; 66% free/reduced lunch — lower-income household profile, screen leases tightly.
- Zoned schools: Wyland Elem. (math 13% / reading 25%, grade F, #958 of 1,115 statewide, top 86%, 490 students, 99% FRL); Ritenour Sr. High (math 9% / reading 36%, grade F, #455 of 521 statewide, top 88%, 1,873 students, 100% FRL) — zoned schools average 100% FRL vs 66% district-wide (34 pts higher); higher-poverty schools than district average — tighter screening recommended.
- Market conditions: Rents rising (+2.0%/yr); 118 active listings in the ZIP; 9 comparable units currently listed for rent nearby; rentals at typical pace (median 24d on market — plan ~3-4 weeks tenant-placement turnaround); 44% of comp listings sitting > 30 days — soft ceiling on asking rent; 920 units permitted in St. Louis County in 2024 (250 in 5+ unit buildings).
- This rent runs 37% of the median local income ($56k/yr) — at the standard rent-burdened threshold; future hikes will face affordability resistance.
Forward outlook
- Local home prices are declining (-3.0%/yr); year-one equity from $1k of loan paydown is wiped out by about $4k of value loss. Plan a longer hold.
Negotiation context
- Only 7 days on market — expect competitive offers; lowballing is unlikely to land.
- 2 sale attempts with the ask held roughly flat each time — persistent listings suggest the price (not the market) is what's stuck; bring a comps-based counter.
- Current owner paid $35k; list at $149k implies a 326% gain — meaningful room to come down on a strong offer.
Risks & watch-outs
- Watch-outs: built in 1949 — expect roof / HVAC / electrical / plumbing capex.
- Climate carrying-cost: extreme-heat days projected 7→21/yr by 2055 (HVAC capex compounding) — expect insurance premiums to compound above CPI over the hold.
Questions for the listing agent
- Built in 1949 — when were the roof, HVAC, electrical panel, plumbing, and water heater last replaced?
- Is there a deadline driving the sale (1031 exchange, divorce, estate, relocation)? That informs how much negotiation room exists.
- Schools are F-rated, which usually means shorter tenancies and higher turnover. Who's the typical renter profile here, and what's been the actual vacancy rate?
- Crime grade is F in this area — have there been break-ins, vandalism, or insurance claims at this property in the last 3 years? What carrier currently insures it and at what premium?
- What's the average days-on-market for RENTAL listings here right now (not sales)? A rising rental-DOM trend means longer vacancies and softer asking-rent achievability than the comps imply.
- What's the recent tenant-quality profile in this submarket — average credit score on applications, eviction rate, late-payment / NSF rate, and stable-employment percentage? A property-management company in the area should have these aggregated.
- How much new for-sale + rental construction is in the pipeline within 1–3 miles? Heavy new supply typically softens prices + rents 12–24 months out; constrained supply supports both.
Investment metrics
- 1% rule
- 1.17% ✓
- Cap rate
- 9.41%
- Cash-on-cash
- 11.12%
- DSCR
- 1.49
- GRM
- 7.1
CMA / ARV
- ARV (on-the-fly)
- $181,120
- Comps found
- 12
Show comp detail 12 sales within ~0.75 mi
| Address | Dist | Beds/Ba | Sqft | Sold | Price | $/sf | Match |
|---|---|---|---|---|---|---|---|
| 9700 Ridge Ave | 0.15mi | 3/2.0 (+1) | 1,445 (+2%) | 8mo | $194,900 | $135 | 74 |
| 2217 Hood Ave | 0.45mi | 3/1.0 (+1) | 1,476 (+4%) | 1mo | $180,000 | $122 | 66 |
| 9430 Ridge Ave | 0.37mi | 3/1.0 (+1) | 1,320 (-7%) | 8mo | $179,900 | $136 | 60 |
| 2051 Goodale Ave | 0.65mi | 3/1.0 (+1) | 1,536 (+9%) | 1mo | $175,000 | $114 | 50 |
| 2106 Lackland Rd | 0.64mi | 2/1.0 | 1,555 (+10%) | 7mo | $199,900 | $129 | 48 |
| 2204 Burns Ave | 0.51mi | 3/2.5 (+1) | 1,560 (+10%) | 3mo | $199,000 | $128 | 45 |
| 10024 Driver Ave | 0.75mi | 2/1.5 | 1,573 (+11%) | 2mo | $180,000 | $114 | 43 |
| 2228 Spencer Ave | 0.54mi | 3/1.0 (+1) | 1,210 (-14%) | 7mo | $155,000 | $128 | 40 |
| 2243 Wengler Ave | 0.55mi | 3/1.0 (+1) | 1,224 (-14%) | 9mo | $79,900 | $65 | 40 |
| 2239 Wismer Ave | 0.66mi | 3/2.0 (+1) | 1,230 (-13%) | 0mo | $229,900 | $187 | 38 |
| 2331 Hood Ave | 0.73mi | 2/2.0 | 1,606 (+14%) | 5mo | $125,000 | $78 | 36 |
| 9455 Crockett Dr | 0.72mi | 3/2.0 (+1) | 1,260 (-11%) | 8mo | $359,000 | $285 | 33 |
Match score weights: distance 35% · size 25% · config 20% · recency 20%. Top-matched comps best support the ARV.
Projected returns pro-forma
-3.0% appreciation · 2.04% rent growth · sell at horizon
- IRR
- -0.8%
- Equity multiple
- 0.97×
- Total profit
- $-1,198
- Equity at exit
- $22,216
- IRR
- 7.9%
- Equity multiple
- 1.57×
- Total profit
- $23,942
- Equity at exit
- $12,883
Cash invested: $41,720 (down + closing). Projections, not guarantees.
Landlord ↔ Tenant lean methodology
- Overall (STATE)
- 81 Strongly Landlord-Friendly
- State Missouri
- 81 Strongly Landlord-Friendly · R+10
- County
- — inherits STATE
- City
- — inherits STATE
ZIP-level market 63114
- Rents YoY
- 2.0%
- Active inventory
- 118
- Price-to-rent
- 7.1×
Monthly cashflow live
- Estimated rent
- $1,745 high interval (Pro) →
- Mortgage (P&I)
- −$781
- Tax from tax record
- −$149 /mo · $1,788/yr
- Insurance
- −$62
- HOA
- −$0
- Vacancy / Maint / Mgmt
- −$367
- Net cashflow
- $386
Break-even live
UW: 25.0% down · 7.5% · 30yr · 1.5% tax · 5.0% vac · 8.0% maint · 8.0% mgmt
Financing live
Cash to close
- Down payment
- $37,250
- Closing costs
- $4,470
- Reserves months
- —
- Total cash needed
- —
Loan-product check · same deal, 3 products live
Conventional
25% down · 7.5% · 30yr
- Down + closing
- —
- Monthly P&I
- —
- Monthly cashflow
- —
- DSCR
- —
- Eligible?
- —
Personal DTI + credit; lowest rate.
DSCR
20% down · 8.5% · 30yr
- Down + closing
- —
- Monthly P&I
- —
- Monthly cashflow
- —
- DSCR
- —
- Eligible?
- —
No personal income docs; deal must DSCR.
Hard money
10% down · 12.0% · 12mo
- Down + closing
- —
- Monthly P&I
- —
- Monthly cashflow
- —
- DSCR
- —
- Eligible?
- —
Short-term bridge; refi at stabilization.
Rent comps 9 comps
| Address | Beds | Baths | Sqft | Rent | $/sqft | DOM | Units | Dist |
|---|---|---|---|---|---|---|---|---|
| 1150 N Price Rd St. Louis, MO | 1.0–3.0 | 1.0–2.0 | 999 | $2,758 | $2.76 | 1d | 151 | 0.94mi |
| 1836 Morven Ave Saint Louis, MO | 2.0 | 1.5 | 1496 | $1,670 | $1.12 | 14d | 1 | 0.97mi |
| 9150 Olive Xing St. Louis, MO | 1.0–2.0 | 1.0–2.0 | 1084 | $3,575 | $3.30 | 1d | 3 | 1.15mi |
| 9814 Greenery Ln Unit D Saint Louis, MO | 2.0 | 1.0 | 875 | $1,250 | $1.43 | 23d | 1 | 1.34mi |
| 9882 Greenery Ln Saint Louis, MO | 2.0 | 1.0 | 900 | $1,400 | $1.56 | 43d | 1 | 1.34mi |
| 9826 Greenery Ln Saint Louis, MO | 2.0 | 1.0 | 900 | $1,275 | $1.42 | 43d | 1 | 1.34mi |
| 9814 Greenery Ln Saint Louis, MO | 2.0 | 1.0 | 900 | $1,475 | $1.64 | 43d | 1 | 1.34mi |
| 10525 Roseton Ct Saint Louis, MO | 2.0 | 2.0 | 1500 | $1,500 | $1.00 | 43d | 1 | 1.40mi |
| 18 Queensbrook Pl Saint Louis, MO | 3.0 | 2.0 | 1675 | $3,500 | $2.09 | 1d | 1 | 1.43mi |
Listing history 5 events
-
2026-06-16statusdays on market $149,000 Pending 7 DOM
-
2026-06-15days on market $149,000 Active 6 DOM
-
2026-06-13days on market $149,000 Active 4 DOM
-
2026-06-10remarks 681-char remark
-
2026-06-10$149,000 Active 1 DOM
ⓘ Source: listings_history table (triggers on properties + properties_extension) + one-shot
backfill from property_details.listing_events for pre-trigger history.
Tax reassessment forecast MO · Resets to sale price
- Current annual tax
- $1,788 · $149/mo
- Projected year-2 tax
- $1,788 · $149/mo
- Expected delta
- $0/yr ($0/mo · 0.0%)
ⓘ Screening estimate from a state-policy table — verify with the county assessor before closing.
Climate risk First Street
- Flood 1/10 Low FEMA zone X (unshaded) · 0% chance over 30 yrs
- Wildfire 1/10 Low
- Heat 5/10 Major 7 d/yr ≥107°F today · 21 d/yr by 30 yrs out
- Wind 2/10 Low 100% chance of damaging wind over 30 yrs
- Air quality 2/10 Low 1 unhealthy d/yr today · 3 by 30 yrs out
Nearby sold comps map
Loading sold comps map…
Walkable amenities ~0.75 mi
Loading nearby amenities…
Taxation est. · year 1
- Rental income
- $20,945
- − Mortgage interest
- −$8,346
- − Property taxes
- −$1,788
- − Insurance
- −$745
- − Repairs & maintenance
- −$1,676
- − Management
- −$1,676
- − Depreciation
- −$4,335
- Taxable income
- $2,380
- Est. tax owed @ 24.0%
- −$571
- After-tax cash flow
- $4,066/yr
For passive investors: Depreciation is non-cash, so a rental often shows a tax loss while cash-flowing — sheltering income. Rental losses are passive: they offset passive income freely, and up to $25,000/yr can offset ordinary (W-2) income if you actively participate and your MAGI is under $100k (phasing out to $0 by $150k); unused losses carry forward. On sale, claimed depreciation is recaptured at up to 25%, and gains may owe capital-gains tax (a 1031 exchange can defer both). Figures are a year-1 estimate at your 24.0% rate — not tax advice; consult a CPA.
Schools (NCES district)
- District
- Ritenour
- NCES district ID
- 2926640
- Math proficiency
- 13% ▼ -14.00%
- Reading proficiency
- 27% ▼ -7.00%
- Median HH income
- $41,410
- Composite
- 17.04/100
- National rank
- #9125
- State rank
- #304 of 324 in MO
Livability — Overland
- Score
- 61/100
- State rank
- #436
- US rank
- #17870
Category grades
Schools grade is shown separately in the Schools card above.
Census & demographics
- Census place
- Overland, MO
- County
- Saint Louis County · 888,823 people
- City population
- 33,969
- Metro
- St. Louis, MO-IL
- Population (ZIP)
- 33,969
- Household income
- $55,870
- Rent vs Own
- Severe rent burden
- 1595.0
Population outlook (St. Louis County) Hauer SSP2
- Today (2025)
- 1,025,227 people
- By 2030
- 1,028,023 · +0.3%
- By 2040
- 1,020,940 · -0.4%
- By 2050
- 1,007,280 · -1.8%
- By 2075
- 987,277 · -3.7%
- By 2100
- 921,984 · -10.1%
Race, ethnicity, and origin ACS 2023
- Neighborhood character
- Diverse neighborhood (Simpson 0.64)
- Race & ethnicity
- White 50% Black 30% Hispanic / Latino 11% Two or more races 6% Asian 2%
- Hispanic origin (detail)
- Mexican 7%
- Common ancestry
- Lithuanian 3% Italian 2% Romanian 1%
- Foreign-born
- 9% · Canada, Vietnam
- Languages at home
- 84% English-only · Spanish 10% French/Haitian/Cajun 2% Tagalog/Filipino 1%
Political lean MEDSL · St. Louis
- 2024 margin
- Strong D (+23.4) · D 60.8% · R 37.4% · Other 1.7%
- 2008→2024 swing
- +3.5pp toward D · 2008: 19.9pp · 2024: 23.4pp
- All cycles
- 2024: D+23.4 2020: D+24.0 2016: D+16.2 2012: D+13.7 2008: D+19.9
Not yet ingested
- Civics
- —
Market trends
- HPI YoY
- ▼ -276.62%
- Current HPI
- 223.9305
- Rent YoY
- ▲ 2.04%
- Metro
- St. Louis, MO-IL
- State GDP YoY
- ▲ 1.84%
- F500 in state
- 20
Industry mix (Fortune 500 HQ in MO)
| Industry | F500 HQs | Revenue |
|---|---|---|
| Healthcare | 1 | $163B |
|
||
| Insurance | 1 | $21B |
|
||
| Industrial Technology | 1 | $17B |
|
||
| Retail | 1 | $16B |
|
||
| Industrial Distribution | 1 | $10B |
|
||
| Utilities | 1 | $9B |
|
||
Price history
+178.5% since first listed9 events — show timeline
- 2026-06-09 Listed $149,000 MARIS as Distributed by MLS Grid
- 2025-04-19 Rental Removed $1,450 SHOWMOJO
- 2025-03-22 Listed for Rent $1,450 SHOWMOJO
- 2017-09-11 Price Changed $69,900 MARIS as Distributed by MLS Grid
- 2017-09-07 Price Changed $72,900 MARIS as Distributed by MLS Grid
- 2017-08-09 Price Changed $75,900 MARIS as Distributed by MLS Grid
- 2015-08-24 Sold (Public Records) $35,000 Public Records
- 2015-07-14 Sold (Public Records) $10,000 Public Records
- 1996-05-14 Sold (Public Records) $53,500 Public Records
Property tax history
+0.4%/yrLatest (2022): $1,788 · +0.0% YoY. Source: county tax records.
Cash-flow waterfall
monthlySold comps — $/sqft
last 12 mo · ≤1 miLoading sold comps…