1156 N Longwood St · Baltimore, MD
Flood risk 1/10 · Minimal
- FEMA flood zone
- X (unshaded)
- Chance of flooding over 30 yrs
- 0.0%
- Est. flood insurance / yr
- $473 – $860
Fire risk 1/10 · Minimal
- Est. fire insurance / yr
- $755 – $1,403
Heat risk 7/10 · Major
- Hot days now (above 103°F)
- 7 days/yr
- Hot days in 30 yrs
- 15 days/yr
Wind risk 6/10 · Moderate
- Chance of severe wind over 30 yrs
- 27.0%
Air-quality risk 3/10 · Minor
- Unhealthy air days now
- 3 days/yr
- Unhealthy air days in 30 yrs
- 4 days/yr
Risk factors via First Street. Map © Google.
Why this score? — see what drove the B+ grade
The composite is a weighted blend of 9 inputs, each scored 0–100. Each bar is that input's sub-score; the figure is the points it added to the 100-point composite (weight × sub-score).
- Cash flow +30.0/30.0
- ARV discount +15.0/15.0
- DSCR +10.0/10.0
- 1% rule +9.1/10.0
- Rent growth +4.0/5.0
- Livability +3.8/5.0
- Condition / age +2.5/5.0
- Schools +1.0/10.0
- Appreciation +0.0/10.0
$125,000
🖨 Deal sheet (PDF) 📄 Offer letter ✓ Due diligence
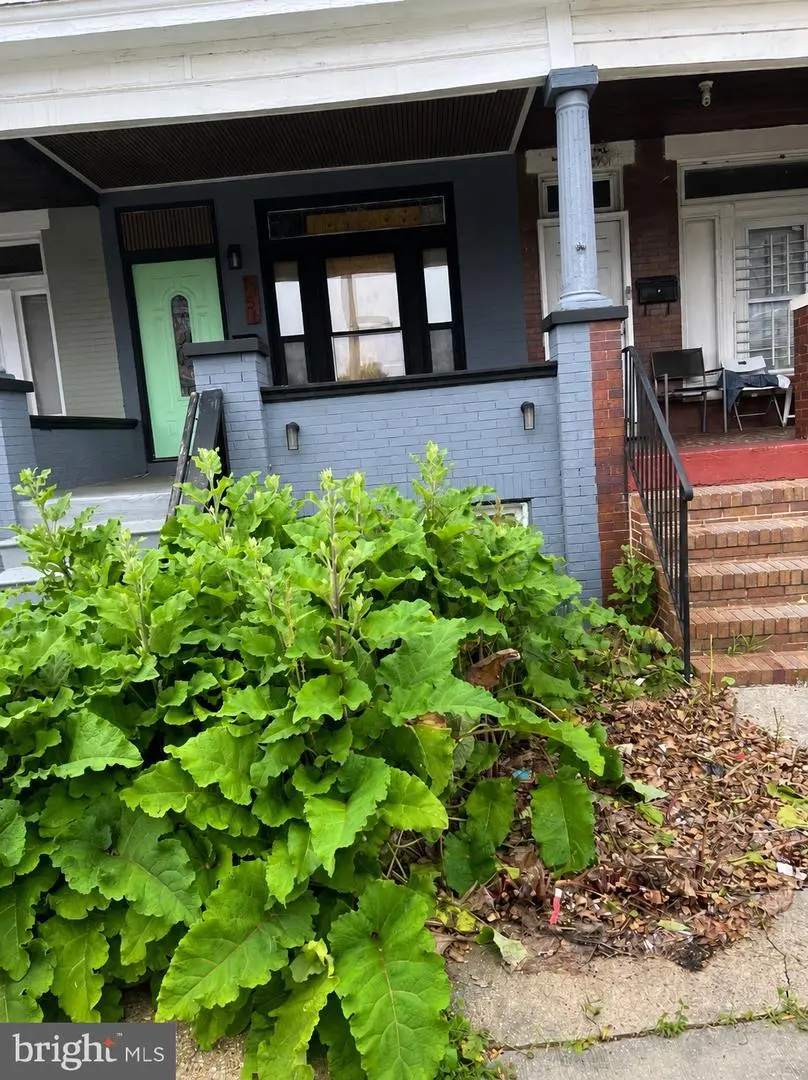
Listing remarks
Opportunity awaits! This 3-level interior townhome is ideal for a buyer, investor, or renovation enthusiast looking to complete an unfinished project and add significant value. The property was being renovated to feature 3 bedrooms and 3 full bathrooms The full basement spans the footprint of the home and includes a walkout to the rear. The renovation is incomplete, and the property is being sold strictly AS-IS. There is currently * * no electricity * * , so buyers and agents should bring a flashlight for showings. Buyers are responsible for conducting their own due diligence regarding permits, inspections, construction status, and any required approvals. Seller will make no repairs or
Key facts
- Built 1918
- Listed 21 days
Property features AI
Finance
- Financial info: Ownership interest: ground rent; Land assessed value reported; Improvement assessed value reported; Annual ground rent listed as income/expense item
Exterior
- Parking: On-street parking
- Utilities: Public water; Public sewer; Natural gas
- Home design: Interior townhouse/rowhouse; Estimated year built; Property condition: average; Located within city limits of Baltimore City
- Construction: Brick construction; Brick/mortar foundation; Other structures above and below grade
- Exterior features: On-street parking; Ground rent exists (annual payment of $1)
Interior
- Bedrooms: Three bedrooms on the first upper level
- Bathrooms: Two full bathrooms
- Heating & cooling: Central heating; Natural gas hot water
- Interior features: Full, unfinished basement with outside entrance; Living area reported by assessor
Neighborhood map
What this means for you Summary
Snapshot
- This is a 3-bed/1.0-bath townhouse listed at $125k.
Deal economics
- At list price, monthly cash flow is $533 ($6k/yr) — positive.
- The deal already cash-flows at list — no discount required.
- Meets the 1% rule at list price ($2k rent vs $125k).
- Recommended offer: $123k (1.5% below list) — sets the bar for market timing.
- Cap rate 11.4% vs local median 6.0% in Baltimore — top-decile yield for the area; either an underpriced asset or a hidden risk that comps aren't pricing in. Stress-test before assuming the spread holds.
Location & tenants
- Location reads 76/100 on livability (#90 in MD, #3,396 nationally) — a middle-class / working-renter tenant base. Strengths: amenities A+, commute A+, housing A+; Watch: crime F.
- Baltimore City Public Schools (urban): math 7% / reading 16% proficiency, ranked #24 of 24 in MD (top 100%) — low school quality limits family demand, transient renter base, plan for 1-2y turnover; 79% free/reduced lunch — lower-income household profile, screen leases tightly.
- Zoned schools: Belmont Elementary (math 2% / reading 2%, grade F, #826 of 860 statewide, top 100%, 181 students, 88% FRL).
- Market conditions: Rents rising fast (+6.1%/yr); 252 active listings in the ZIP; 40 comparable units currently listed for rent nearby; rentals at typical pace (median 25d on market — plan ~3-4 weeks tenant-placement turnaround); 42% of comp listings sitting > 30 days — soft ceiling on asking rent; lower-income renter base — watch delinquency; 1,273 units permitted in Baltimore city in 2024 (1,104 in 5+ unit buildings).
Forward outlook
- Local home prices are declining (-3.0%/yr); year-one equity from $864 of loan paydown is wiped out by about $4k of value loss. Plan a longer hold.
- Baltimore County population projected to shrink 4% by 2050 — rents likely to lag national; underwrite the cash flow, not the appreciation.
- At projected returns (-3.0% appreciation + 6.1% rent growth), your $35k cash investment doubles in ~6 years — after that, you're playing with house money.
Negotiation context
- It's been on market 22 days — a 2% lower offer ($123k) is reasonable based on typical stale-listing flexibility.
- 13 sale attempts since 19y ago; this cycle's ask has dropped $35k (22%) from the opening price — seller is motivated, your offer sets the floor, not the list.
- Current owner paid $100k; 25% above their basis — modest negotiation headroom, anchor on the comps not their cost.
Risks & watch-outs
- Watch-outs: built in 1918 — expect roof / HVAC / electrical / plumbing capex.
- Climate carrying-cost: major wind risk, 27% chance of damaging wind over 30y; extreme-heat days projected 7→15/yr by 2055 (HVAC capex compounding) — expect insurance premiums to compound above CPI over the hold.
Questions for the listing agent
- Built in 1918 — when were the roof, HVAC, electrical panel, plumbing, and water heater last replaced?
- Is there a deadline driving the sale (1031 exchange, divorce, estate, relocation)? That informs how much negotiation room exists.
- Schools are D-rated, which usually means shorter tenancies and higher turnover. Who's the typical renter profile here, and what's been the actual vacancy rate?
- Crime grade is F in this area — have there been break-ins, vandalism, or insurance claims at this property in the last 3 years? What carrier currently insures it and at what premium?
- What's the average days-on-market for RENTAL listings here right now (not sales)? A rising rental-DOM trend means longer vacancies and softer asking-rent achievability than the comps imply.
- What's the recent tenant-quality profile in this submarket — average credit score on applications, eviction rate, late-payment / NSF rate, and stable-employment percentage? A property-management company in the area should have these aggregated.
- How much new for-sale + rental construction is in the pipeline within 1–3 miles? Heavy new supply typically softens prices + rents 12–24 months out; constrained supply supports both.
Investment metrics
- 1% rule
- 1.41% ✓
- Cap rate
- 11.41%
- Cash-on-cash
- 18.27%
- DSCR
- 1.81
- GRM
- 5.9
CMA / ARV
- ARV (on-the-fly)
- $174,640
- Comps found
- 12
Show comp detail 12 sales within ~0.75 mi
| Address | Dist | Beds/Ba | Sqft | Sold | Price | $/sf | Match |
|---|---|---|---|---|---|---|---|
| 2920 Brighton St | 0.29mi | 3/2.5 | 1,440 (-3%) | 2mo | $247,500 | $172 | 75 |
| 1625 N Rosedale St | 0.39mi | 3/1.0 | 1,396 (-6%) | 2mo | $36,000 | $26 | 71 |
| 3018 Presstman St | 0.24mi | 4/2.0 (+1) | 1,400 (-5%) | 1mo | $108,000 | $77 | 70 |
| 3004 Brighton St | 0.28mi | 3/1.0 | 1,288 (-13%) | 1mo | $44,000 | $34 | 64 |
| 2404 W Lafayette Ave | 0.68mi | 3/2.0 | 1,476 (-0%) | 2mo | $135,000 | $91 | 62 |
| 1528 N Ellamont St | 0.33mi | 3/2.5 | 1,328 (-10%) | 1mo | $209,000 | $157 | 61 |
| 2514 W Lafayette Ave | 0.59mi | 3/2.0 | 1,560 (+5%) | 2mo | $232,000 | $149 | 58 |
| 3707 Colborne Rd | 0.67mi | 3/2.0 | 1,400 (-5%) | 1mo | $220,000 | $157 | 55 |
| 517 N Edgewood St | 0.69mi | 4/2.5 (+1) | 1,430 (-3%) | 2mo | $90,000 | $63 | 50 |
| 2400 W Lafayette Ave | 0.69mi | 4/2.0 (+1) | 1,584 (+7%) | 2mo | $263,000 | $166 | 46 |
| 1000 Mount Holly St | 0.70mi | 3/1.5 | 1,290 (-13%) | 1mo | $93,000 | $72 | 43 |
| 743 Linnard St | 0.53mi | 4/2.0 (+1) | 1,693 (+14%) | 1mo | $199,000 | $118 | 41 |
Match score weights: distance 35% · size 25% · config 20% · recency 20%. Top-matched comps best support the ARV.
Projected returns pro-forma
-3.0% appreciation · 6.1% rent growth · sell at horizon
- IRR
- 13.4%
- Equity multiple
- 1.55×
- Total profit
- $19,349
- Equity at exit
- $18,638
- IRR
- 24.5%
- Equity multiple
- 3.44×
- Total profit
- $85,340
- Equity at exit
- $10,808
Cash invested: $35,000 (down + closing). Projections, not guarantees.
Landlord ↔ Tenant lean methodology
- Overall (CITY)
- 12 Strongly Tenant-Friendly
- State Maryland
- 27 Tenant-Leaning · D+14
- County
- — inherits STATE
- City Baltimore
- 12 Strongly Tenant-Friendly · D+58
ZIP-level market 21216
- Rents YoY
- 6.1%
- Active inventory
- 252
- Price-to-rent
- 5.9×
Monthly cashflow live
- Estimated rent
- $1,757 high interval (Pro) →
- Mortgage (P&I)
- −$656
- Tax from tax record
- −$148 /mo · $1,773/yr
- Insurance
- −$52
- HOA
- −$0
- Vacancy / Maint / Mgmt
- −$369
- Net cashflow
- $533
Break-even live
Sensitivity live
| Price | -10% $604 | -5% $568 | +0% $533 | +5% $497 | +10% $462 |
|---|---|---|---|---|---|
| Rent | -10% $394 | -5% $463 | +0% $533 | +5% $602 | +10% $672 |
| Rate | -1.0pp $596 | -0.5pp $565 | base $533 | +0.5pp $500 | +1.0pp $467 |
UW: 25.0% down · 7.5% · 30yr · 1.5% tax · 5.0% vac · 8.0% maint · 8.0% mgmt
Financing live
Cash to close
- Down payment
- $31,250
- Closing costs
- $3,750
- Reserves months
- —
- Total cash needed
- —
Loan-product check · same deal, 3 products live
Conventional
25% down · 7.5% · 30yr
- Down + closing
- —
- Monthly P&I
- —
- Monthly cashflow
- —
- DSCR
- —
- Eligible?
- —
Personal DTI + credit; lowest rate.
DSCR
20% down · 8.5% · 30yr
- Down + closing
- —
- Monthly P&I
- —
- Monthly cashflow
- —
- DSCR
- —
- Eligible?
- —
No personal income docs; deal must DSCR.
Hard money
10% down · 12.0% · 12mo
- Down + closing
- —
- Monthly P&I
- —
- Monthly cashflow
- —
- DSCR
- —
- Eligible?
- —
Short-term bridge; refi at stabilization.
Rent comps 40 comps
| Address | Beds | Baths | Sqft | Rent | $/sqft | DOM | Units | Dist |
|---|---|---|---|---|---|---|---|---|
| 1042 Ellicott Dr Baltimore, MD | 2.0 | 1.0 | 900 | $1,450 | $1.61 | 45d | 1 | 0.07mi |
| 3238 Westmont Ave Baltimore, MD | 3.0 | 1.0 | 1280 | $1,600 | $1.25 | 45d | 1 | 0.17mi |
| 1402 Poplar Grove St Baltimore, MD | 4.0 | 1.5 | 1540 | $800 | $0.52 | 45d | 1 | 0.22mi |
| 3003 Presstman St Unit 2 Baltimore, MD | 2.0 | 1.0 | 1450 | $1,300 | $0.90 | 25d | 1 | 0.23mi |
| 3003 Presstman St Unit 1 Baltimore, MD | 2.0 | 2.0 | 1450 | $1,400 | $0.97 | 45d | 1 | 0.23mi |
| 2806 Riggs Ave Baltimore, MD | 3.0 | 2.5 | 1412 | $1,900 | $1.35 | 4d | 1 | 0.23mi |
| 2744 W Mosher St Baltimore, MD | 4.0 | 2.0 | 1412 | $2,100 | $1.49 | 25d | 1 | 0.29mi |
| 2728 Winchester St Baltimore, MD | 3.0 | 1.5 | 1260 | $1,800 | $1.43 | 4d | 1 | 0.29mi |
| 1513 N Ellamont St Baltimore, MD | 3.0 | 1.0 | 1700 | $1,700 | $1.00 | 25d | 1 | 0.29mi |
| 1530 N Rosedale St Baltimore, MD | 3.0 | 2.0 | 1641 | $1,895 | $1.15 | 16d | 1 | 0.31mi |
| 3015 Rayner Ave Baltimore, MD | 3.0 | 1.0 | 1152 | $1,350 | $1.17 | 45d | 1 | 0.33mi |
| 3127 Baker St Baltimore, MD | 3.0 | 1.0 | 1000 | $1,300 | $1.30 | 45d | 1 | 0.34mi |
| 2800 Presstman St Baltimore, MD | 3.0 | 2.5 | 1460 | $1,799 | $1.23 | 25d | 1 | 0.34mi |
| 3309 Brighton St Baltimore, MD | 3.0 | 1.0 | 1134 | $1,700 | $1.50 | 45d | 1 | 0.36mi |
| 780 Linnard St Baltimore, MD | 3.0 | 2.0 | 1224 | $1,590 | $1.30 | 45d | 1 | 0.45mi |
| 798 N Grantley St Baltimore, MD | 3.0 | 2.0 | 1360 | $2,295 | $1.69 | 25d | 1 | 0.46mi |
| 2922 Edmondson Ave Baltimore, MD | 3.0 | 2.0 | 1620 | $1,900 | $1.17 | 45d | 1 | 0.46mi |
| 787 N Grantley St Baltimore, MD | 3.0 | 1.0 | 1116 | $1,575 | $1.41 | 25d | 1 | 0.47mi |
| 3003 W North Ave Baltimore, MD | 1.0–2.0 | 1.0 | 841 | $935 | $1.11 | 3d | 3 | 0.54mi |
| 730 Linnard St Unit 1 Baltimore, MD | 4.0 | 1.0 | 1360 | $1,750 | $1.29 | 25d | 1 | 0.55mi |
| 3423 Edmondson Ave Baltimore, MD | 2.0 | 1.5 | 1400 | $1,710 | $1.22 | 45d | 1 | 0.61mi |
| 2636 Lauretta Ave Baltimore, MD | 3.0 | 2.5 | 1232 | $1,900 | $1.54 | 45d | 1 | 0.63mi |
| 623 N Grantley St Baltimore, MD | 4.0 | 2.0 | 1250 | $2,000 | $1.60 | 25d | 1 | 0.64mi |
| 2815 W Mulberry St Baltimore, MD | 4.0 | 2.0 | 1040 | $2,050 | $1.97 | 45d | 1 | 0.65mi |
| 3507 Edmondson Ave Baltimore, MD | 4.0 | 2.0 | 1428 | $2,300 | $1.61 | 45d | 1 | 0.66mi |
| 2609 Lauretta Ave Baltimore, MD | 3.0 | 1.0 | 1286 | $1,675 | $1.30 | 25d | 1 | 0.67mi |
| 2917 Clifton Ave Baltimore, MD | 4.0 | 4.0 | 1700 | $2,150 | $1.26 | 25d | 1 | 0.70mi |
| 3712 Gelston Dr Baltimore, MD | 3.0 | 2.0 | 1250 | $2,500 | $2.00 | 25d | 1 | 0.70mi |
| 2636 W North Ave Baltimore, MD | 2.0–3.0 | 1.0–2.0 | 975 | $1,475 | $1.51 | 5d | 1 | 0.72mi |
| 405 N Edgewood St Baltimore, MD | 4.0 | 2.0 | 1408 | $2,950 | $2.10 | 5d | 1 | 0.73mi |
| 2301 Riggs Ave Baltimore, MD | 3.0 | 2.0 | 1072 | $1,600 | $1.49 | 25d | 1 | 0.75mi |
| 2812 Clifton Ave Baltimore, MD | 3.0 | 1.5 | 1650 | $1,850 | $1.12 | 45d | 1 | 0.75mi |
| 918 N Bentalou St Baltimore, MD | 3.0 | 1.5 | 1485 | $1,750 | $1.18 | 45d | 1 | 0.78mi |
| 1617 Moreland Ave Baltimore, MD | 2.0 | 1.0 | 900 | $1,450 | $1.61 | 25d | 1 | 0.78mi |
| 2303 Calverton Heights Ave Baltimore, MD | 4.0 | 2.0 | 1314 | $2,250 | $1.71 | 25d | 1 | 0.79mi |
| 1617-A Moreland Ave Unit 2nd Flr Baltimore, MD | 2.0 | 1.0 | 1500 | $1,400 | $0.93 | 45d | 1 | 0.80mi |
| 3935 Stokes Dr #1 Baltimore, MD | 2.0 | 1.0 | 1150 | $1,400 | $1.22 | 45d | 1 | 0.80mi |
| 3017 Poplar Ter Baltimore, MD | 2.0 | 1.0 | 880 | $1,349 | $1.53 | 25d | 1 | 0.81mi |
| 3709 Nortonia Rd #2 Baltimore, MD | 2.0 | 1.0 | 1289 | $1,450 | $1.12 | 19d | 1 | 0.83mi |
| 202 N Edgewood St Baltimore, MD | 3.0 | 2.0 | 1710 | $2,250 | $1.32 | 25d | 1 | 0.84mi |
Listing history 15 events
-
2026-06-21pricedays on market $125,000 Active 22 DOM
-
2026-06-18days on market $160,000 Active 19 DOM
-
2026-06-17days on market $160,000 Active 18 DOM
-
2026-06-16days on market $160,000 Active 17 DOM
-
2026-06-15days on market $160,000 Active 16 DOM
-
2026-06-13days on market $160,000 Active 14 DOM
-
2026-06-09days on market $160,000 Active 10 DOM
-
2026-06-08days on market $160,000 Active 9 DOM
-
2026-06-07days on market $160,000 Active 8 DOM
-
2026-06-04days on market $160,000 Active 5 DOM
-
2026-06-03days on market $160,000 Active 4 DOM
-
2026-06-02days on market $160,000 Active 3 DOM
-
2026-06-01days on market $160,000 Active 2 DOM
-
2026-05-31remarks 699-char remark
-
2026-05-31$160,000 Active 1 DOM
ⓘ Source: listings_history table (triggers on properties + properties_extension) + one-shot
backfill from property_details.listing_events for pre-trigger history.
Tax reassessment forecast MD · Partial reset (capped growth)
- Current annual tax
- $1,773 · $148/mo
- Projected year-2 tax
- $1,773 · $148/mo
- Expected delta
- $0/yr ($0/mo · 0.0%)
ⓘ Screening estimate from a state-policy table — verify with the county assessor before closing.
Climate risk First Street
- Flood 1/10 Low FEMA zone X (unshaded) · 0% chance over 30 yrs
- Wildfire 1/10 Low
- Heat 7/10 Severe 7 d/yr ≥103°F today · 15 d/yr by 30 yrs out
- Wind 6/10 Major 27% chance of damaging wind over 30 yrs
- Air quality 3/10 Moderate 3 unhealthy d/yr today · 4 by 30 yrs out
Nearby sold comps map
Loading sold comps map…
Walkable amenities ~0.75 mi
Loading nearby amenities…
Taxation est. · year 1
- Rental income
- $21,085
- − Mortgage interest
- −$7,002
- − Property taxes
- −$1,773
- − Insurance
- −$625
- − Repairs & maintenance
- −$1,687
- − Management
- −$1,687
- − Depreciation
- −$3,636
- Taxable income
- $4,675
- Est. tax owed @ 24.0%
- −$1,122
- After-tax cash flow
- $5,271/yr
For passive investors: Depreciation is non-cash, so a rental often shows a tax loss while cash-flowing — sheltering income. Rental losses are passive: they offset passive income freely, and up to $25,000/yr can offset ordinary (W-2) income if you actively participate and your MAGI is under $100k (phasing out to $0 by $150k); unused losses carry forward. On sale, claimed depreciation is recaptured at up to 25%, and gains may owe capital-gains tax (a 1031 exchange can defer both). Figures are a year-1 estimate at your 24.0% rate — not tax advice; consult a CPA.
Schools (NCES district)
- District
- Baltimore City Public Schools
- NCES district ID
- 2400090
- Math proficiency
- 7% ▼ -9.00%
- Reading proficiency
- 16% ▼ -5.00%
- Median HH income
- $42,108
- Composite
- 10.08/100
- National rank
- #9805
- State rank
- #24 of 24 in MD
Livability — Baltimore
- Score
- 76/100
- State rank
- #90
- US rank
- #3396
Category grades
Schools grade is shown separately in the Schools card above.
Census & demographics
- Census place
- Baltimore, MD
- County
- Baltimore City · 558,601 people
- City population
- 588,727
- Metro
- Baltimore-Columbia-Towson, MD
- Population (ZIP)
- 29,426
- Household income
- $42,031
- Rent vs Own
- Severe rent burden
- 2264.0
Population outlook (Baltimore County) Hauer SSP2
- Today (2025)
- 624,249 people
- By 2030
- 621,541 · -0.4%
- By 2040
- 609,756 · -2.3%
- By 2050
- 597,249 · -4.3%
- By 2075
- 552,236 · -11.5%
- By 2100
- 513,934 · -17.7%
Race, ethnicity, and origin ACS 2023
- Neighborhood character
- Predominantly Black (91%)
- Race & ethnicity
- Black 91% Hispanic / Latino 4% Two or more races 3% White 2%
- Foreign-born
- 3% · Canada
- Languages at home
- 96% English-only · Spanish 3% French/Haitian/Cajun 1%
Political lean MEDSL · Baltimore
- 2024 margin
- Solid D (+73.0) · D 85.2% · R 12.2% · Other 2.6%
- 2008→2024 swing
- -2.5pp toward R · 2008: 75.5pp · 2024: 73.0pp
- All cycles
- 2024: D+73.0 2020: D+76.6 2016: D+74.6 2012: D+76.4 2008: D+75.5
Not yet ingested
- Civics
- —
Market trends
- HPI YoY
- ▼ -107.42%
- Current HPI
- 164.3933
- Rent YoY
- ▲ 6.10%
- Metro
- Baltimore-Columbia-Towson, MD
- State GDP YoY
- ▲ 2.97%
- F500 in state
- 12
Industry mix (Fortune 500 HQ in MD)
| Industry | F500 HQs | Revenue |
|---|---|---|
| Aerospace / Defense | 1 | $71B |
|
||
| Utilities | 1 | $25B |
|
||
| Hotels | 1 | $24B |
|
||
| Consumer Goods | 1 | $7B |
|
||
| Real Estate | 1 | $6B |
|
||
| Chemicals | 1 | $2B |
|
||
Price history
+131.9% since first listed37 events — show timeline
- 2026-05-30 Listed $160,000 BRIGHT MLS
- 2024-01-17 Sold (Public Records) $100,000 Public Records
- 2022-03-08 Sold (Public Records) $90,000 Public Records
- 2019-09-13 Sold (Public Records) $73,500 Public Records
- 2018-10-01 Listing Removed — BRIGHT MLS
- 2018-10-01 Delisted — MRIS
- 2018-06-14 Listed $39,999 BRIGHT MLS
- 2018-06-14 Listed — MRIS
- 2015-04-30 Sold (MLS) $14,000 MRIS
- 2015-04-30 Sold (MLS) $14,000 BRIGHT MLS
- 2015-04-09 Pending — MRIS
- 2015-02-26 Listed $14,900 MRIS
- 2010-09-17 Delisted — MRIS
- 2010-09-16 Listing Removed — BRIGHT MLS
- 2010-09-10 Price Changed — MRIS
- 2010-09-04 Relisted — MRIS
- 2010-09-04 Price Changed — MRIS
- 2010-09-02 Delisted — MRIS
- 2010-07-05 Price Changed — MRIS
- 2010-06-22 Relisted — MRIS
- 2010-06-22 Price Changed — MRIS
- 2010-06-11 Delisted — MRIS
- 2010-06-01 Price Changed — MRIS
- 2010-05-28 Delisted — MRIS
- 2010-05-28 Listing Removed — BRIGHT MLS
- 2010-05-20 Listed — MRIS
- 2010-05-19 Listed $40,500 BRIGHT MLS
- 2010-01-05 Listed — MRIS
- 2010-01-05 Listed $80,000 BRIGHT MLS
- 2009-12-21 Delisted — MRIS
- 2009-12-21 Listing Removed — BRIGHT MLS
- 2009-08-13 Listed — MRIS
- 2009-08-13 Listed $83,900 BRIGHT MLS
- 2008-01-07 Sold (Public Records) $61,200 Public Records
- 2007-12-07 Sold (MLS) $61,200 MRIS
- 2007-10-26 Delisted — MRIS
- 2007-10-10 Listed $69,000 MRIS
Property tax history
+1.7%/yrLatest (2025): $1,773 · +20.3% YoY. Source: county tax records.
Cash-flow waterfall
monthlySold comps — $/sqft
last 12 mo · ≤1 miLoading sold comps…