64 Floyd St · Carrollton, KY
Flood risk 8/10 · Major
- FEMA flood zone
- X (unshaded)
- Chance of flooding over 30 yrs
- 0.99%
- Est. flood insurance / yr
- $507 – $1,088
Fire risk 3/10 · Minor
- Est. fire insurance / yr
- $839 – $1,559
Heat risk 5/10 · Moderate
- Hot days now (above 104°F)
- 7 days/yr
- Hot days in 30 yrs
- 20 days/yr
Wind risk 2/10 · Minimal
- Chance of severe wind over 30 yrs
- 2.0%
Air-quality risk 3/10 · Minor
- Unhealthy air days now
- 2 days/yr
- Unhealthy air days in 30 yrs
- 4 days/yr
Risk factors via First Street. Map © Google.
Why this score? — see what drove the B+ grade
The composite is a weighted blend of 9 inputs, each scored 0–100. Each bar is that input's sub-score; the figure is the points it added to the 100-point composite (weight × sub-score).
- Cash flow +30.0/30.0
- DSCR +10.0/10.0
- Appreciation +10.0/10.0
- 1% rule +7.7/10.0
- ARV discount +7.5/15.0
- Livability +3.6/5.0
- Rent growth +2.5/5.0
- Condition / age +2.2/5.0
- Schools +1.5/10.0
$89,900
🖨 Deal sheet 📄 Offer letter ✓ Due diligence
Key facts
- Built 2020
- Listed 19 days
Property features AI
Finance
- HOA & community: No association fee
Exterior
- Parking: Front entry parking
- Utilities: Electricity connected
- Home design: Residential property; Other architectural style; Single-story (1 story); Built in 2020; First-floor entry
- Construction: Vinyl siding exterior; Shingle roof; Built in 2020
- Exterior features: Located in Oakview Estates subdivision
Interior
- Kitchen: Kitchen on the first floor
- Bedrooms: 3 bedrooms, all on the first floor; Primary bedroom located on the first floor
- Bathrooms: 2 full bathrooms
- Heating & cooling: Natural gas heating; Central air conditioning; One HVAC unit
- Interior features: Total of 6 rooms; 5 closets; No basement; Family room on the first floor
- Laundry & utility: Laundry room on the first floor
Neighborhood map
What this means for you Summary
Snapshot
- This is a 3-bed/2.0-bath manufactured listed at $90k. Condition is rated fair.
Deal economics
- At list price, monthly cash flow is $276 ($3k/yr) — positive.
- The deal already cash-flows at list — no discount required.
- Meets the 1% rule at list price ($1k rent vs $90k).
- Recommended offer: $89k (1.5% below list) — sets the bar for market timing.
- Cap rate 10.9% vs local median 3.3% in Carrollton — top-decile yield for the area; either an underpriced asset or a hidden risk that comps aren't pricing in. Stress-test before assuming the spread holds.
Location & tenants
- Location reads 72/100 on livability (#129 in KY) — a middle-class / working-renter tenant base. Strengths: crime A+, cost of living A+, housing A+; Watch: schools D, amenities F, commute F.
- Carroll County (town): math 12% / reading 23% proficiency, ranked #163 of 165 in KY (top 99%) — low school quality limits family demand, transient renter base, plan for 1-2y turnover.
- Market conditions: 61 active listings in the ZIP; 3 units permitted in Carroll County in 2024 (0 in 5+ unit buildings).
Forward outlook
- In year one you build about $10k of equity ($622 loan paydown + $9k appreciation (10.0% local appreciation)).
- Carroll County population projected at -15% by 2050 — secular population decline; favor cash flow + early exit over multi-decade hold.
- At projected returns (10.0% appreciation + 3.0% rent growth), your $25k cash investment doubles in ~2 years — after that, you're playing with house money.
- By year 4, paydown + projected appreciation supports a ~$34k cash-out refi (75% LTV) — recoverable capital for the next deal without selling this one.
Negotiation context
- It's been on market 20 days — a 2% lower offer ($89k) is reasonable based on typical stale-listing flexibility.
- Current owner paid $61k; 47% above their basis — modest negotiation headroom, anchor on the comps not their cost.
Risks & watch-outs
- Watch-outs: flood insurance adds $66/mo.
- Climate carrying-cost: severe flood risk; extreme-heat days projected 7→20/yr by 2055 (HVAC capex compounding) — expect insurance premiums to compound above CPI over the hold.
Questions for the listing agent
- Have any recent inspections been done? Can we get a copy of the seller's disclosures and any deferred-maintenance estimates?
- What's the actual annual flood-insurance premium (NFIP or private), and is the property in a SFHA with mandatory coverage?
- Is there a deadline driving the sale (1031 exchange, divorce, estate, relocation)? That informs how much negotiation room exists.
- Schools are D-rated, which usually means shorter tenancies and higher turnover. Who's the typical renter profile here, and what's been the actual vacancy rate?
- What's the average days-on-market for RENTAL listings here right now (not sales)? A rising rental-DOM trend means longer vacancies and softer asking-rent achievability than the comps imply.
- What's the recent tenant-quality profile in this submarket — average credit score on applications, eviction rate, late-payment / NSF rate, and stable-employment percentage? A property-management company in the area should have these aggregated.
- How much new for-sale + rental construction is in the pipeline within 1–3 miles? Heavy new supply typically softens prices + rents 12–24 months out; constrained supply supports both.
Investment metrics
- 1% rule
- 1.27% ✓
- Cap rate
- 10.87%
- Cash-on-cash
- 16.34%
- DSCR
- 1.73
- GRM
- 6.6
CMA / ARV
No comps found within radius.
Projected returns pro-forma
10.0% appreciation · 3.0% rent growth · sell at horizon
- IRR
- 34.0%
- Equity multiple
- 3.65×
- Total profit
- $66,582
- Equity at exit
- $80,989
- IRR
- 29.3%
- Equity multiple
- 8.24×
- Total profit
- $182,271
- Equity at exit
- $174,656
Cash invested: $25,172 (down + closing). Projections, not guarantees.
Landlord ↔ Tenant lean methodology
- Overall (STATE)
- 83 Strongly Landlord-Friendly
- State Kentucky
- 83 Strongly Landlord-Friendly · R+16
- County
- — inherits STATE
- City
- — inherits STATE
ZIP-level market 41008
- Home prices YoY
- 16.4%
- Active inventory
- 61
- Price-to-rent
- 6.6×
Monthly cashflow live
- Estimated rent
- $1,141 medium interval (Pro) →
- Mortgage (P&I)
- −$471
- Tax from tax record
- −$50 /mo · $599/yr
- Insurance
- −$37
- Flood insurance flood zone
- −$66 /mo · $798/yr
- HOA
- −$0
- Vacancy / Maint / Mgmt
- −$240
- Net cashflow
- $276
Break-even live
UW: 25.0% down · 7.5% · 30yr · 1.5% tax · 5.0% vac · 8.0% maint · 8.0% mgmt
Financing live
Cash to close
- Down payment
- $22,475
- Closing costs
- $2,697
- Reserves months
- —
- Total cash needed
- —
Loan-product check · same deal, 3 products live
Conventional
25% down · 7.5% · 30yr
- Down + closing
- —
- Monthly P&I
- —
- Monthly cashflow
- —
- DSCR
- —
- Eligible?
- —
Personal DTI + credit; lowest rate.
DSCR
20% down · 8.5% · 30yr
- Down + closing
- —
- Monthly P&I
- —
- Monthly cashflow
- —
- DSCR
- —
- Eligible?
- —
No personal income docs; deal must DSCR.
Hard money
10% down · 12.0% · 12mo
- Down + closing
- —
- Monthly P&I
- —
- Monthly cashflow
- —
- DSCR
- —
- Eligible?
- —
Short-term bridge; refi at stabilization.
Listing history 2 events
-
2026-05-07$89,900 Active
-
2023-12-01soldstatus $61,000
ⓘ Source: listings_history table (triggers on properties + properties_extension) + one-shot
backfill from property_details.listing_events for pre-trigger history.
Tax reassessment forecast KY · Resets to sale price
- Current annual tax
- $599 · $50/mo
- Projected year-2 tax
- $773 · $64/mo
- Expected delta
- +$174/yr (+$14/mo · 29.0%)
ⓘ Screening estimate from a state-policy table — verify with the county assessor before closing.
Climate risk First Street
- Flood 8/10 Severe FEMA zone X (unshaded) · 99% chance over 30 yrs
- Wildfire 3/10 Moderate
- Heat 5/10 Major 7 d/yr ≥104°F today · 20 d/yr by 30 yrs out
- Wind 2/10 Low 2% chance of damaging wind over 30 yrs
- Air quality 3/10 Moderate 2 unhealthy d/yr today · 4 by 30 yrs out
Nearby sold comps map
Loading sold comps map…
Walkable amenities ~0.75 mi
Loading nearby amenities…
Taxation est. · year 1
- Rental income
- $13,696
- − Mortgage interest
- −$5,036
- − Property taxes
- −$599
- − Insurance
- −$1,247
- − Repairs & maintenance
- −$1,096
- − Management
- −$1,096
- − Depreciation
- −$2,615
- Taxable income
- $2,007
- Est. tax owed @ 24.0%
- −$482
- After-tax cash flow
- $2,834/yr
For passive investors: Depreciation is non-cash, so a rental often shows a tax loss while cash-flowing — sheltering income. Rental losses are passive: they offset passive income freely, and up to $25,000/yr can offset ordinary (W-2) income if you actively participate and your MAGI is under $100k (phasing out to $0 by $150k); unused losses carry forward. On sale, claimed depreciation is recaptured at up to 25%, and gains may owe capital-gains tax (a 1031 exchange can defer both). Figures are a year-1 estimate at your 24.0% rate — not tax advice; consult a CPA.
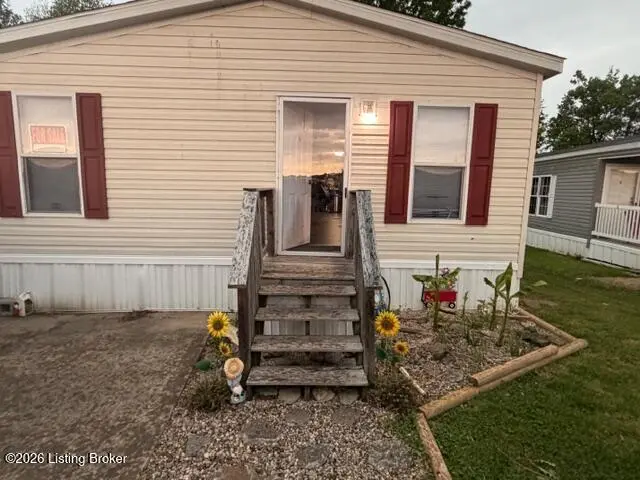
Condition & rehab AI · 9 photos
This manufactured home requires moderate renovations, including repairs to the siding, foundation, and HVAC, as well as maintenance to the interior walls and countertops. These updates will significantly increase its resale and rental value.
Repairs flagged
- Major siding — deteriorating condition
- Major foundation — visible settling
- Major HVAC — not visible but likely outdated
Value-add opportunities
- Both paint interior walls — enhances curb appeal and interior aesthetics
- Both replace countertops — improves functionality and aesthetics
- Both repair foundation — stabilizes structure and improves value
- Both replace HVAC — increases comfort and energy efficiency
Renovation cost estimate screening
| Repair item | Severity | Est. cost |
|---|---|---|
| siding · deteriorating condition | Major | $15,000–50,000 |
| foundation · visible settling | Major | $15,000–50,000 |
| HVAC · not visible but likely outdated | Major | $15,000–50,000 |
| Total estimated repair cost · 3 items | $45,000–150,000 |
Value-add ROI direction
- Both paint interior walls — enhances curb appeal and interior aesthetics ↑
- Both replace countertops — improves functionality and aesthetics ↑
- Both repair foundation — stabilizes structure and improves value ↑
- Both replace HVAC — increases comfort and energy efficiency ↑
ⓘ Cost ranges are severity-bucket heuristics (US national rule-of-thumb). Get contractor quotes + a written scope before underwriting a rehab budget.
Schools (NCES district)
- District
- Carroll County
- NCES district ID
- 2100990
- Math proficiency
- 12% ▼ -14.00%
- Reading proficiency
- 23% ▼ -15.00%
- Median HH income
- $41,646
- Composite
- 15.0/100
- National rank
- #9361
- State rank
- #163 of 165 in KY
Livability — Carrollton
- Score
- 72/100
- State rank
- #129
- US rank
- #6156
Category grades
Schools grade is shown separately in the Schools card above.
Census & demographics
- Population (ZIP)
- 7,754
Population outlook (Carroll County) Hauer SSP2
- Today (2025)
- 10,359 people
- By 2030
- 10,058 · -2.9%
- By 2040
- 9,465 · -8.6%
- By 2050
- 8,788 · -15.2%
- By 2075
- 7,079 · -31.7%
- By 2100
- 5,066 · -51.1%
Race, ethnicity, and origin ACS 2023
- Neighborhood character
- Predominantly White (85%)
- Race & ethnicity
- White 85% Hispanic / Latino 9% Two or more races 8% Black 3%
- Hispanic origin (detail)
- Mexican 7%
- Common ancestry
- Iranian 2% Lithuanian 1% Slovak 1%
- Foreign-born
- 3% · Canada
- Languages at home
- 91% English-only · Spanish 6% German/W. Germanic 2%
Political lean MEDSL · Carroll
- 2024 margin
- Solid R (+51.0) · D 23.9% · R 74.9% · Other 1.2%
- 2008→2024 swing
- -42.7pp toward R · 2008: -8.2pp · 2024: -51.0pp
- All cycles
- 2024: R+51.0 2020: R+44.4 2016: R+38.5 2012: R+10.1 2008: R+8.2
Not yet ingested
- Civics
- —
Market trends
- HPI YoY
- ▲ 37.93%
- Current HPI
- 269.52
- Rent YoY
- —
- Metro
- —
- State GDP YoY
- ▲ 1.81%
- F500 in state
- 4
Industry mix (Fortune 500 HQ in KY)
| Industry | F500 HQs | Revenue |
|---|---|---|
| Healthcare | 1 | $118B |
|
||
| Food / Beverage | 1 | $7B |
|
||
Price history
+47.4% since first listed2 events — show timeline
- 2026-05-07 Listed $89,900 Metro Search MLS
- 2023-12-01 Sold (Public Records) $61,000 Public Records
Property tax history
-1.9%/yrLatest (2025): $599 · -12.0% YoY. Source: county tax records.
Cash-flow waterfall
monthlySold comps — $/sqft
last 12 mo · ≤1 miLoading sold comps…