132 Thurman Flurry Rd · Benndale, MS
Flood risk 1/10 · Minimal
- FEMA flood zone
- X (unshaded)
- Chance of flooding over 30 yrs
- 0.0%
- Est. flood insurance / yr
- $507 – $1,088
Fire risk 6/10 · Moderate
- Est. fire insurance / yr
- $1,241 – $2,305
Heat risk 8/10 · Major
- Hot days now (above 106°F)
- 7 days/yr
- Hot days in 30 yrs
- 20 days/yr
Wind risk 9/10 · Severe
- Chance of severe wind over 30 yrs
- 99.0%
Air-quality risk 1/10 · Minimal
- Unhealthy air days now
- 0 days/yr
- Unhealthy air days in 30 yrs
- 0 days/yr
Risk factors via First Street. Map © Google.
Why this score? — see what drove the C- grade
The composite is a weighted blend of 9 inputs, each scored 0–100. Each bar is that input's sub-score; the figure is the points it added to the 100-point composite (weight × sub-score).
- Cash flow +22.5/30.0
- ARV discount +7.5/15.0
- DSCR +7.2/10.0
- 1% rule +5.4/10.0
- Schools +3.7/10.0
- Rent growth +2.5/5.0
- Livability +2.5/5.0
- Condition / age +2.5/5.0
- Appreciation +0.0/10.0
$155,000
🖨 Deal sheet 📄 Offer letter ✓ Due diligence
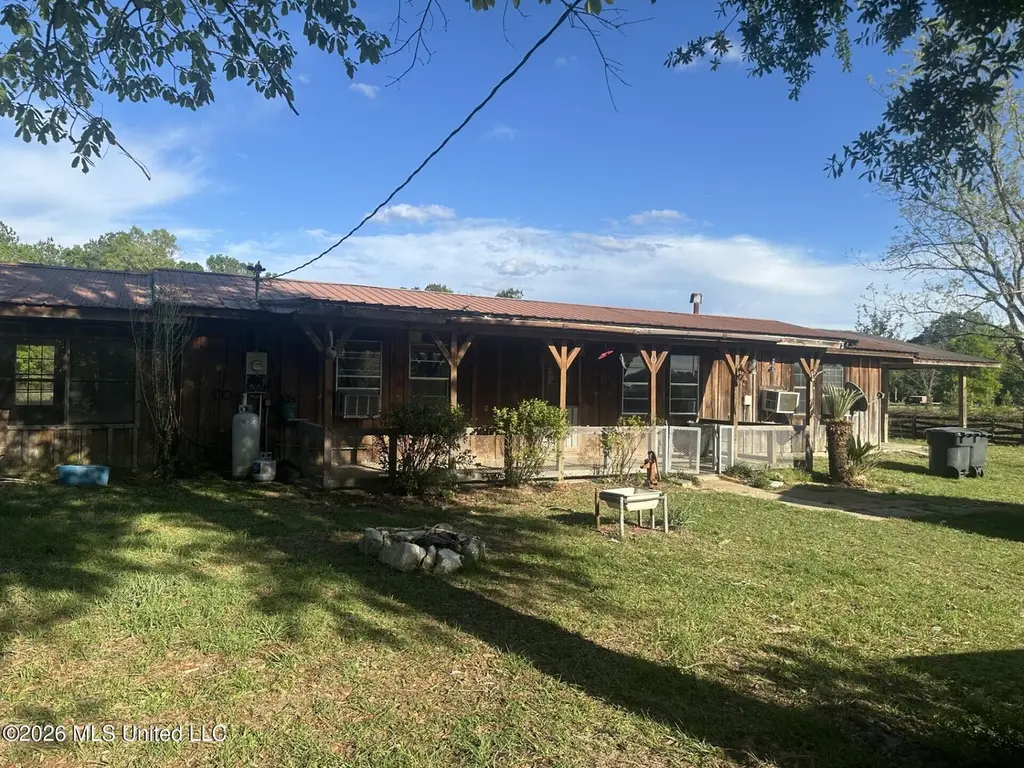
Listing remarks
Escape to the quiet countryside with this 6-acre retreat in the Perkinston area! This property is a dream for those looking for a mini-farm or a rustic fixer-upper with endless potential. The 3-bedroom, 1-bathroom home features a classic large front porch perfect for rocking chairs and a convenient attached carport. The acreage is ready for work or play, featuring both a barn and a workshop, offering plenty of space for equipment, livestock, or DIY projects. While the home needs some TLC, its rustic charm and expansive, private lot provide the perfect canvas for your vision. Whether you're looking to renovate a country gem or find a peaceful homesite with existing infrastructure, this prope
Key facts
- Private lot
- Attached carport
- Large front porch
Tags
Neighborhood map
What this means for you Summary
Snapshot
- This is a 3-bed/1.0-bath single-family listed at $155k.
Deal economics
- At list price, monthly cash flow is $261 ($3k/yr) — positive.
- The deal already cash-flows at list — no discount required.
- Meets the 1% rule at list price ($2k rent vs $155k).
Location & tenants
- Location reads: area grade C — affects rentability + tenant quality, not the cash-flow math above.
- George County School District (rural): math 45% / reading 42% proficiency, ranked #30 of 130 in MS (top 23%) — families likely to look elsewhere, expect single-tenant / working-renter base with shorter leases; 60% free/reduced lunch — lower-income household profile, screen leases tightly.
- Market conditions: 84 active listings in the ZIP; 30 units permitted in George County in 2024 (0 in 5+ unit buildings).
Forward outlook
- Local home prices are declining (-3.0%/yr); year-one equity from $1k of loan paydown is wiped out by about $5k of value loss. Plan a longer hold.
- George County population projected at +4% by 2050 — modest demand growth; plan on rents tracking national, not racing it.
Negotiation context
- Only 6 days on market — expect competitive offers; lowballing is unlikely to land.
Risks & watch-outs
- Climate carrying-cost: severe wind risk, 99% chance of damaging wind over 30y; major wildfire risk; extreme-heat days projected 7→20/yr by 2055 (HVAC capex compounding) — expect insurance premiums to compound above CPI over the hold.
Questions for the listing agent
- Is there a deadline driving the sale (1031 exchange, divorce, estate, relocation)? That informs how much negotiation room exists.
- What's the average days-on-market for RENTAL listings here right now (not sales)? A rising rental-DOM trend means longer vacancies and softer asking-rent achievability than the comps imply.
- What's the recent tenant-quality profile in this submarket — average credit score on applications, eviction rate, late-payment / NSF rate, and stable-employment percentage? A property-management company in the area should have these aggregated.
- How much new for-sale + rental construction is in the pipeline within 1–3 miles? Heavy new supply typically softens prices + rents 12–24 months out; constrained supply supports both.
Investment metrics
- 1% rule
- 1.04% ✓
- Cap rate
- 8.31%
- Cash-on-cash
- 7.21%
- DSCR
- 1.32
- GRM
- 8.0
CMA / ARV
- ARV (on-the-fly)
- $155,040
- Comps found
- 1
Show comp detail 1 sale within ~0.75 mi
| Address | Dist | Beds/Ba | Sqft | Sold | Price | $/sf | Match |
|---|---|---|---|---|---|---|---|
| 132 Thurman Flurry Rd | 0.00mi | 3/1.0 | 1,824 (0%) | 1mo | $155,000 | $85 | 99 |
Match score weights: distance 35% · size 25% · config 20% · recency 20%. Top-matched comps best support the ARV.
Projected returns pro-forma
-3.0% appreciation · 3.0% rent growth · sell at horizon
- IRR
- -5.3%
- Equity multiple
- 0.80×
- Total profit
- $-8,526
- Equity at exit
- $23,111
- IRR
- 4.4%
- Equity multiple
- 1.32×
- Total profit
- $13,902
- Equity at exit
- $13,402
Cash invested: $43,400 (down + closing). Projections, not guarantees.
Landlord ↔ Tenant lean methodology
- Overall (STATE)
- 90 Strongly Landlord-Friendly
- State Mississippi
- 90 Strongly Landlord-Friendly · R+11
- County
- — inherits STATE
- City
- — inherits STATE
ZIP-level market 39573
- Home prices YoY
- -12.6%
- Active inventory
- 84
- Price-to-rent
- 8.0×
Monthly cashflow live
- Estimated rent
- $1,609 medium interval (Pro) →
- Mortgage (P&I)
- −$813
- Tax from tax record
- −$133 /mo · $1,598/yr
- Insurance
- −$65
- HOA
- −$0
- Vacancy / Maint / Mgmt
- −$338
- Net cashflow
- $261
Break-even live
UW: 25.0% down · 7.5% · 30yr · 1.5% tax · 5.0% vac · 8.0% maint · 8.0% mgmt
Financing live
Cash to close
- Down payment
- $38,750
- Closing costs
- $4,650
- Reserves months
- —
- Total cash needed
- —
Loan-product check · same deal, 3 products live
Conventional
25% down · 7.5% · 30yr
- Down + closing
- —
- Monthly P&I
- —
- Monthly cashflow
- —
- DSCR
- —
- Eligible?
- —
Personal DTI + credit; lowest rate.
DSCR
20% down · 8.5% · 30yr
- Down + closing
- —
- Monthly P&I
- —
- Monthly cashflow
- —
- DSCR
- —
- Eligible?
- —
No personal income docs; deal must DSCR.
Hard money
10% down · 12.0% · 12mo
- Down + closing
- —
- Monthly P&I
- —
- Monthly cashflow
- —
- DSCR
- —
- Eligible?
- —
Short-term bridge; refi at stabilization.
Listing history 3 events
-
2026-04-19status Pending
-
2026-04-13$155,000 Active
-
2005-02-23soldstatus
ⓘ Source: listings_history table (triggers on properties + properties_extension) + one-shot
backfill from property_details.listing_events for pre-trigger history.
Tax reassessment forecast MS · Resets to sale price
- Current annual tax
- $1,598 · $133/mo
- Projected year-2 tax
- $1,598 · $133/mo
- Expected delta
- $0/yr ($0/mo · 0.0%)
ⓘ Screening estimate from a state-policy table — verify with the county assessor before closing.
Climate risk First Street
- Flood 1/10 Low FEMA zone X (unshaded) · 0% chance over 30 yrs
- Wildfire 6/10 Major
- Heat 8/10 Severe 7 d/yr ≥106°F today · 20 d/yr by 30 yrs out
- Wind 9/10 Extreme 99% chance of damaging wind over 30 yrs
- Air quality 1/10 Low 0 unhealthy d/yr today · 0 by 30 yrs out
Nearby sold comps map
Loading sold comps map…
Walkable amenities ~0.75 mi
Loading nearby amenities…
Taxation est. · year 1
- Rental income
- $19,310
- − Mortgage interest
- −$8,682
- − Property taxes
- −$1,598
- − Insurance
- −$775
- − Repairs & maintenance
- −$1,545
- − Management
- −$1,545
- − Depreciation
- −$4,509
- Taxable income
- $656
- Est. tax owed @ 24.0%
- −$158
- After-tax cash flow
- $2,971/yr
For passive investors: Depreciation is non-cash, so a rental often shows a tax loss while cash-flowing — sheltering income. Rental losses are passive: they offset passive income freely, and up to $25,000/yr can offset ordinary (W-2) income if you actively participate and your MAGI is under $100k (phasing out to $0 by $150k); unused losses carry forward. On sale, claimed depreciation is recaptured at up to 25%, and gains may owe capital-gains tax (a 1031 exchange can defer both). Figures are a year-1 estimate at your 24.0% rate — not tax advice; consult a CPA.
Schools (NCES district)
- District
- George County School District
- NCES district ID
- 2801560
- Math proficiency
- 45% ▲ 1.00%
- Reading proficiency
- 42% ▼ -1.00%
- Median HH income
- $45,139
- Composite
- 36.95/100
- National rank
- #4533
- State rank
- #30 of 130 in MS
Livability — Benndale
No livability data for this city. (Only ~50 U.S. cities are tracked.)
Census & demographics
- Population (ZIP)
- 9,770
Population outlook (George County) Hauer SSP2
- Today (2025)
- 24,439 people
- By 2030
- 24,823 · +1.6%
- By 2040
- 25,399 · +3.9%
- By 2050
- 25,410 · +4.0%
- By 2075
- 24,603 · +0.7%
- By 2100
- 21,067 · -13.8%
Race, ethnicity, and origin ACS 2023
- Neighborhood character
- Predominantly White (87%)
- Race & ethnicity
- White 87% Two or more races 6% Black 4% Hispanic / Latino 4%
- Common ancestry
- Lithuanian 6% Serbian 2% Italian 1%
- Foreign-born
- 1% · China
- Languages at home
- 98% English-only · Spanish 1%
Political lean MEDSL · George
- 2024 margin
- Solid R (+78.8) · D 10.3% · R 89.1%
- 2008→2024 swing
- -12.7pp toward R · 2008: -66.1pp · 2024: -78.8pp
- All cycles
- 2024: R+78.8 2020: R+76.8 2016: R+77.7 2012: R+71.2 2008: R+66.1
Not yet ingested
- Civics
- —
Market trends
- HPI YoY
- ▼ -26.85%
- Current HPI
- 185.9356
- Rent YoY
- —
- Metro
- —
- State GDP YoY
- —
- F500 in state
- 0
Price history
3 events — show timeline
- 2026-04-19 Pending — MLSU
- 2026-04-13 Listed $155,000 MLSU
- 2005-02-23 Sold (Public Records) — Public Records
Property tax history
+9.3%/yrLatest (2025): $1,598 · +15.1% YoY. Source: county tax records.
Cash-flow waterfall
monthlySold comps — $/sqft
last 12 mo · ≤1 miLoading sold comps…