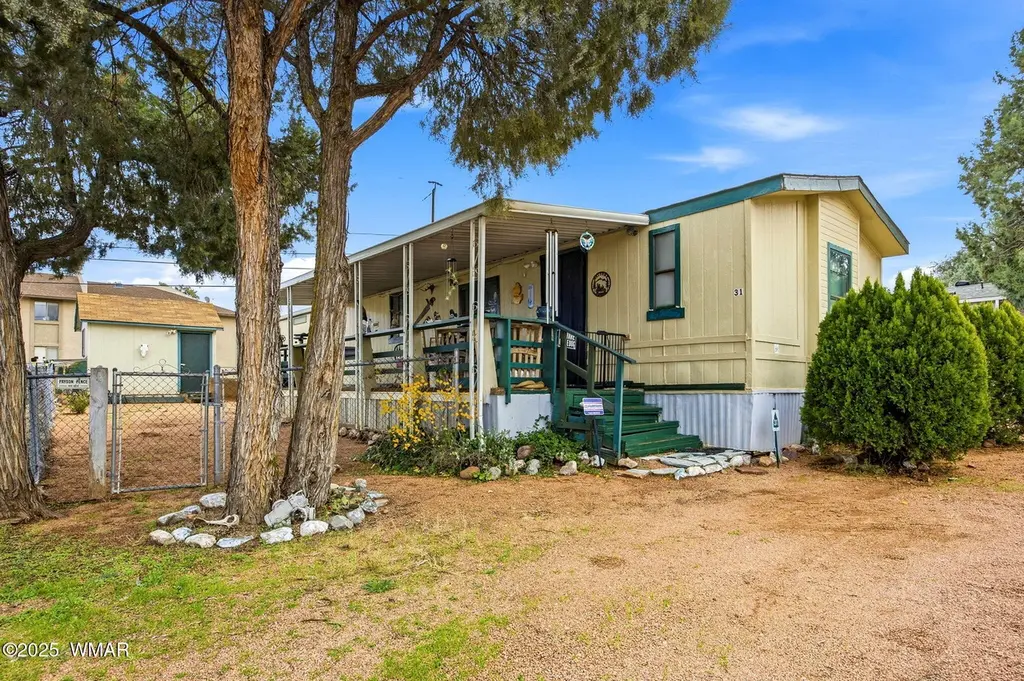
703 E Frontier St #31 · Payson, AZ
Flood risk 6/10 · Moderate
- FEMA flood zone
- X (unshaded)
- Chance of flooding over 30 yrs
- 0.72%
- Est. flood insurance / yr
- $507 – $1,088
Fire risk 8/10 · Major
- Est. fire insurance / yr
- $610 – $1,132
Heat risk 4/10 · Minor
- Hot days now (above 96°F)
- 7 days/yr
- Hot days in 30 yrs
- 19 days/yr
Wind risk 1/10 · Minimal
- Chance of severe wind over 30 yrs
- —
Air-quality risk 1/10 · Minimal
- Unhealthy air days now
- 0 days/yr
- Unhealthy air days in 30 yrs
- 0 days/yr
Risk factors via First Street. Map © Google.
Why this score? — see what drove the C+ grade
The composite is a weighted blend of 9 inputs, each scored 0–100. Each bar is that input's sub-score; the figure is the points it added to the 100-point composite (weight × sub-score).
- Cash flow +30.0/30.0
- 1% rule +10.0/10.0
- DSCR +10.0/10.0
- Livability +3.5/5.0
- Rent growth +2.5/5.0
- Schools +2.2/10.0
- Condition / age +2.2/5.0
- ARV discount +0.0/15.0
- Appreciation +0.0/10.0
$89,900
🖨 Deal sheet (PDF) 📄 Offer letter ✓ Due diligence
Listing remarks MLS
Escape the desert heat and embrace the mountain lifestyle in this well-maintained 3-bedroom, 2-bath manufactured home in Payson. Nestled among the pines in a friendly 55+ community, you'll enjoy cooler temperatures, stunning natural beauty, and the relaxed pace of small-town Arizona living, all with convenient access to shopping, dining, and medical services. Lot rent is $450/mo. Additional monthly fees include water (metered, base rate $59), sewer ($34 flat), and trash (~$10-$13). Estimated total: approximately $560-$570/mo. Pet fee is $15/pet/mo if applicable (2-pet max).
Key facts
- Nearby trails
- In-home laundry
- Spacious kitchen
Tags
Neighborhood map
What this means for you Summary
Snapshot
- This is a 3-bed/2.0-bath manufactured listed at $90k. Condition is rated fair.
Deal economics
- At list price, monthly cash flow is $786 ($9k/yr) — positive.
- The deal already cash-flows at list — no discount required.
- Meets the 1% rule at list price ($2k rent vs $90k).
- Recommended offer: $79k (12.0% below list) — sets the bar for market timing.
- Cap rate 16.8% vs local median 3.3% in Payson — top-decile yield for the area; either an underpriced asset or a hidden risk that comps aren't pricing in. Stress-test before assuming the spread holds.
Location & tenants
- Location reads 69/100 on livability (#44 in AZ) — a middle-class / working-renter tenant base. Strengths: housing A, crime B, cost of living B; Watch: schools C-, amenities D-, commute F.
- Payson Unified District (4209) (town): math 20% / reading 32% proficiency, ranked #138 of 249 in AZ (top 55%) — low school quality limits family demand, transient renter base, plan for 1-2y turnover.
- Market conditions: 695 active listings in the ZIP; 6 comparable units currently listed for rent nearby; rentals lingering (median 45d on market — plan ~5-8 weeks vacancy on turnover, expect pricing pressure); 67% of comp listings sitting > 30 days — soft ceiling on asking rent; 217 units permitted in Gila County in 2024 (0 in 5+ unit buildings).
- This rent runs 32% of the median local income ($66k/yr) — at the standard rent-burdened threshold; future hikes will face affordability resistance.
Forward outlook
- Local home prices are declining (-3.0%/yr); year-one equity from $622 of loan paydown is wiped out by about $3k of value loss. Plan a longer hold.
- Gila County population projected at -18% by 2050 — secular population decline; favor cash flow + early exit over multi-decade hold.
- At projected returns (-3.0% appreciation + 3.0% rent growth), your $25k cash investment doubles in ~4 years — after that, you're playing with house money.
Negotiation context
- It's been on market 201 days — a 12% lower offer ($79k) is reasonable based on typical stale-listing flexibility.
Risks & watch-outs
- Climate carrying-cost: major flood risk; severe wildfire risk — expect insurance premiums to compound above CPI over the hold.
Questions for the listing agent
- It's been on market 201 days. Have you received any prior offers? Is the seller open to a 12% concession, seller financing, or rate buy-down credit?
- Have any recent inspections been done? Can we get a copy of the seller's disclosures and any deferred-maintenance estimates?
- Why hasn't it sold? Are there any deal-killer items the seller is aware of (foundation, flood, title, zoning, code violations)?
- Is there a deadline driving the sale (1031 exchange, divorce, estate, relocation)? That informs how much negotiation room exists.
- What's the average days-on-market for RENTAL listings here right now (not sales)? A rising rental-DOM trend means longer vacancies and softer asking-rent achievability than the comps imply.
- What's the recent tenant-quality profile in this submarket — average credit score on applications, eviction rate, late-payment / NSF rate, and stable-employment percentage? A property-management company in the area should have these aggregated.
- How much new for-sale + rental construction is in the pipeline within 1–3 miles? Heavy new supply typically softens prices + rents 12–24 months out; constrained supply supports both.
Investment metrics
- 1% rule
- 1.98% ✓
- Cap rate
- 16.78%
- Cash-on-cash
- 37.46%
- DSCR
- 2.67
- GRM
- 4.2
CMA / ARV
- ARV (median comp)
- $75,156
- List price
- $89,900
- Delta
- 19.62%
- Verdict
- OVERPRICED
- Comps
- 17 within 1.0 mi
Show comp detail 11 sales within ~0.75 mi
| Address | Dist | Beds/Ba | Sqft | Sold | Price | $/sf | Match |
|---|---|---|---|---|---|---|---|
| 506 E Mckamey St | 0.20mi | 2/2.0 (-1) | 945 (-2%) | 8mo | $345,000 | $365 | 76 |
| 705 E Miller Rd #43 | 0.39mi | 2/2.0 (-1) | 938 (-3%) | 1mo | $60,500 | $64 | 71 |
| 107 E Bonita St #16 | 0.58mi | 2/2.0 (-1) | 960 (-0%) | 2mo | $53,000 | $55 | 66 |
| 705 E Miller Rd #30 | 0.36mi | 2/2.0 (-1) | 980 (+2%) | 16mo | $80,000 | $82 | 63 |
| 703 E Frontier St St #25 | 0.00mi | 2/2.0 (-1) | 832 (-14%) | 15mo | $100,000 | $120 | 60 |
| 705 E Miller Rd #10 | 0.36mi | 2/2.0 (-1) | 980 (+2%) | 21mo | $94,000 | $96 | 58 |
| 705 E Miller Rd #18 | 0.39mi | 2/2.0 (-1) | 850 (-12%) | 2mo | $17,995 | $21 | 55 |
| 705 E Miller Rd #42 | 0.39mi | 2/2.0 (-1) | 840 (-13%) | 6mo | $66,000 | $79 | 50 |
| 903 N Granite Dells Rd #28 | 0.55mi | 2/2.0 (-1) | 900 (-7%) | 19mo | $82,000 | $91 | 42 |
| 202 S Thomas Ln | 0.64mi | 2/1.0 (-1) | 896 (-7%) | 12mo | $105,500 | $118 | 40 |
| 1006 S Ponderosa St | 0.53mi | 2/2.0 (-1) | 1,056 (+9%) | 21mo | $260,000 | $246 | 37 |
Match score weights: distance 35% · size 25% · config 20% · recency 20%. Top-matched comps best support the ARV.
Projected returns pro-forma
-3.0% appreciation · 3.0% rent growth · sell at horizon
- IRR
- 33.4%
- Equity multiple
- 2.41×
- Total profit
- $35,500
- Equity at exit
- $13,404
- IRR
- 40.4%
- Equity multiple
- 4.79×
- Total profit
- $95,458
- Equity at exit
- $7,773
Cash invested: $25,172 (down + closing). Projections, not guarantees.
Landlord ↔ Tenant lean methodology
- Overall (STATE)
- 87 Strongly Landlord-Friendly
- State Arizona
- 87 Strongly Landlord-Friendly · R+3
- County
- — inherits STATE
- City
- — inherits STATE
ZIP-level market 85541
- Home prices YoY
- -6.6%
- Active inventory
- 695
- Price-to-rent
- 4.2×
Monthly cashflow live
- Estimated rent
- $1,781 high interval (Pro) →
- Mortgage (P&I)
- −$471
- Tax est. 1.5%
- −$112 /mo · $1,348/yr
- Insurance
- −$37
- HOA
- −$0
- Vacancy / Maint / Mgmt
- −$374
- Net cashflow
- $786
Break-even live
Sensitivity live
| Price | -10% $848 | -5% $817 | +0% $786 | +5% $755 | +10% $724 |
|---|---|---|---|---|---|
| Rent | -10% $645 | -5% $715 | +0% $786 | +5% $856 | +10% $926 |
| Rate | -1.0pp $831 | -0.5pp $809 | base $786 | +0.5pp $762 | +1.0pp $739 |
UW: 25.0% down · 7.5% · 30yr · 1.5% tax · 5.0% vac · 8.0% maint · 8.0% mgmt
Financing live
Cash to close
- Down payment
- $22,475
- Closing costs
- $2,697
- Reserves months
- —
- Total cash needed
- —
Loan-product check · same deal, 3 products live
Conventional
25% down · 7.5% · 30yr
- Down + closing
- —
- Monthly P&I
- —
- Monthly cashflow
- —
- DSCR
- —
- Eligible?
- —
Personal DTI + credit; lowest rate.
DSCR
20% down · 8.5% · 30yr
- Down + closing
- —
- Monthly P&I
- —
- Monthly cashflow
- —
- DSCR
- —
- Eligible?
- —
No personal income docs; deal must DSCR.
Hard money
10% down · 12.0% · 12mo
- Down + closing
- —
- Monthly P&I
- —
- Monthly cashflow
- —
- DSCR
- —
- Eligible?
- —
Short-term bridge; refi at stabilization.
Rent comps 6 comps
| Address | Beds | Baths | Sqft | Rent | $/sqft | DOM | Units | Dist |
|---|---|---|---|---|---|---|---|---|
| 801 E Frontier St Unit 43 Payson, AZ | 2.0 | 2.0 | 960 | $1,395 | $1.45 | 44d | 1 | 0.16mi |
| 801 E Frontier St Apt 49 Payson, AZ | 2.0 | 2.0 | 960 | $1,400 | $1.46 | 44d | 1 | 0.16mi |
| 801 E Frontier St Apt 05 Payson, AZ | 2.0 | 1.5 | 940 | $1,400 | $1.49 | 44d | 1 | 0.16mi |
| 512 W Longhorn Rd Unit 4 Payson, AZ | 2.0 | 1.0 | 1000 | $1,450 | $1.45 | 44d | 1 | 1.11mi |
| 1015 S Goodfellow Rd Payson, AZ | 3.0 | 2.0 | 1092 | $2,000 | $1.83 | 22d | 1 | 1.16mi |
| 333 N McLane Rd Payson, AZ | 1.0–2.0 | 1.0–2.0 | 1205 | $2,080 | $1.73 | 14d | 2 | 1.30mi |
Listing history 16 events
-
2026-06-19days on market $89,900 Active 201 DOM
-
2026-06-18days on market $89,900 Active 200 DOM
-
2026-06-17days on market $89,900 Active 199 DOM
-
2026-06-16days on market $89,900 Active 198 DOM
-
2026-06-15days on market $89,900 Active 197 DOM
-
2026-06-14days on market $89,900 Active 195 DOM
-
2026-06-12days on market $89,900 Active 194 DOM
-
2026-06-09days on market $89,900 Active 191 DOM
-
2026-06-08days on market $89,900 Active 190 DOM
-
2026-06-07days on market $89,900 Active 189 DOM
-
2026-06-03days on market $89,900 Active 185 DOM
-
2026-06-02days on market $89,900 Active 184 DOM
-
2026-06-01days on market $89,900 Active 183 DOM
-
2026-05-31days on market $89,900 Active 182 DOM
-
2026-05-31days on market $89,900 Active 181 DOM
-
2025-12-01$89,900 Active 580-char remark
Show marketing remark (580 chars)
Escape the desert heat and embrace the mountain lifestyle in this well-maintained 3-bedroom, 2-bath manufactured home in Payson. Nestled among the pines in a friendly 55+ community, you'll enjoy cooler temperatures, stunning natural beauty, and the relaxed pace of small-town Arizona living, all with convenient access to shopping, dining, and medical services. Lot rent is $450/mo. Additional monthly fees include water (metered, base rate $59), sewer ($34 flat), and trash (~$10-$13). Estimated total: approximately $560-$570/mo. Pet fee is $15/pet/mo if applicable (2-pet max).
ⓘ Source: listings_history table (triggers on properties + properties_extension) + one-shot
backfill from property_details.listing_events for pre-trigger history.
Climate risk First Street
- Flood 6/10 Major FEMA zone X (unshaded) · 72% chance over 30 yrs
- Wildfire 8/10 Severe
- Heat 4/10 Moderate 7 d/yr ≥96°F today · 19 d/yr by 30 yrs out
- Wind 1/10 Low
- Air quality 1/10 Low 0 unhealthy d/yr today · 0 by 30 yrs out
Nearby sold comps map
Loading sold comps map…
Walkable amenities ~0.75 mi
Loading nearby amenities…
Taxation est. · year 1
- Rental income
- $21,372
- − Mortgage interest
- −$5,036
- − Property taxes
- −$1,348
- − Insurance
- −$450
- − Repairs & maintenance
- −$1,710
- − Management
- −$1,710
- − Depreciation
- −$2,615
- Taxable income
- $8,503
- Est. tax owed @ 24.0%
- −$2,041
- After-tax cash flow
- $7,388/yr
For passive investors: Depreciation is non-cash, so a rental often shows a tax loss while cash-flowing — sheltering income. Rental losses are passive: they offset passive income freely, and up to $25,000/yr can offset ordinary (W-2) income if you actively participate and your MAGI is under $100k (phasing out to $0 by $150k); unused losses carry forward. On sale, claimed depreciation is recaptured at up to 25%, and gains may owe capital-gains tax (a 1031 exchange can defer both). Figures are a year-1 estimate at your 24.0% rate — not tax advice; consult a CPA.
Condition & rehab AI · 12 photos
This 3-bedroom, 2-bath manufactured home in Payson requires moderate repairs and maintenance to improve its curb appeal and value.
Repairs flagged
- Moderate exterior siding — Weathered and discolored
- Moderate interior paint — Some discoloration
Value-add opportunities
- Both paint exterior — Enhances curb appeal and value
- Both repair siding — Improves home's appearance and value
- Both update interior paint — Enhances interior appearance and value
Renovation cost estimate screening
| Repair item | Severity | Est. cost |
|---|---|---|
| exterior siding · Weathered and discolored | Moderate | $3,000–15,000 |
| interior paint · Some discoloration | Moderate | $3,000–15,000 |
| Total estimated repair cost · 2 items | $6,000–30,000 |
Value-add ROI direction
- Both paint exterior — Enhances curb appeal and value ↑
- Both repair siding — Improves home's appearance and value ↑
- Both update interior paint — Enhances interior appearance and value ↑
ⓘ Cost ranges are severity-bucket heuristics (US national rule-of-thumb). Get contractor quotes + a written scope before underwriting a rehab budget.
Schools (NCES district)
- District
- Payson Unified District (4209)
- NCES district ID
- 0406070
- Math proficiency
- 20% ▼ -21.00%
- Reading proficiency
- 32% ▼ -16.00%
- Median HH income
- $41,440
- Composite
- 22.03/100
- National rank
- #8200
- State rank
- #138 of 249 in AZ
Livability — Payson
- Score
- 69/100
- State rank
- #44
- US rank
- #8740
Category grades
Schools grade is shown separately in the Schools card above.
Census & demographics
- Census place
- Payson, AZ
- County
- Gila County · 23,382 people
- City population
- 23,382
- Metro
- Payson, AZ
- Population (ZIP)
- 23,382
- Household income
- $66,383
- Rent vs Own
- Severe rent burden
- 523.0
Population outlook (Gila County) Hauer SSP2
- Today (2025)
- 50,229 people
- By 2030
- 48,202 · -4.0%
- By 2040
- 44,101 · -12.2%
- By 2050
- 41,041 · -18.3%
- By 2075
- 37,536 · -25.3%
- By 2100
- 32,485 · -35.3%
Race, ethnicity, and origin ACS 2023
- Neighborhood character
- Predominantly White (84%)
- Race & ethnicity
- White 84% Hispanic / Latino 11% Two or more races 8% Native American 1%
- Hispanic origin (detail)
- Mexican 9%
- Common ancestry
- Portuguese 3% Lithuanian 2% Iranian 2%
- Foreign-born
- 3% · Canada
- Languages at home
- 93% English-only · Spanish 5% German/W. Germanic 1%
Political lean MEDSL · Gila
- 2024 margin
- Solid R (+37.6) · D 30.8% · R 68.4%
- 2008→2024 swing
- -9.8pp toward R · 2008: -27.8pp · 2024: -37.6pp
- All cycles
- 2024: R+37.6 2020: R+34.1 2016: R+32.4 2012: R+26.4 2008: R+27.8
Not yet ingested
- Civics
- —
Market trends
- HPI YoY
- ▼ -29.47%
- Current HPI
- 416.4005
- Rent YoY
- —
- Metro
- Payson, AZ
- State GDP YoY
- ▲ 4.54%
- F500 in state
- 20
Industry mix (Fortune 500 HQ in AZ)
| Industry | F500 HQs | Revenue |
|---|---|---|
| Technology | 2 | $13B |
|
||
| Mining / Metals | 1 | $23B |
|
||
| Environmental Services | 1 | $16B |
|
||
| Metals / Steel | 1 | $14B |
|
||
| Technology Distribution | 1 | $9B |
|
||
| Homebuilding | 1 | $8B |
|
||
Price history
1 event — show timeline
- 2025-12-01 Listed $89,900 WMMLS
Cash-flow waterfall
monthlySold comps — $/sqft
last 12 mo · ≤1 miLoading sold comps…