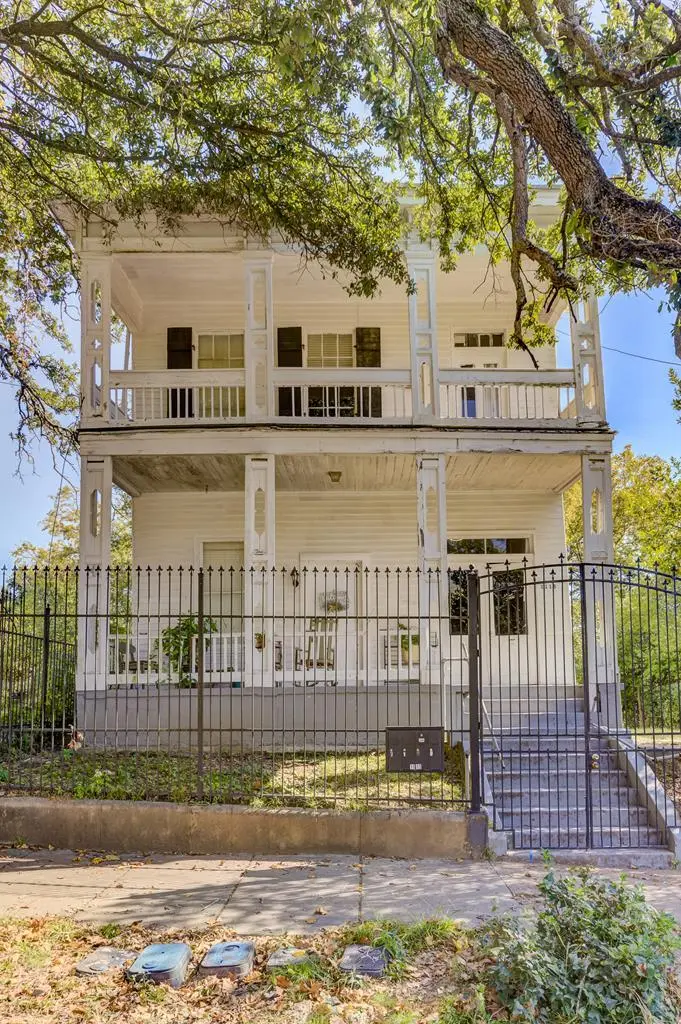
 Fourplex
1115 First North St · Vicksburg, MS
Flood risk 1/10 · Minimal
- FEMA flood zone
- X (unshaded)
- Chance of flooding over 30 yrs
- 0.0%
- Est. flood insurance / yr
- $507 – $1,088
Fire risk 1/10 · Minimal
- Est. fire insurance / yr
- $1,241 – $2,305
Heat risk 8/10 · Major
- Hot days now (above 110°F)
- 7 days/yr
- Hot days in 30 yrs
- 20 days/yr
Wind risk 7/10 · Major
- Chance of severe wind over 30 yrs
- 78.0%
Air-quality risk 1/10 · Minimal
- Unhealthy air days now
- 0 days/yr
- Unhealthy air days in 30 yrs
- 0 days/yr
Risk factors via First Street. Map © Google.
Why this score? — see what drove the B- grade
The composite is a weighted blend of 9 inputs, each scored 0–100. Each bar is that input's sub-score; the figure is the points it added to the 100-point composite (weight × sub-score).
- Cash flow +30.0/30.0
- 1% rule +10.0/10.0
- DSCR +10.0/10.0
- ARV discount +7.5/15.0
- Livability +3.2/5.0
- Rent growth +2.5/5.0
- Condition / age +2.5/5.0
- Schools +2.0/10.0
- Appreciation +0.0/10.0
$225,000
🖨 Deal sheet 📄 Offer letter ✓ Due diligence
Multi-family units
County records classify this as Multi-Family (2-4 Unit). Listing-text estimate: 4 units. confirmed
Listing remarks MLS
Three apartments with 1 bedroom, 1 apartment with 2 bedrooms. Roof is two years old. Home is current ly being rented. please call for appt to show, 638 -4505 U/C By Jennifer Willis, BrokerSouth GMAC
Key facts
- 8,712 sq ft lot
- Garage
- Built 1900
Property features AI
Exterior
- Parking: 1-car garage
- Utilities: Public water; Public sewer; Natural gas available
- Home design: Multi-family residential; Two stories
- Construction: Wood siding; Composition roof
- Exterior features: Front porch; Partial fencing
Interior
- Flooring: Ceramic tile; Hardwood; Vinyl
- Heating & cooling: Central heating (natural gas); Central air; Window air units
- Interior features: Gas water heater; Single fireplace
- Laundry & utility: Electric dryer hookup inside
Neighborhood map
What this means for you Summary
Snapshot
- This is a 4 × 1-bed/1-bath units multifamily listed at $225k.
Deal economics
- At list price, monthly cash flow is $4k ($50k/yr) — positive. Per door: $1k/mo.
- The deal already cash-flows at list — no discount required.
- Meets the 1% rule at list price ($7k rent vs $225k).
- Recommended offer: $198k (12.0% below list) — sets the bar for market timing.
- Cap rate 28.6% vs local median 4.5% in Vicksburg — top-decile yield for the area; either an underpriced asset or a hidden risk that comps aren't pricing in. Stress-test before assuming the spread holds.
Location & tenants
- Location reads 63/100 on livability (#166 in MS) — a middle-class / working-renter tenant base. Strengths: cost of living A+, housing A+; Watch: crime F, amenities F, commute F.
- Vicksburg Warren School District (rural): math 22% / reading 26% proficiency, ranked #82 of 130 in MS (top 63%) — low school quality limits family demand, transient renter base, plan for 1-2y turnover; 73% free/reduced lunch — lower-income household profile, screen leases tightly.
- Zoned schools: Sherman Ave Elementary (368 students, 100% FRL); Warren Central Junior High School (math 20% / reading 23%, grade F, #109 of 179 statewide, top 62%, 598 students, 100% FRL); Warren Central High School (math 4% / reading 28%, grade F, #145 of 197 statewide, top 74%, 1,159 students, 100% FRL) — zoned schools average 100% FRL vs 73% district-wide (27 pts higher); higher-poverty schools than district average — tighter screening recommended.
- Market conditions: 65 active listings in the ZIP; 12 units permitted in Warren County in 2024 (0 in 5+ unit buildings).
Forward outlook
- Local home prices are declining (-3.0%/yr); year-one equity from $2k of loan paydown is wiped out by about $7k of value loss. Plan a longer hold.
- Warren County population projected at -17% by 2050 — secular population decline; favor cash flow + early exit over multi-decade hold.
- At projected returns (-3.0% appreciation + 3.0% rent growth), your $63k cash investment doubles in ~2 years — after that, you're playing with house money.
Negotiation context
- It's been on market 1120 days — a 12% lower offer ($198k) is reasonable based on typical stale-listing flexibility.
- 3 sale attempts since 22y ago with the ask held roughly flat each time — persistent listings suggest the price (not the market) is what's stuck; bring a comps-based counter.
Risks & watch-outs
- Watch-outs: built in 1900 — expect roof / HVAC / electrical / plumbing capex.
- Climate carrying-cost: major wind risk, 78% chance of damaging wind over 30y; extreme-heat days projected 7→20/yr by 2055 (HVAC capex compounding) — expect insurance premiums to compound above CPI over the hold.
Questions for the listing agent
- It's been on market 1120 days. Have you received any prior offers? Is the seller open to a 12% concession, seller financing, or rate buy-down credit?
- Can we see the unit-by-unit rent roll, current vacancy, and any below-market leases? What's the average tenancy length?
- What capital expenditures (roof, boiler, parking lot, exteriors) have been made in the last 5 years, and what's planned in the next 2?
- Built in 1900 — when were the roof, HVAC, electrical panel, plumbing, and water heater last replaced?
- Why hasn't it sold? Are there any deal-killer items the seller is aware of (foundation, flood, title, zoning, code violations)?
- Is there a deadline driving the sale (1031 exchange, divorce, estate, relocation)? That informs how much negotiation room exists.
- Schools are D-rated, which usually means shorter tenancies and higher turnover. Who's the typical renter profile here, and what's been the actual vacancy rate?
- Crime grade is F in this area — have there been break-ins, vandalism, or insurance claims at this property in the last 3 years? What carrier currently insures it and at what premium?
- What's the average days-on-market for RENTAL listings here right now (not sales)? A rising rental-DOM trend means longer vacancies and softer asking-rent achievability than the comps imply.
- What's the recent tenant-quality profile in this submarket — average credit score on applications, eviction rate, late-payment / NSF rate, and stable-employment percentage? A property-management company in the area should have these aggregated.
- How much new apartment / multifamily construction is in the pipeline within 1–3 miles? Heavy new supply (>2% of stock underway) typically softens rents 12–24 months out; light construction supports rent growth.
Investment metrics
- 1% rule
- 3.20% ✓
- Cap rate
- 28.62%
- Cash-on-cash
- 79.74%
- DSCR
- 4.55
- GRM
- 2.6
CMA / ARV
No comps found within radius.
Projected returns pro-forma
-3.0% appreciation · 3.0% rent growth · sell at horizon
- IRR
- 79.9%
- Equity multiple
- 4.65×
- Total profit
- $230,235
- Equity at exit
- $33,548
- IRR
- 83.3%
- Equity multiple
- 9.64×
- Total profit
- $544,108
- Equity at exit
- $19,454
Cash invested: $63,000 (down + closing). Projections, not guarantees.
Landlord ↔ Tenant lean methodology
- Overall (STATE)
- 90 Strongly Landlord-Friendly
- State Mississippi
- 90 Strongly Landlord-Friendly · R+11
- County
- — inherits STATE
- City
- — inherits STATE
ZIP-level market 39183
- Home prices YoY
- -32.3%
- Active inventory
- 65
- Price-to-rent
- 10.4×
Monthly cashflow live
- Estimated rent
- $7,200 medium interval (Pro) →
- Mortgage (P&I)
- −$1,180
- Tax from tax record
- −$228 /mo · $2,738/yr
- Insurance
- −$94
- HOA
- −$0
- Vacancy / Maint / Mgmt
- −$1,512
- Net cashflow
- $4,186
Break-even live
4-unit breakdown (identical units grouped — click to expand)
| Units | Beds | Baths | Est. rent |
|---|---|---|---|
| 4× units | 1 | 1 | $7,200 |
| #1 | 1 | 1 | $1,800 |
| #2 | 1 | 1 | $1,800 |
| #3 | 1 | 1 | $1,800 |
| #4 | 1 | 1 | $1,800 |
| Total (4 units) | $7,200 | ||
UW: 25.0% down · 7.5% · 30yr · 1.5% tax · 5.0% vac · 8.0% maint · 8.0% mgmt
Financing live
Cash to close
- Down payment
- $56,250
- Closing costs
- $6,750
- Reserves months
- —
- Total cash needed
- —
Loan-product check · same deal, 3 products live
Conventional
25% down · 7.5% · 30yr
- Down + closing
- —
- Monthly P&I
- —
- Monthly cashflow
- —
- DSCR
- —
- Eligible?
- —
Personal DTI + credit; lowest rate.
DSCR
20% down · 8.5% · 30yr
- Down + closing
- —
- Monthly P&I
- —
- Monthly cashflow
- —
- DSCR
- —
- Eligible?
- —
No personal income docs; deal must DSCR.
Hard money
10% down · 12.0% · 12mo
- Down + closing
- —
- Monthly P&I
- —
- Monthly cashflow
- —
- DSCR
- —
- Eligible?
- —
Short-term bridge; refi at stabilization.
Listing history 20 events
-
2026-06-19days on market $225,000 Active 1120 DOM
-
2026-06-18days on market $225,000 Active 1119 DOM
-
2026-06-17days on market $225,000 Active 1118 DOM
-
2026-06-16days on market $225,000 Active 1117 DOM
-
2026-06-15days on market $225,000 Active 1116 DOM
-
2026-06-14days on market $225,000 Active 1114 DOM
-
2026-06-12days on market $225,000 Active 1113 DOM
-
2026-06-09days on market $225,000 Active 1110 DOM
-
2026-06-08days on market $225,000 Active 1109 DOM
-
2026-06-07days on market $225,000 Active 1108 DOM
-
2026-06-05days on market $225,000 Active 1105 DOM
-
2026-06-02days on market $225,000 Active 1103 DOM
-
2026-06-01days on market $225,000 Active 1102 DOM
-
2026-05-31days on market $225,000 Active 1101 DOM
-
2026-05-30days on market $225,000 Active 1100 DOM
-
2024-08-08status Active
-
2021-11-09$225,000 Active
-
2004-09-21$98,000 198-char remark
Show marketing remark (198 chars)
Three apartments with 1 bedroom, 1 apartment with 2 bedrooms. Roof is two years old. Home is current ly being rented. please call for appt to show, 638 -4505 U/C By Jennifer Willis, BrokerSouth GMAC
-
2004-09-17soldstatus 198-char remark
Show marketing remark (198 chars)
Three apartments with 1 bedroom, 1 apartment with 2 bedrooms. Roof is two years old. Home is current ly being rented. please call for appt to show, 638 -4505 U/C By Jennifer Willis, BrokerSouth GMAC
-
2004-09-14soldstatus
ⓘ Source: listings_history table (triggers on properties + properties_extension) + one-shot
backfill from property_details.listing_events for pre-trigger history.
Tax reassessment forecast MS · Resets to sale price
- Current annual tax
- $2,738 · $228/mo
- Projected year-2 tax
- $2,738 · $228/mo
- Expected delta
- $0/yr ($0/mo · 0.0%)
ⓘ Screening estimate from a state-policy table — verify with the county assessor before closing.
Climate risk First Street
- Flood 1/10 Low FEMA zone X (unshaded) · 0% chance over 30 yrs
- Wildfire 1/10 Low
- Heat 8/10 Severe 7 d/yr ≥110°F today · 20 d/yr by 30 yrs out
- Wind 7/10 Severe 78% chance of damaging wind over 30 yrs
- Air quality 1/10 Low 0 unhealthy d/yr today · 0 by 30 yrs out
Nearby sold comps map
Loading sold comps map…
Walkable amenities ~0.75 mi
Loading nearby amenities…
Taxation est. · year 1
- Rental income
- $86,400
- − Mortgage interest
- −$12,603
- − Property taxes
- −$2,738
- − Insurance
- −$1,125
- − Repairs & maintenance
- −$6,912
- − Management
- −$6,912
- − Depreciation
- −$6,545
- Taxable income
- $49,564
- Est. tax owed @ 24.0%
- −$11,895
- After-tax cash flow
- $38,339/yr
For passive investors: Depreciation is non-cash, so a rental often shows a tax loss while cash-flowing — sheltering income. Rental losses are passive: they offset passive income freely, and up to $25,000/yr can offset ordinary (W-2) income if you actively participate and your MAGI is under $100k (phasing out to $0 by $150k); unused losses carry forward. On sale, claimed depreciation is recaptured at up to 25%, and gains may owe capital-gains tax (a 1031 exchange can defer both). Figures are a year-1 estimate at your 24.0% rate — not tax advice; consult a CPA.
Schools (NCES district)
- District
- Vicksburg Warren School District
- NCES district ID
- 2804470
- Math proficiency
- 22% ▼ -11.00%
- Reading proficiency
- 26% ▼ -6.00%
- Median HH income
- $40,492
- Composite
- 20.31/100
- National rank
- #8612
- State rank
- #82 of 130 in MS
Livability — Vicksburg
- Score
- 63/100
- State rank
- #166
- US rank
- #16032
Category grades
Schools grade is shown separately in the Schools card above.
Census & demographics
- Census place
- Vicksburg, MS
- City population
- 28,479
- Population (ZIP)
- 13,419
Population outlook (Warren County) Hauer SSP2
- Today (2025)
- 45,473 people
- By 2030
- 44,051 · -3.1%
- By 2040
- 40,884 · -10.1%
- By 2050
- 37,596 · -17.3%
- By 2075
- 30,162 · -33.7%
- By 2100
- 23,585 · -48.1%
Race, ethnicity, and origin ACS 2023
- Race & ethnicity
- White 49% Black 47% Two or more races 3% Hispanic / Latino 2%
- Common ancestry
- Italian 2% Lithuanian 2% Slovak 1%
- Foreign-born
- 1%
- Languages at home
- 97% English-only · Spanish 2% Other Asian/Pacific 1%
Political lean MEDSL · Warren
- 2024 margin
- Toss-up / Even · D 47.5% · R 51.4% · Other 1.1%
- 2008→2024 swing
- -0.9pp no change · 2008: -3.0pp · 2024: -4.0pp
- All cycles
- 2024: R+4.0 2020: D+0.4 2016: R+4.9 2012: D+2.6 2008: R+3.0
Not yet ingested
- Civics
- —
Market trends
- HPI YoY
- ▼ -69.46%
- Current HPI
- 145.8279
- Rent YoY
- —
- Metro
- —
- State GDP YoY
- —
- F500 in state
- 0
Price history
+129.6% since first listed5 events — show timeline
- 2024-08-08 Relisted — VWCBR
- 2021-11-09 Listed $225,000 VWCBR
- 2004-09-21 Listed $98,000 VWCBR
- 2004-09-17 Sold (MLS) — VWCBR
- 2004-09-14 Sold (Public Records) — Public Records
Property tax history
+4.1%/yrLatest (2025): $2,738 · +1.4% YoY. Source: county tax records.
Cash-flow waterfall
monthlySold comps — $/sqft
last 12 mo · ≤1 miLoading sold comps…