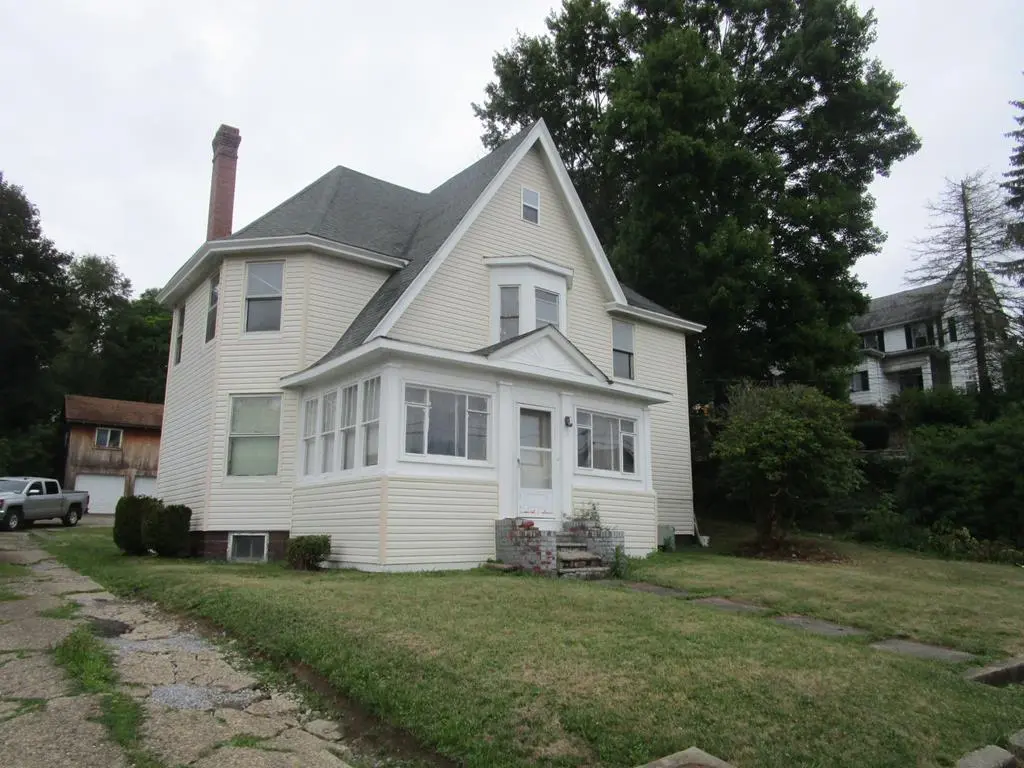
519 Wood St · New Bethlehem, PA
Flood risk 1/10 · Minimal
- FEMA flood zone
- X (unshaded)
- Chance of flooding over 30 yrs
- 0.0%
- Est. flood insurance / yr
- $507 – $1,088
Fire risk 1/10 · Minimal
- Est. fire insurance / yr
- $511 – $949
Heat risk 3/10 · Minor
- Hot days now (above 93°F)
- 8 days/yr
- Hot days in 30 yrs
- 19 days/yr
Wind risk 2/10 · Minimal
- Chance of severe wind over 30 yrs
- —
Air-quality risk 2/10 · Minimal
- Unhealthy air days now
- 1 days/yr
- Unhealthy air days in 30 yrs
- 3 days/yr
Risk factors via First Street. Map © Google.
Why this score? — see what drove the F grade
The composite is a weighted blend of 9 inputs, each scored 0–100. Each bar is that input's sub-score; the figure is the points it added to the 100-point composite (weight × sub-score).
- Cash flow +9.7/30.0
- Appreciation +6.0/10.0
- Schools +4.2/10.0
- Livability +3.4/5.0
- 1% rule +2.9/10.0
- DSCR +2.7/10.0
- Rent growth +2.5/5.0
- Condition / age +2.5/5.0
- ARV discount +0.0/15.0
$130,000
🖨 Deal sheet 📄 Offer letter ✓ Due diligence
Listing remarks MLS
3 unit (2 building) rental property in a convenient location. Newer roofs on each building. All appliances in each apartment are included in the sale. Established renters and well-maintained apartments.
Key facts
- 9,583 sq ft lot
- 4 parking spots
- Built 1902
Property features AI
Finance
- Other: Tax annual amount: $1,846
Exterior
- Parking: 4 parking spaces
- Utilities: Public water; Public sewer; Natural gas connected/available
- Home design: Residential income property; Composition roof; Frame construction with vinyl siding
- Construction: Frame construction; Vinyl siding
- Exterior features: Front porch; 68' x 161' lot (approx. 0.22 acre); R1 zoning
Interior
- Heating & cooling: Forced-air heating; Has cooling
- Interior features: Gas water heater; Finished full basement; 13 total rooms
Neighborhood map
What this means for you Summary
Snapshot
- This is a 6-bed/3.0-bath single-family listed at $130k.
Deal economics
- At list price, monthly cash flow is $-85 ($-1k/yr) — negative.
- To cash-flow at today's rent, offer at most $118k (9.5% below list).
- To meet the 1% rule (rent ≥ 1% of price), the offer needs to be $103k (20.8% below list).
- Recommended offer: $103k (20.8% below list) — sets the bar for 1% rule.
Location & tenants
- Location reads 68/100 on livability (#918 in PA) — a middle-class / working-renter tenant base. Strengths: cost of living A+, housing A+, health & safety A+; Watch: crime C-, amenities F, commute F.
- Redbank Valley SD (rural): math 36% / reading 64% proficiency, ranked #192 of 539 in PA (top 36%) — acceptable for families but not a draw, mixed tenant base, ~2y average lease.
- Market conditions: 7 active listings in the ZIP; 25 units permitted in Clarion County in 2024 (0 in 5+ unit buildings).
Forward outlook
- In year one you build about $3k of equity ($899 loan paydown + $3k appreciation (2.0% local appreciation)).
- Clarion County population projected at -18% by 2050 — secular population decline; favor cash flow + early exit over multi-decade hold.
- By year 10, paydown + projected appreciation supports a ~$34k cash-out refi (75% LTV) — recoverable capital for the next deal without selling this one.
Negotiation context
- It's been on market 1266 days — a 12% lower offer ($114k) is reasonable based on typical stale-listing flexibility.
- 5 sale attempts since 4y ago; this cycle's ask has dropped $30k (19%) from the opening price — seller is motivated, your offer sets the floor, not the list.
- Current owner paid $30k; list at $130k implies a 333% gain — meaningful room to come down on a strong offer.
Risks & watch-outs
- Watch-outs: built in 1902 — expect roof / HVAC / electrical / plumbing capex.
Questions for the listing agent
- What do current leases actually rent for vs. the listed asking? Can we see a recent rent roll and the last 12 months of T-12 income?
- It's been on market 1266 days. Have you received any prior offers? Is the seller open to a 21% concession, seller financing, or rate buy-down credit?
- Built in 1902 — when were the roof, HVAC, electrical panel, plumbing, and water heater last replaced?
- Why hasn't it sold? Are there any deal-killer items the seller is aware of (foundation, flood, title, zoning, code violations)?
- Is there a deadline driving the sale (1031 exchange, divorce, estate, relocation)? That informs how much negotiation room exists.
- The area grade is low — what's the realistic commute time and amenity access for the typical tenant pool here? Any planned neighborhood developments (good or bad) we should know about?
- What's the average days-on-market for RENTAL listings here right now (not sales)? A rising rental-DOM trend means longer vacancies and softer asking-rent achievability than the comps imply.
- What's the recent tenant-quality profile in this submarket — average credit score on applications, eviction rate, late-payment / NSF rate, and stable-employment percentage? A property-management company in the area should have these aggregated.
- How much new for-sale + rental construction is in the pipeline within 1–3 miles? Heavy new supply typically softens prices + rents 12–24 months out; constrained supply supports both.
Investment metrics
- 1% rule
- 0.79% ✗
- Cap rate
- 5.51%
- Cash-on-cash
- -2.81%
- DSCR
- 0.87
- GRM
- 10.5
CMA / ARV
- ARV (median comp)
- $90,756
- List price
- $130,000
- Delta
- 43.24%
- Verdict
- OVERPRICED
- Comps
- 2 within 1.0 mi
Projected returns pro-forma
1.97% appreciation · 3.0% rent growth · sell at horizon
- IRR
- 1.7%
- Equity multiple
- 1.09×
- Total profit
- $3,277
- Equity at exit
- $51,039
- IRR
- 5.7%
- Equity multiple
- 1.78×
- Total profit
- $28,366
- Equity at exit
- $73,317
Cash invested: $36,400 (down + closing). Projections, not guarantees.
Landlord ↔ Tenant lean methodology
- Overall (STATE)
- 62 Landlord-Friendly
- State Pennsylvania
- 62 Landlord-Friendly · EVEN
- County
- — inherits STATE
- City
- — inherits STATE
ZIP-level market 16242
- Home prices YoY
- 0.9%
- Active inventory
- 7
- Price-to-rent
- 10.5×
Monthly cashflow live
- Estimated rent
- $1,029 medium interval (Pro) →
- Mortgage (P&I)
- −$682
- Tax est. 1.5%
- −$162 /mo · $1,950/yr
- Insurance
- −$54
- HOA
- −$0
- Vacancy / Maint / Mgmt
- −$216
- Net cashflow
- $-85
Break-even live
Sensitivity live
| Price | -10% $5 | -5% $-40 | +0% $-85 | +5% $-130 | +10% $-175 |
|---|---|---|---|---|---|
| Rent | -10% $-167 | -5% $-126 | +0% $-85 | +5% $-45 | +10% $-4 |
| Rate | -1.0pp $-20 | -0.5pp $-52 | base $-85 | +0.5pp $-119 | +1.0pp $-153 |
UW: 25.0% down · 7.5% · 30yr · 1.5% tax · 5.0% vac · 8.0% maint · 8.0% mgmt
Financing live
Cash to close
- Down payment
- $32,500
- Closing costs
- $3,900
- Reserves months
- —
- Total cash needed
- —
Loan-product check · same deal, 3 products live
Conventional
25% down · 7.5% · 30yr
- Down + closing
- —
- Monthly P&I
- —
- Monthly cashflow
- —
- DSCR
- —
- Eligible?
- —
Personal DTI + credit; lowest rate.
DSCR
20% down · 8.5% · 30yr
- Down + closing
- —
- Monthly P&I
- —
- Monthly cashflow
- —
- DSCR
- —
- Eligible?
- —
No personal income docs; deal must DSCR.
Hard money
10% down · 12.0% · 12mo
- Down + closing
- —
- Monthly P&I
- —
- Monthly cashflow
- —
- DSCR
- —
- Eligible?
- —
Short-term bridge; refi at stabilization.
Listing history 24 events
-
2026-06-18days on market $130,000 Active 1266 DOM
-
2026-06-17days on market $130,000 Active 1265 DOM
-
2026-06-16days on market $130,000 Active 1264 DOM
-
2026-06-15days on market $130,000 Active 1263 DOM
-
2026-06-13days on market $130,000 Active 1261 DOM
-
2026-06-12days on market $130,000 Active 1260 DOM
-
2026-06-09days on market $130,000 Active 1257 DOM
-
2026-06-08days on market $130,000 Active 1256 DOM
-
2026-06-08days on market $130,000 Active 1255 DOM
-
2026-06-05days on market $130,000 Active 1253 DOM
-
2026-06-04days on market $130,000 Active 1251 DOM
-
2026-06-02days on market $130,000 Active 1250 DOM
-
2026-06-01days on market $130,000 Active 1249 DOM
-
2026-05-31days on market $130,000 Active 1248 DOM
-
2026-02-06status Active
-
2025-12-06historical Active Under Contract
-
2025-08-11status Active
-
2024-06-26price $130,000
-
2023-09-07status Active
-
2023-01-13status Active
-
2022-09-29price $140,000
-
2022-08-05$160,000 Active
-
2017-01-04soldstatus $30,000 202-char remark
Show marketing remark (202 chars)
3 unit (2 building) rental property in a convenient location. Newer roofs on each building. All appliances in each apartment are included in the sale. Established renters and well-maintained apartments.
-
2016-12-29soldstatus $30,000
ⓘ Source: listings_history table (triggers on properties + properties_extension) + one-shot
backfill from property_details.listing_events for pre-trigger history.
Climate risk First Street
- Flood 1/10 Low FEMA zone X (unshaded) · 0% chance over 30 yrs
- Wildfire 1/10 Low
- Heat 3/10 Moderate 8 d/yr ≥93°F today · 19 d/yr by 30 yrs out
- Wind 2/10 Low
- Air quality 2/10 Low 1 unhealthy d/yr today · 3 by 30 yrs out
Nearby sold comps map
Loading sold comps map…
Walkable amenities ~0.75 mi
Loading nearby amenities…
Taxation est. · year 1
- Rental income
- $12,352
- − Mortgage interest
- −$7,282
- − Property taxes
- −$1,950
- − Insurance
- −$650
- − Repairs & maintenance
- −$988
- − Management
- −$988
- − Depreciation
- −$3,782
- Taxable loss
- −$3,288
- Est. tax savings @ 24.0%
- +$789
- After-tax cash flow
- $-234/yr
For passive investors: Depreciation is non-cash, so a rental often shows a tax loss while cash-flowing — sheltering income. Rental losses are passive: they offset passive income freely, and up to $25,000/yr can offset ordinary (W-2) income if you actively participate and your MAGI is under $100k (phasing out to $0 by $150k); unused losses carry forward. On sale, claimed depreciation is recaptured at up to 25%, and gains may owe capital-gains tax (a 1031 exchange can defer both). Figures are a year-1 estimate at your 24.0% rate — not tax advice; consult a CPA.
Schools (NCES district)
- District
- Redbank Valley SD
- NCES district ID
- 4220130
- Math proficiency
- 36% ▼ -10.00%
- Reading proficiency
- 64% ▬ 0.00%
- Median HH income
- $42,704
- Composite
- 41.97/100
- National rank
- #3344
- State rank
- #192 of 539 in PA
Livability — New Bethlehem
- Score
- 68/100
- State rank
- #918
- US rank
- #9929
Category grades
Schools grade is shown separately in the Schools card above.
Census & demographics
- Census place
- New Bethlehem, PA
- Population (ZIP)
- 4,328
Population outlook (Clarion County) Hauer SSP2
- Today (2025)
- 37,796 people
- By 2030
- 36,830 · -2.6%
- By 2040
- 34,113 · -9.7%
- By 2050
- 31,092 · -17.7%
- By 2075
- 24,200 · -36.0%
- By 2100
- 18,737 · -50.4%
Race, ethnicity, and origin ACS 2023
- Neighborhood character
- Predominantly White (98%)
- Race & ethnicity
- White 98% Two or more races 1%
- Common ancestry
- Serbian 2% Iranian 2% Italian 2%
- Foreign-born
- 1%
Political lean MEDSL · Clarion
- 2024 margin
- Solid R (+53.1) · D 23.1% · R 76.2%
- 2008→2024 swing
- -30.7pp toward R · 2008: -22.4pp · 2024: -53.1pp
- All cycles
- 2024: R+53.1 2020: R+50.8 2016: R+47.4 2012: R+36.1 2008: R+22.4
Not yet ingested
- Civics
- —
Market trends
- HPI YoY
- ▲ 1.97%
- Current HPI
- 227.3021
- Rent YoY
- —
- Metro
- —
- State GDP YoY
- ▲ 1.68%
- F500 in state
- 34
Industry mix (Fortune 500 HQ in PA)
| Industry | F500 HQs | Revenue |
|---|---|---|
| Healthcare | 2 | $309B |
|
||
| Insurance | 2 | $27B |
|
||
| Telecommunications / Media | 1 | $124B |
|
||
| Industrial Distribution | 1 | $22B |
|
||
| Financial Services | 1 | $20B |
|
||
| Chemicals / Materials | 1 | $18B |
|
||
Price history
+333.3% since first listed10 events — show timeline
- 2026-02-06 Relisted — AVBREALTORS
- 2025-12-06 Contingent — AVBREALTORS
- 2025-08-11 Relisted — AVBREALTORS
- 2024-06-26 Price Changed $130,000 AVBREALTORS
- 2023-09-07 Relisted — AVBREALTORS
- 2023-01-13 Relisted — AVBREALTORS
- 2022-09-29 Price Changed $140,000 AVBREALTORS
- 2022-08-05 Listed $160,000 AVBREALTORS
- 2017-01-04 Sold (MLS) $30,000 AVBREALTORS
- 2016-12-29 Sold (Public Records) $30,000 Public Records
Property tax history
+17.0%/yrLatest (2026): $8,869 · +380.4% YoY. Source: county tax records.
Cash-flow waterfall
monthlySold comps — $/sqft
last 12 mo · ≤1 miLoading sold comps…