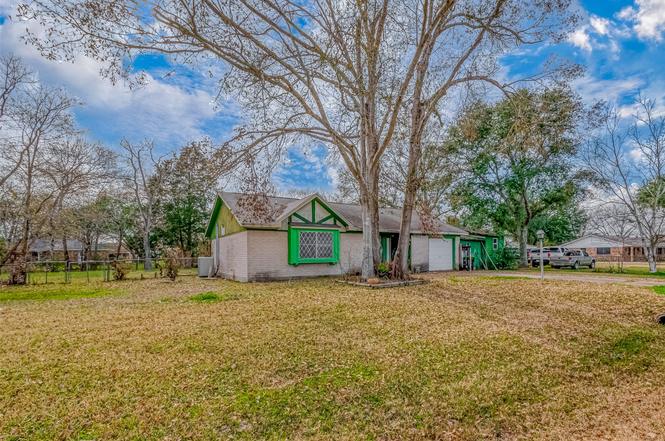
8806 Union St · Needville, TX
Flood risk 7/10 · Major
- FEMA flood zone
- X (unshaded)
- Chance of flooding over 30 yrs
- 0.99%
- Est. flood insurance / yr
- $507 – $1,088
Fire risk 2/10 · Minimal
- Est. fire insurance / yr
- $1,222 – $2,270
Heat risk 9/10 · Severe
- Hot days now (above 109°F)
- 7 days/yr
- Hot days in 30 yrs
- 23 days/yr
Wind risk 9/10 · Severe
- Chance of severe wind over 30 yrs
- 99.0%
Air-quality risk 2/10 · Minimal
- Unhealthy air days now
- 1 days/yr
- Unhealthy air days in 30 yrs
- 1 days/yr
Risk factors via First Street. Map © Google.
Why this score? — see what drove the B grade
The composite is a weighted blend of 9 inputs, each scored 0–100. Each bar is that input's sub-score; the figure is the points it added to the 100-point composite (weight × sub-score).
- Cash flow +30.0/30.0
- 1% rule +10.0/10.0
- DSCR +10.0/10.0
- ARV discount +7.5/15.0
- Schools +4.8/10.0
- Livability +3.8/5.0
- Rent growth +2.5/5.0
- Condition / age +2.5/5.0
- Appreciation +0.0/10.0
$145,000
🖨 Deal sheet 📄 Offer letter ✓ Due diligence
Listing remarks
Great investment opportunity in the growing city of Needville! This home is located close to the fire dept, just over a half mile away from Needville Elementary School, about a block away from Lowe's Market (local grocery store), close to Boutiques, Restaurants, Doctor Offices, Post Office, Daycares, and More. The home has 3 Bedrooms and 1 Full bathroom, Nice sized living room with vaulted ceiling and is open to the kitchen, a kitchen with island, and a flex room. This home is situated on 2.5 lots providing a very nice sized yard for family and friends to gather and enjoy. The back yard is fenced and provides a covered patio. Although this home needs some love and cosmetic work, there have
Key facts
- Close to restaurants
- Close to post office
- Close to boutiques
Tags
Property features AI
Exterior
- Parking: Attached garage (1 car)
- Utilities: Public water; Public sewer
- Home design: Residential property; Single-story (first-floor living); Slab foundation; Composition roof; Built in 1975
- Construction: Brick and wood siding construction
- Exterior features: Deck; Patio; Fenced backyard; Cleared lot
Interior
- Kitchen: Kitchen area (approx. 14 x 12)
- Bedrooms: Primary bedroom (first floor) — approx. 12 x 11; Bedroom (first floor) — approx. 11 x 11; Bedroom (first floor) — approx. 11 x 11; Bonus room (first floor) — approx. 12 x 11; Living room (first floor) — approx. 18 x 16
- Flooring: Concrete flooring; Laminate flooring
- Bathrooms: 1 full bathroom
- Heating & cooling: Central heating (electric); Central air (electric)
- Interior features: High ceilings; Kitchen island; Pantry; Tub with shower
- Laundry & utility: Washer hookup; Electric dryer hookup
Neighborhood map
What this means for you Summary
Snapshot
- This is a 3-bed/2.0-bath single-family listed at $145k.
Deal economics
- At list price, monthly cash flow is $590 ($7k/yr) — positive.
- The deal already cash-flows at list — no discount required.
- Meets the 1% rule at list price ($2k rent vs $145k).
- Cap rate 11.7% vs local median 2.5% in Needville — top-decile yield for the area; either an underpriced asset or a hidden risk that comps aren't pricing in. Stress-test before assuming the spread holds.
Location & tenants
- Location reads 75/100 on livability (#137 in TX, #3,992 nationally) — a middle-class / working-renter tenant base. Strengths: crime A+, cost of living A+, housing A+; Watch: amenities F, commute F.
- Needville ISD (rural): math 55% / reading 55% proficiency, ranked #95 of 826 in TX (top 12%) — acceptable for families but not a draw, mixed tenant base, ~2y average lease.
- Zoned schools: Needville El (math 58% / reading 53%, grade C, #587 of 4,322 statewide, top 14%, 1,129 students, 49% FRL); Needville H S (math 50% / reading 56%, grade C-, #437 of 1,632 statewide, top 27%, 1,067 students, 41% FRL).
- Market conditions: 337 active listings in the ZIP; 1 comparable units currently listed for rent nearby; 12,093 units permitted in Fort Bend County in 2024 (815 in 5+ unit buildings).
Forward outlook
- Local home prices are declining (-3.0%/yr); year-one equity from $1k of loan paydown is wiped out by about $4k of value loss. Plan a longer hold.
- Fort Bend County population projected at +75% by 2050 — long-run rental-demand tailwind backs the buy-and-hold thesis.
- At projected returns (-3.0% appreciation + 3.0% rent growth), your $41k cash investment doubles in ~7 years — after that, you're playing with house money.
Negotiation context
- Only 2 days on market — expect competitive offers; lowballing is unlikely to land.
- 2 sale attempts with the ask held roughly flat each time — persistent listings suggest the price (not the market) is what's stuck; bring a comps-based counter.
Risks & watch-outs
- Watch-outs: property tax is 2.8% of price; flood insurance adds $66/mo.
- Climate carrying-cost: major flood risk; severe wind risk, 99% chance of damaging wind over 30y; extreme-heat days projected 7→23/yr by 2055 (HVAC capex compounding) — expect insurance premiums to compound above CPI over the hold.
Questions for the listing agent
- Built in 1975 — when were the roof, HVAC, electrical panel, plumbing, and water heater last replaced?
- Property tax is high relative to price — has the assessment been appealed recently, and will the sale trigger a re-assessment?
- What's the actual annual flood-insurance premium (NFIP or private), and is the property in a SFHA with mandatory coverage?
- Is there a deadline driving the sale (1031 exchange, divorce, estate, relocation)? That informs how much negotiation room exists.
- What's the average days-on-market for RENTAL listings here right now (not sales)? A rising rental-DOM trend means longer vacancies and softer asking-rent achievability than the comps imply.
- What's the recent tenant-quality profile in this submarket — average credit score on applications, eviction rate, late-payment / NSF rate, and stable-employment percentage? A property-management company in the area should have these aggregated.
- How much new for-sale + rental construction is in the pipeline within 1–3 miles? Heavy new supply typically softens prices + rents 12–24 months out; constrained supply supports both.
Investment metrics
- 1% rule
- 1.58% ✓
- Cap rate
- 11.72%
- Cash-on-cash
- 19.39%
- DSCR
- 1.86
- GRM
- 5.3
CMA / ARV
- ARV (on-the-fly)
- $299,264
- Comps found
- 12
Show comp detail 12 sales within ~0.75 mi
| Address | Dist | Beds/Ba | Sqft | Sold | Price | $/sf | Match |
|---|---|---|---|---|---|---|---|
| 4802 Pearl Crescent Ct | 0.24mi | 4/2.0 (+1) | 1,900 (+6%) | 4mo | $312,990 | $165 | 71 |
| 4810 Pearl Crescent Ct | 0.24mi | 4/2.0 (+1) | 1,900 (+6%) | 4mo | $308,990 | $163 | 70 |
| 4819 Pearl Crescent Ct | 0.24mi | 3/2.0 | 1,949 (+9%) | 5mo | $325,990 | $167 | 70 |
| 4814 Pearl Crescent Ct | 0.24mi | 3/2.0 | 1,602 (-11%) | 5mo | $297,990 | $186 | 67 |
| 3339 Terry St | 0.38mi | 3/2.0 | 1,980 (+10%) | 3mo | $335,900 | $170 | 63 |
| 9525 Gene St | 0.66mi | 3/2.0 | 1,852 (+3%) | 4mo | $297,500 | $161 | 61 |
| 4818 Pearl Crescent Ct | 0.24mi | 4/2.0 (+1) | 2,060 (+15%) | 4mo | $330,990 | $161 | 55 |
| 8718 Rowen Ct | 0.55mi | 3/2.0 | 1,587 (-11%) | 4mo | $289,000 | $182 | 52 |
| 8903 Milby St | 0.73mi | 3/3.5 | 1,600 (-11%) | 2mo | $279,999 | $175 | 40 |
| 14120 Fm1236 Rd | 0.72mi | 3/3.5 | 1,583 (-12%) | 1mo | $279,999 | $177 | 40 |
| 9507 Highland Pointe Dr | 0.68mi | 4/2.0 (+1) | 2,060 (+15%) | 4mo | $345,000 | $167 | 34 |
| 7810 Church St | 0.75mi | 3/1.0 | 1,560 (-13%) | 6mo | $189,900 | $122 | 34 |
Match score weights: distance 35% · size 25% · config 20% · recency 20%. Top-matched comps best support the ARV.
Projected returns pro-forma
-3.0% appreciation · 3.0% rent growth · sell at horizon
- IRR
- 8.9%
- Equity multiple
- 1.35×
- Total profit
- $14,228
- Equity at exit
- $21,620
- IRR
- 18.2%
- Equity multiple
- 2.51×
- Total profit
- $61,439
- Equity at exit
- $12,537
Cash invested: $40,600 (down + closing). Projections, not guarantees.
Landlord ↔ Tenant lean methodology
- Overall (STATE)
- 87 Strongly Landlord-Friendly
- State Texas
- 87 Strongly Landlord-Friendly · R+5
- County
- — inherits STATE
- City
- — inherits STATE
ZIP-level market 77461
- Home prices YoY
- -22.9%
- Active inventory
- 337
- Price-to-rent
- 5.3×
Monthly cashflow live
- Estimated rent
- $2,295 medium interval (Pro) →
- Mortgage (P&I)
- −$760
- Tax from tax record
- −$336 /mo · $4,034/yr
- Insurance
- −$60
- Flood insurance flood zone
- −$66 /mo · $798/yr
- HOA
- −$0
- Vacancy / Maint / Mgmt
- −$482
- Net cashflow
- $590
Break-even live
UW: 25.0% down · 7.5% · 30yr · 1.5% tax · 5.0% vac · 8.0% maint · 8.0% mgmt
Financing live
Cash to close
- Down payment
- $36,250
- Closing costs
- $4,350
- Reserves months
- —
- Total cash needed
- —
Loan-product check · same deal, 3 products live
Conventional
25% down · 7.5% · 30yr
- Down + closing
- —
- Monthly P&I
- —
- Monthly cashflow
- —
- DSCR
- —
- Eligible?
- —
Personal DTI + credit; lowest rate.
DSCR
20% down · 8.5% · 30yr
- Down + closing
- —
- Monthly P&I
- —
- Monthly cashflow
- —
- DSCR
- —
- Eligible?
- —
No personal income docs; deal must DSCR.
Hard money
10% down · 12.0% · 12mo
- Down + closing
- —
- Monthly P&I
- —
- Monthly cashflow
- —
- DSCR
- —
- Eligible?
- —
Short-term bridge; refi at stabilization.
Rent comps 1 comps
| Address | Beds | Baths | Sqft | Rent | $/sqft | DOM | Units | Dist |
|---|---|---|---|---|---|---|---|---|
| 9723 Highland Pointe Dr Needville, TX | 3.0 | 2.0 | 1600 | $2,295 | $1.43 | 5d | 1 | 0.85mi |
Listing history 3 events
-
2026-06-18days on market $145,000 Active 2 DOM
-
2026-06-17remarks 699-char remark
-
2026-06-17$145,000 Active 1 DOM
ⓘ Source: listings_history table (triggers on properties + properties_extension) + one-shot
backfill from property_details.listing_events for pre-trigger history.
Tax reassessment forecast TX · Resets to sale price
- Current annual tax
- $4,034 · $336/mo
- Projected year-2 tax
- $4,034 · $336/mo
- Expected delta
- $0/yr ($0/mo · 0.0%)
ⓘ Screening estimate from a state-policy table — verify with the county assessor before closing.
Climate risk First Street
- Flood 7/10 Severe FEMA zone X (unshaded) · 99% chance over 30 yrs
- Wildfire 2/10 Low
- Heat 9/10 Extreme 7 d/yr ≥109°F today · 23 d/yr by 30 yrs out
- Wind 9/10 Extreme 99% chance of damaging wind over 30 yrs
- Air quality 2/10 Low 1 unhealthy d/yr today · 1 by 30 yrs out
Nearby sold comps map
Loading sold comps map…
Walkable amenities ~0.75 mi
Loading nearby amenities…
Taxation est. · year 1
- Rental income
- $27,540
- − Mortgage interest
- −$8,122
- − Property taxes
- −$4,034
- − Insurance
- −$1,522
- − Repairs & maintenance
- −$2,203
- − Management
- −$2,203
- − Depreciation
- −$4,218
- Taxable income
- $5,237
- Est. tax owed @ 24.0%
- −$1,257
- After-tax cash flow
- $5,819/yr
For passive investors: Depreciation is non-cash, so a rental often shows a tax loss while cash-flowing — sheltering income. Rental losses are passive: they offset passive income freely, and up to $25,000/yr can offset ordinary (W-2) income if you actively participate and your MAGI is under $100k (phasing out to $0 by $150k); unused losses carry forward. On sale, claimed depreciation is recaptured at up to 25%, and gains may owe capital-gains tax (a 1031 exchange can defer both). Figures are a year-1 estimate at your 24.0% rate — not tax advice; consult a CPA.
Schools (NCES district)
- District
- Needville ISD
- NCES district ID
- 4832310
- Math proficiency
- 55% ▲ 1.00%
- Reading proficiency
- 55% ▬ 0.00%
- Median HH income
- $62,900
- Composite
- 48.17/100
- National rank
- #2176
- State rank
- #95 of 826 in TX
Livability — Needville
- Score
- 75/100
- State rank
- #137
- US rank
- #3992
Category grades
Schools grade is shown separately in the Schools card above.
Census & demographics
- Census place
- Needville, TX
- Population (ZIP)
- 12,397
Population outlook (Fort Bend County) Hauer SSP2
- Today (2025)
- 1,004,526 people
- By 2030
- 1,153,104 · +14.8%
- By 2040
- 1,453,718 · +44.7%
- By 2050
- 1,753,781 · +74.6%
- By 2075
- 2,455,772 · +144.5%
- By 2100
- 2,930,528 · +191.7%
Race, ethnicity, and origin ACS 2023
- Neighborhood character
- Majority White (50%)
- Race & ethnicity
- White 50% Hispanic / Latino 45% Two or more races 18% Black 2% Native American 1%
- Hispanic origin (detail)
- Mexican 42%
- Common ancestry
- Lithuanian 2% Slovak 1% Portuguese 1%
- Foreign-born
- 15% · Canada, China
- Languages at home
- 69% English-only · Spanish 28% German/W. Germanic 2%
Political lean MEDSL · Fort Bend
- 2024 margin
- Toss-up / Even · D 49.5% · R 47.9% · Other 2.6%
- 2008→2024 swing
- +4.0pp toward D · 2008: -2.4pp · 2024: 1.6pp
- All cycles
- 2024: D+1.6 2020: D+10.6 2016: D+6.6 2012: R+6.8 2008: R+2.4
Not yet ingested
- Civics
- —
Market trends
- HPI YoY
- ▼ -96.17%
- Current HPI
- 324.3807
- Rent YoY
- —
- Metro
- —
- State GDP YoY
- ▲ 3.95%
- F500 in state
- 110
Industry mix (Fortune 500 HQ in TX)
| Industry | F500 HQs | Revenue |
|---|---|---|
| Energy | 16 | $1,198B |
|
||
| Technology | 5 | $198B |
|
||
| Engineering / Construction | 4 | $72B |
|
||
| Energy Services | 3 | $60B |
|
||
| Utilities | 3 | $41B |
|
||
| Healthcare | 2 | $330B |
|
||
Price history
-19.4% since first listed7 events — show timeline
- 2026-06-16 Listed $145,000 HARMLS
- 2025-06-24 Pending — HARMLS
- 2025-06-16 Pending — HARMLS
- 2025-06-13 Listing Removed — HARMLS
- 2025-03-27 Price Changed $155,000 HARMLS
- 2025-03-05 Price Changed $169,900 HARMLS
- 2025-02-06 Listed $179,900 HARMLS
Property tax history
+5.0%/yrLatest (2025): $4,034 · +12.1% YoY. Source: county tax records.
Cash-flow waterfall
monthlySold comps — $/sqft
last 12 mo · ≤1 miLoading sold comps…