 Duplex
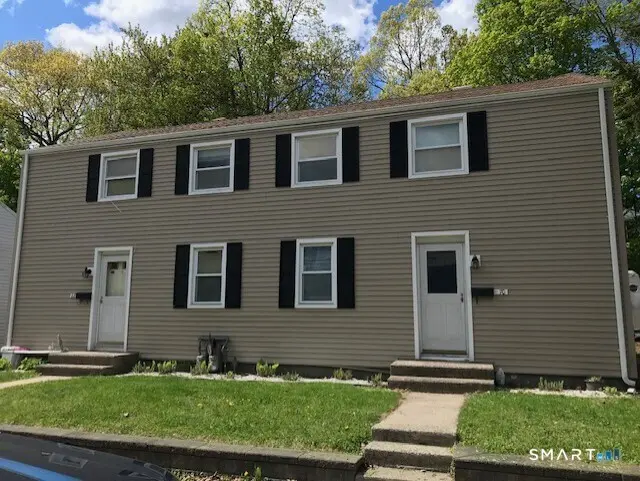
68-70 Pennsylvania Ave · New Britain, CT
Flood risk No data
- FEMA flood zone
- —
- Chance of flooding over 30 yrs
- —
- Est. flood insurance / yr
- —
Fire risk No data
- Est. fire insurance / yr
- —
Heat risk No data
- Hot days now (above threshold)
- —
- Hot days in 30 yrs
- —
Wind risk No data
- Chance of severe wind over 30 yrs
- —
Air-quality risk No data
- Unhealthy air days now
- —
- Unhealthy air days in 30 yrs
- —
Risk factors via First Street. Map © Google.
Why this score? — see what drove the A- grade
The composite is a weighted blend of 9 inputs, each scored 0–100. Each bar is that input's sub-score; the figure is the points it added to the 100-point composite (weight × sub-score).
- Cash flow +30.0/30.0
- ARV discount +15.0/15.0
- DSCR +10.0/10.0
- Appreciation +10.0/10.0
- 1% rule +8.9/10.0
- Livability +3.7/5.0
- Rent growth +2.5/5.0
- Condition / age +2.2/5.0
- Schools +1.0/10.0
$275,000
🖨 Deal sheet (PDF) 📄 Offer letter ✓ Due diligence
Multi-family units
County records classify this as Multi-Family (2-4 Unit). Listing-text estimate: 2 units. confirmed
Listing remarks
Welcome to 68-70 Pennsylvania Avenue, a side-by-side two-family residence offering an opportunity for both investors and owner-occupants. Each unit features 3 bedrooms, separate entrances, utilities, 2 driveways and a 2 car detached garage. Conveniently situated this property provides easy access to local shops, restaurants, and cafes, as well as major schools and medical facilities. Commuters will appreciate the close proximity to Route 9, Route 72, and other key highways, offering a quick and efficient connection to Hartford and surrounding towns. Being sold as-is. No pictures of #68, in need of a complete remodel this side is a blank canvas and is set up as a 4 bedroom with a wall easily
Key facts
- 6,534 sq ft lot
- 2 garage spots
- Built 1942
Property features AI
Finance
- Other: Property listed as multi-family for sale
Exterior
- Parking: Detached garage; Two-car garage
- Utilities: Public water connected; Public sewer connected; Electric hot water (30-gallon)
- Home design: Multi-family property (2-family)
- Construction: Frame construction; Concrete foundation; Tan exterior color
- Exterior features: Level lot; Vinyl siding; Asphalt shingle roof
Interior
- Bedrooms: Six bedrooms total (across units)
- Bathrooms: Two full bathrooms (total)
- Heating & cooling: Gas heating
- Interior features: Total of 10 rooms; Walk-up attic; No basement; Two-unit building (total 2 units)
- Laundry & utility: Laundry located in a utility closet off the kitchen; All units have washer/dryer hook-ups; Hot water: electric 30-gallon tank
Neighborhood map
What this means for you Summary
Snapshot
- This is a 2 × 3-bed/1.0-bath units multifamily listed at $275k. Condition is rated fair.
Deal economics
- At list price, monthly cash flow is $1k ($13k/yr) — positive. Per door: $559/mo.
- The deal already cash-flows at list — no discount required.
- Meets the 1% rule at list price ($4k rent vs $275k).
- Cap rate 11.2% vs local median 4.2% in New Britain — top-decile yield for the area; either an underpriced asset or a hidden risk that comps aren't pricing in. Stress-test before assuming the spread holds.
Location & tenants
- Location reads 74/100 on livability (#67 in CT, #4,936 nationally) — a middle-class / working-renter tenant base. Strengths: health & safety A+, cost of living A, housing A; Watch: crime D, employment D.
- New Britain School District (suburban): math 6% / reading 17% proficiency, ranked #153 of 153 in CT (top 100%) — low school quality limits family demand, transient renter base, plan for 1-2y turnover; 71% free/reduced lunch — lower-income household profile, screen leases tightly.
- Zoned schools: Diloreto Elementary & Middle School (math 4% / reading 15%, grade F, #522 of 553 statewide, top 95%, 842 students, 73% FRL); Slade Middle School (math 0% / reading 8%, grade F, #174 of 175 statewide, top 99%, 795 students, 77% FRL); New Britain High School (math 10% / reading 31%, grade F, #162 of 194 statewide, top 83%, 2,331 students, 71% FRL) — zoned schools at 74% FRL track the district average.
- Market conditions: 23 active listings in the ZIP; 1,867 units permitted in Capitol Planning Region in 2024 (1,399 in 5+ unit buildings).
Forward outlook
- In year one you build about $29k of equity ($2k loan paydown + $28k appreciation (10.0% local appreciation)).
- At projected returns (10.0% appreciation + 3.0% rent growth), your $77k cash investment doubles in ~2 years — after that, you're playing with house money.
- By year 2, paydown + projected appreciation supports a ~$47k cash-out refi (75% LTV) — recoverable capital for the next deal without selling this one.
Negotiation context
- Only 11 days on market — expect competitive offers; lowballing is unlikely to land.
Risks & watch-outs
- Watch-outs: built in 1942 — expect roof / HVAC / electrical / plumbing capex.
Questions for the listing agent
- Can we see the unit-by-unit rent roll, current vacancy, and any below-market leases? What's the average tenancy length?
- What capital expenditures (roof, boiler, parking lot, exteriors) have been made in the last 5 years, and what's planned in the next 2?
- Have any recent inspections been done? Can we get a copy of the seller's disclosures and any deferred-maintenance estimates?
- Built in 1942 — when were the roof, HVAC, electrical panel, plumbing, and water heater last replaced?
- Is there a deadline driving the sale (1031 exchange, divorce, estate, relocation)? That informs how much negotiation room exists.
- Schools are F-rated, which usually means shorter tenancies and higher turnover. Who's the typical renter profile here, and what's been the actual vacancy rate?
- Crime grade is D in this area — have there been break-ins, vandalism, or insurance claims at this property in the last 3 years? What carrier currently insures it and at what premium?
- What's the average days-on-market for RENTAL listings here right now (not sales)? A rising rental-DOM trend means longer vacancies and softer asking-rent achievability than the comps imply.
- What's the recent tenant-quality profile in this submarket — average credit score on applications, eviction rate, late-payment / NSF rate, and stable-employment percentage? A property-management company in the area should have these aggregated.
- How much new apartment / multifamily construction is in the pipeline within 1–3 miles? Heavy new supply (>2% of stock underway) typically softens rents 12–24 months out; light construction supports rent growth.
Investment metrics
- 1% rule
- 1.39% ✓
- Cap rate
- 11.18%
- Cash-on-cash
- 17.44%
- DSCR
- 1.78
- GRM
- 6.0
CMA / ARV
- ARV (median comp)
- $370,000
- List price
- $275,000
- Delta
- -25.68%
- Verdict
- UNDERPRICED
- Comps
- 20 within 1.0 mi
Show comp detail 8 sales within ~0.75 mi
| Address | Dist | Beds/Ba | Sqft | Sold | Price | $/sf | Match |
|---|---|---|---|---|---|---|---|
| 94 Pennsylvania Ave | 0.06mi | 6/2.0 | 2,112 (0%) | 3mo | $402,000 | $190 | 94 |
| 76 Texas Dr | 0.19mi | 6/2.0 | 2,112 (0%) | 4mo | $350,000 | $166 | 88 |
| 161 Pennsylvania Ave | 0.19mi | 6/2.5 | 2,112 (0%) | 20mo | $389,500 | $184 | 73 |
| 27 Holmes Ave | 0.45mi | 6/3.0 | 2,093 (-1%) | 10mo | $360,000 | $172 | 65 |
| 19 Bradley St | 0.39mi | 6/2.0 | 2,376 (+12%) | 19mo | $430,000 | $181 | 45 |
| 19 Ridgewood St | 0.59mi | 6/2.0 | 2,408 (+14%) | 8mo | $410,000 | $170 | 42 |
| 96 Garden St | 0.48mi | 5/4.0 (-1) | 2,393 (+13%) | 6mo | $400,000 | $167 | 38 |
| 59 Victoria Rd | 0.44mi | 5/3.0 (-1) | 2,423 (+15%) | 20mo | $340,000 | $140 | 30 |
Match score weights: distance 35% · size 25% · config 20% · recency 20%. Top-matched comps best support the ARV.
Projected returns pro-forma
10.0% appreciation · 3.0% rent growth · sell at horizon
- IRR
- 37.2%
- Equity multiple
- 3.87×
- Total profit
- $221,094
- Equity at exit
- $247,742
- IRR
- 32.1%
- Equity multiple
- 8.73×
- Total profit
- $595,159
- Equity at exit
- $534,265
Cash invested: $77,000 (down + closing). Projections, not guarantees.
Landlord ↔ Tenant lean methodology
- Overall (STATE)
- 27 Tenant-Leaning
- State Connecticut
- 27 Tenant-Leaning · D+7
- County
- — inherits STATE
- City
- — inherits STATE
ZIP-level market 06052
- Home prices YoY
- 13.2%
- Active inventory
- 23
- Price-to-rent
- 12.0×
Monthly cashflow live
- Estimated rent
- $3,822 high interval (Pro) →
- Mortgage (P&I)
- −$1,442
- Tax est. 1.5%
- −$344 /mo · $4,125/yr
- Insurance
- −$115
- HOA
- −$0
- Vacancy / Maint / Mgmt
- −$803
- Net cashflow
- $1,119
Break-even live
Sensitivity live
| Price | -10% $1,309 | -5% $1,214 | +0% $1,119 | +5% $1,024 | +10% $929 |
|---|---|---|---|---|---|
| Rent | -10% $817 | -5% $968 | +0% $1,119 | +5% $1,270 | +10% $1,421 |
| Rate | -1.0pp $1,257 | -0.5pp $1,189 | base $1,119 | +0.5pp $1,048 | +1.0pp $975 |
2-unit breakdown (identical units grouped — click to expand)
| Units | Beds | Baths | Est. rent |
|---|---|---|---|
| 2× units | 3 | 1 | $3,822 |
| #1 | 3 | 1 | $1,911 |
| #2 | 3 | 1 | $1,911 |
| Total (2 units) | $3,822 | ||
UW: 25.0% down · 7.5% · 30yr · 1.5% tax · 5.0% vac · 8.0% maint · 8.0% mgmt
Financing live
Cash to close
- Down payment
- $68,750
- Closing costs
- $8,250
- Reserves months
- —
- Total cash needed
- —
Loan-product check · same deal, 3 products live
Conventional
25% down · 7.5% · 30yr
- Down + closing
- —
- Monthly P&I
- —
- Monthly cashflow
- —
- DSCR
- —
- Eligible?
- —
Personal DTI + credit; lowest rate.
DSCR
20% down · 8.5% · 30yr
- Down + closing
- —
- Monthly P&I
- —
- Monthly cashflow
- —
- DSCR
- —
- Eligible?
- —
No personal income docs; deal must DSCR.
Hard money
10% down · 12.0% · 12mo
- Down + closing
- —
- Monthly P&I
- —
- Monthly cashflow
- —
- DSCR
- —
- Eligible?
- —
Short-term bridge; refi at stabilization.
Listing history 2 events
-
2026-05-16status Under Contract 833-char remark
-
2026-05-03$275,000 Active 833-char remark
ⓘ Source: listings_history table (triggers on properties + properties_extension) + one-shot
backfill from property_details.listing_events for pre-trigger history.
Nearby sold comps map
Loading sold comps map…
Walkable amenities ~0.75 mi
Loading nearby amenities…
Taxation est. · year 1
- Rental income
- $45,864
- − Mortgage interest
- −$15,404
- − Property taxes
- −$4,125
- − Insurance
- −$1,375
- − Repairs & maintenance
- −$3,669
- − Management
- −$3,669
- − Depreciation
- −$8,000
- Taxable income
- $9,621
- Est. tax owed @ 24.0%
- −$2,309
- After-tax cash flow
- $11,118/yr
For passive investors: Depreciation is non-cash, so a rental often shows a tax loss while cash-flowing — sheltering income. Rental losses are passive: they offset passive income freely, and up to $25,000/yr can offset ordinary (W-2) income if you actively participate and your MAGI is under $100k (phasing out to $0 by $150k); unused losses carry forward. On sale, claimed depreciation is recaptured at up to 25%, and gains may owe capital-gains tax (a 1031 exchange can defer both). Figures are a year-1 estimate at your 24.0% rate — not tax advice; consult a CPA.
Condition & rehab AI · 12 photos
A moderate rehab opportunity with dated interiors and exterior siding in need of repair. Updates to paint, flooring, and kitchen/bathroom would significantly enhance its value.
Repairs flagged
- Major Exterior siding — Significant wear and discoloration
- Moderate Kitchen cabinets — Appears dated and could benefit from updating
- Moderate Bathroom fixtures — Appears dated and could benefit from updating
- Minor Paint — Faded in some areas
Value-add opportunities
- Both Paint and flooring updates — Enhances curb appeal and interior aesthetics
- Both Kitchen and bathroom updates — Modernizes spaces and improves functionality
- Both Exterior siding repair — Improves curb appeal and structural integrity
Renovation cost estimate screening
| Repair item | Severity | Est. cost |
|---|---|---|
| Exterior siding · Significant wear and discoloration | Major | $15,000–50,000 |
| Kitchen cabinets · Appears dated and could benefit from updating | Moderate | $3,000–15,000 |
| Bathroom fixtures · Appears dated and could benefit from updating | Moderate | $3,000–15,000 |
| Paint · Faded in some areas | Minor | $500–3,000 |
| Total estimated repair cost · 4 items | $21,500–83,000 |
Value-add ROI direction
- Both Paint and flooring updates — Enhances curb appeal and interior aesthetics ↑
- Both Kitchen and bathroom updates — Modernizes spaces and improves functionality ↑
- Both Exterior siding repair — Improves curb appeal and structural integrity ↑
ⓘ Cost ranges are severity-bucket heuristics (US national rule-of-thumb). Get contractor quotes + a written scope before underwriting a rehab budget.
Schools (NCES district)
- District
- New Britain School District
- NCES district ID
- 0902670
- Math proficiency
- 6% ▼ -6.00%
- Reading proficiency
- 17% ▼ -5.00%
- Median HH income
- $40,827
- Composite
- 9.95/100
- National rank
- #9816
- State rank
- #153 of 153 in CT
Livability — New Britain
- Score
- 74/100
- State rank
- #67
- US rank
- #4936
Category grades
Schools grade is shown separately in the Schools card above.
Census & demographics
- Census place
- New Britain, CT
- City population
- 66,322
- Population (ZIP)
- 8,232
Population outlook (Capitol County) Hauer SSP2
- By 2040
- 1,063,519
Race, ethnicity, and origin ACS 2023
- Neighborhood character
- Diverse neighborhood (Simpson 0.62)
- Race & ethnicity
- White 47% Hispanic / Latino 38% Two or more races 17% Black 11%
- Hispanic origin (detail)
- Puerto Rican 25% Dominican 2% Salvadoran 1%
- Common ancestry
- Romanian 13% Lithuanian 3% Italian 1%
- Foreign-born
- 13% · Canada
- Languages at home
- 64% English-only · Spanish 29% Russian/Polish/Slavic 4% French/Haitian/Cajun 1%
Political lean MEDSL · Capitol
- 2024 margin
- Strong D (+21.9) · D 60.1% · R 38.2% · Other 1.7%
- All cycles
- 2024: D+21.9
Not yet ingested
- Civics
- —
Market trends
- HPI YoY
- ▲ 42.04%
- Current HPI
- 359.7743
- Rent YoY
- —
- Metro
- —
- State GDP YoY
- ▲ 1.06%
- F500 in state
- 38
Industry mix (Fortune 500 HQ in CT)
| Industry | F500 HQs | Revenue |
|---|---|---|
| Industrial Machinery | 4 | $38B |
|
||
| Insurance | 3 | $71B |
|
||
| Financial Services | 2 | $25B |
|
||
| Transportation / Logistics | 2 | $18B |
|
||
| Healthcare | 1 | $247B |
|
||
| Telecommunications | 1 | $55B |
|
||
Price history
2 events — show timeline
- 2026-05-16 Pending — Smart MLS
- 2026-05-03 Listed $275,000 Smart MLS
Cash-flow waterfall
monthlySold comps — $/sqft
last 12 mo · ≤1 miLoading sold comps…