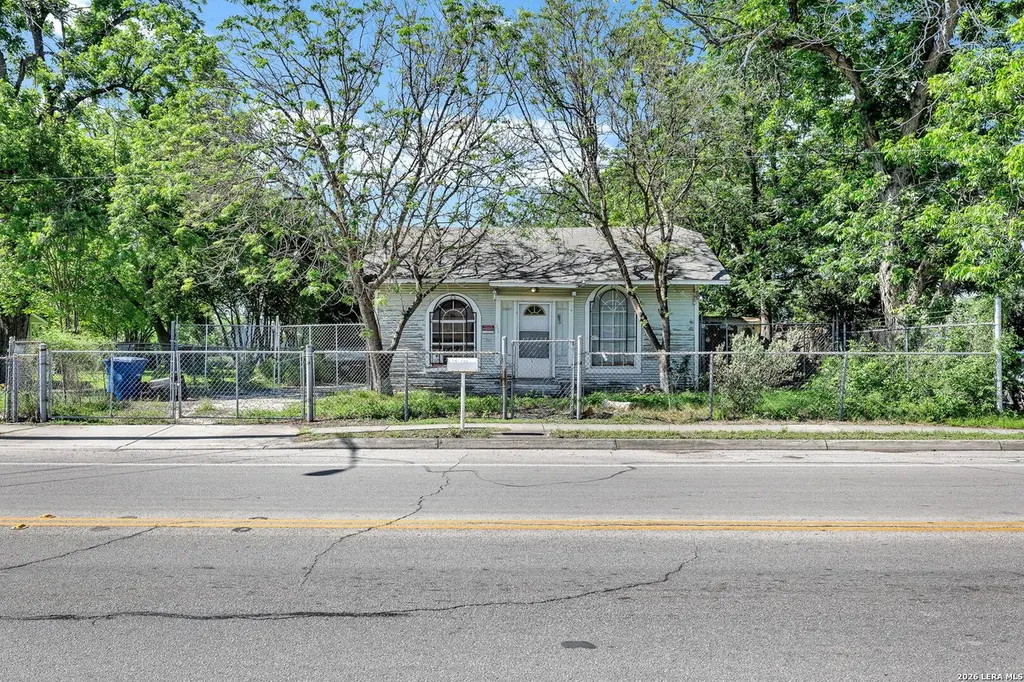
1346 Kirk Pl · San Antonio, TX
Flood risk 1/10 · Minimal
- FEMA flood zone
- X (unshaded)
- Chance of flooding over 30 yrs
- 0.0%
- Est. flood insurance / yr
- $507 – $1,088
Fire risk 1/10 · Minimal
- Est. fire insurance / yr
- $1,222 – $2,270
Heat risk 8/10 · Major
- Hot days now (above 108°F)
- 7 days/yr
- Hot days in 30 yrs
- 22 days/yr
Wind risk 8/10 · Major
- Chance of severe wind over 30 yrs
- 80.0%
Air-quality risk 2/10 · Minimal
- Unhealthy air days now
- 1 days/yr
- Unhealthy air days in 30 yrs
- 2 days/yr
Risk factors via First Street. Map © Google.
Why this score? — see what drove the B+ grade
The composite is a weighted blend of 9 inputs, each scored 0–100. Each bar is that input's sub-score; the figure is the points it added to the 100-point composite (weight × sub-score).
- Cash flow +30.0/30.0
- ARV discount +15.0/15.0
- DSCR +10.0/10.0
- 1% rule +9.2/10.0
- Livability +4.0/5.0
- Appreciation +3.9/10.0
- Rent growth +2.5/5.0
- Schools +1.3/10.0
- Condition / age +1.0/5.0
$95,000
🖨 Deal sheet 📄 Offer letter ✓ Due diligence
Listing remarks
Investor Special. Priced to sell.
Key facts
- 7,013 sq ft lot
- Built 1925
- Listed 24 days
Property features AI
Finance
- Other: Possession at closing/funding; For sale by LPT Realty, LLC
- Financial info: Down payment resources not indicated
- HOA & community: Subdivision legal name: EDGEWOOD
Exterior
- Utilities: City water and sewer
- Home design: Pre-owned property; Approximate age: 101 years; Composition roof
- Construction: Asbestos shingle exterior; Composition roof
- Exterior features: Asbestos shingle exterior; Subdivision: EDGEWOOD
Interior
- Kitchen: Kitchen — approx. 7 x 4
- Bedrooms: Master bedroom (lower level) — approx. 8 x 5; Bedroom 2 — approx. 8 x 8; Bedroom 3 — approx. 8 x 8
- Flooring: Linoleum flooring
- Bathrooms: 1 full bathroom
- Heating & cooling: Central heating (natural gas); Central air conditioning
- Interior features: Ceiling fans; All window coverings remain; One living area
Neighborhood map
What this means for you Summary
Snapshot
- This is a 3-bed/1.0-bath single-family listed at $95k. Condition is rated poor.
Deal economics
- At list price, monthly cash flow is $408 ($5k/yr) — positive.
- The deal already cash-flows at list — no discount required.
- Meets the 1% rule at list price ($1k rent vs $95k).
- Recommended offer: $94k (1.5% below list) — sets the bar for market timing.
- Cap rate 11.4% vs local median 3.8% in San Antonio — top-decile yield for the area; either an underpriced asset or a hidden risk that comps aren't pricing in. Stress-test before assuming the spread holds.
Location & tenants
- Location reads 80/100 on livability (#31 in TX, #1,616 nationally) — a professional / high-income tenant draw. Strengths: amenities A+, commute A+, cost of living A+; Watch: crime F.
- Edgewood ISD (urban): math 12% / reading 21% proficiency, ranked #812 of 826 in TX (top 98%) — low school quality limits family demand, transient renter base, plan for 1-2y turnover.
- Zoned schools: Alonso S Perales El (math 22% / reading 27%, grade F, #3,052 of 4,322 statewide, top 74%, 353 students, 93% FRL); John F Kennedy H S (math 17% / reading 18%, grade F, #1,451 of 1,632 statewide, top 89%, 1,042 students, 92% FRL) — zoned schools average 93% FRL vs 24% district-wide (68 pts higher); higher-poverty schools than district average — tighter screening recommended.
- Market conditions: 7 active listings in the ZIP; 11 comparable units currently listed for rent nearby; rentals at typical pace (median 22d on market — plan ~3-4 weeks tenant-placement turnaround); 8,308 units permitted in Bexar County in 2024 (2,506 in 5+ unit buildings).
Forward outlook
- Local home prices are declining (-2.3%/yr); year-one equity from $657 of loan paydown is wiped out by about $2k of value loss. Plan a longer hold.
- Bexar County population projected at +50% by 2050 — long-run rental-demand tailwind backs the buy-and-hold thesis.
- At projected returns (-2.3% appreciation + 3.0% rent growth), your $27k cash investment doubles in ~6 years — after that, you're playing with house money.
Negotiation context
- It's been on market 25 days — a 2% lower offer ($94k) is reasonable based on typical stale-listing flexibility.
Risks & watch-outs
- Watch-outs: built in 1925 — expect roof / HVAC / electrical / plumbing capex.
- Climate carrying-cost: severe wind risk, 80% chance of damaging wind over 30y; extreme-heat days projected 7→22/yr by 2055 (HVAC capex compounding) — expect insurance premiums to compound above CPI over the hold.
Questions for the listing agent
- Have any recent inspections been done? Can we get a copy of the seller's disclosures and any deferred-maintenance estimates?
- Built in 1925 — when were the roof, HVAC, electrical panel, plumbing, and water heater last replaced?
- Is there a deadline driving the sale (1031 exchange, divorce, estate, relocation)? That informs how much negotiation room exists.
- Crime grade is F in this area — have there been break-ins, vandalism, or insurance claims at this property in the last 3 years? What carrier currently insures it and at what premium?
- What's the average days-on-market for RENTAL listings here right now (not sales)? A rising rental-DOM trend means longer vacancies and softer asking-rent achievability than the comps imply.
- What's the recent tenant-quality profile in this submarket — average credit score on applications, eviction rate, late-payment / NSF rate, and stable-employment percentage? A property-management company in the area should have these aggregated.
- How much new for-sale + rental construction is in the pipeline within 1–3 miles? Heavy new supply typically softens prices + rents 12–24 months out; constrained supply supports both.
Investment metrics
- 1% rule
- 1.42% ✓
- Cap rate
- 11.44%
- Cash-on-cash
- 18.39%
- DSCR
- 1.82
- GRM
- 5.9
CMA / ARV
- ARV (on-the-fly)
- $184,184
- Comps found
- 5
Show comp detail 5 sales within ~0.75 mi
| Address | Dist | Beds/Ba | Sqft | Sold | Price | $/sf | Match |
|---|---|---|---|---|---|---|---|
| 3123 Neptune St | 0.60mi | 3/2.0 | 1,296 (+1%) | 5mo | $239,000 | $184 | 63 |
| 2143 Calle Del Sol | 0.62mi | 3/2.0 | 1,292 (+0%) | 5mo | $184,999 | $143 | 62 |
| 2115 SW 19th St | 0.62mi | 3/2.0 | 1,334 (+4%) | 2mo | $230,000 | $172 | 60 |
| 1350 Barclay | 0.49mi | 3/1.0 | 1,120 (-13%) | 14mo | $110,000 | $98 | 44 |
| 1051 Kirk Pl | 0.41mi | 3/2.0 | 1,421 (+10%) | 22mo | $165,000 | $116 | 41 |
Match score weights: distance 35% · size 25% · config 20% · recency 20%. Top-matched comps best support the ARV.
Projected returns pro-forma
-2.26% appreciation · 3.0% rent growth · sell at horizon
- IRR
- 12.2%
- Equity multiple
- 1.51×
- Total profit
- $13,551
- Equity at exit
- $17,308
- IRR
- 20.0%
- Equity multiple
- 2.80×
- Total profit
- $47,922
- Equity at exit
- $13,716
Cash invested: $26,600 (down + closing). Projections, not guarantees.
Landlord ↔ Tenant lean methodology
- Overall (STATE)
- 87 Strongly Landlord-Friendly
- State Texas
- 87 Strongly Landlord-Friendly · R+5
- County
- — inherits STATE
- City
- — inherits STATE
ZIP-level market 78226
- Home prices YoY
- -0.9%
- Active inventory
- 7
- Price-to-rent
- 5.9×
Monthly cashflow live
- Estimated rent
- $1,347 high interval (Pro) →
- Mortgage (P&I)
- −$498
- Tax est. 1.5%
- −$119 /mo · $1,425/yr
- Insurance
- −$40
- HOA
- −$0
- Vacancy / Maint / Mgmt
- −$283
- Net cashflow
- $408
Break-even live
UW: 25.0% down · 7.5% · 30yr · 1.5% tax · 5.0% vac · 8.0% maint · 8.0% mgmt
Financing live
Cash to close
- Down payment
- $23,750
- Closing costs
- $2,850
- Reserves months
- —
- Total cash needed
- —
Loan-product check · same deal, 3 products live
Conventional
25% down · 7.5% · 30yr
- Down + closing
- —
- Monthly P&I
- —
- Monthly cashflow
- —
- DSCR
- —
- Eligible?
- —
Personal DTI + credit; lowest rate.
DSCR
20% down · 8.5% · 30yr
- Down + closing
- —
- Monthly P&I
- —
- Monthly cashflow
- —
- DSCR
- —
- Eligible?
- —
No personal income docs; deal must DSCR.
Hard money
10% down · 12.0% · 12mo
- Down + closing
- —
- Monthly P&I
- —
- Monthly cashflow
- —
- DSCR
- —
- Eligible?
- —
Short-term bridge; refi at stabilization.
Rent comps 11 comps
| Address | Beds | Baths | Sqft | Rent | $/sqft | DOM | Units | Dist |
|---|---|---|---|---|---|---|---|---|
| 3103 Neptune St San Antonio, TX | 3.0 | 2.0 | 1008 | $1,350 | $1.34 | 43d | 1 | 0.63mi |
| 2114 Jupiter St San Antonio, TX | 3.0 | 3.0 | 1233 | $1,457 | $1.18 | 22d | 1 | 0.67mi |
| 1135 Ceralvo St San Antonio, TX | 3.0 | 2.0 | 1164 | $1,450 | $1.25 | 22d | 1 | 0.86mi |
| 1135 Ceralvo St San Antonio, TX | 3.0 | 2.0 | 1164 | $1,450 | $1.25 | 4d | 1 | 0.86mi |
| 118 Carthage Ct San Antonio, TX | 3.0 | 2.0 | 1368 | $1,450 | $1.06 | 17d | 1 | 1.17mi |
| 626 Kirk Pl San Antonio, TX | 2.0 | 1.0 | 912 | $1,100 | $1.21 | 20d | 1 | 1.17mi |
| 463 Linares St San Antonio, TX | 3.0 | 1.0 | 1220 | $1,400 | $1.15 | 24d | 1 | 1.18mi |
| 2003 S Zarzamora St San Antonio, TX | 1.0–4.0 | 1.0–2.0 | 1028 | $1,257 | $1.22 | 24d | 1 | 1.24mi |
| 1938 S Zarzamora St Unit 710 San Antonio, TX | 2.0 | 2.0 | 955 | $1,102 | $1.15 | 3d | 1 | 1.29mi |
| 450 Taft Blvd San Antonio, TX | 3.0 | 1.0 | 883 | $1,295 | $1.47 | 43d | 1 | 1.40mi |
| 319 Noria St San Antonio, TX | 3.0 | 1.0 | 1002 | $1,100 | $1.10 | 24d | 1 | 1.50mi |
Listing history 15 events
-
2026-06-18statusdays on market $95,000 Active 25 DOM
-
2026-06-17days on market $95,000 Price Change 24 DOM
-
2026-06-16days on market $95,000 Price Change 23 DOM
-
2026-06-15days on market $95,000 Price Change 22 DOM
-
2026-06-13days on market $95,000 Price Change 20 DOM
-
2026-06-12days on market $95,000 Price Change 19 DOM
-
2026-06-09days on market $95,000 Price Change 16 DOM
-
2026-06-08days on market $95,000 Price Change 15 DOM
-
2026-06-08pricestatusdays on market $95,000 Price Change 14 DOM
-
2026-06-07statusdays on market $110,000 Active 13 DOM
-
2026-06-03days on market $110,000 New 10 DOM
-
2026-06-02days on market $110,000 New 9 DOM
-
2026-06-01days on market $110,000 New 8 DOM
-
2026-05-31remarks 33-char remark
-
2026-05-31$110,000 New 7 DOM
ⓘ Source: listings_history table (triggers on properties + properties_extension) + one-shot
backfill from property_details.listing_events for pre-trigger history.
Climate risk First Street
- Flood 1/10 Low FEMA zone X (unshaded) · 0% chance over 30 yrs
- Wildfire 1/10 Low
- Heat 8/10 Severe 7 d/yr ≥108°F today · 22 d/yr by 30 yrs out
- Wind 8/10 Severe 80% chance of damaging wind over 30 yrs
- Air quality 2/10 Low 1 unhealthy d/yr today · 2 by 30 yrs out
Nearby sold comps map
Loading sold comps map…
Walkable amenities ~0.75 mi
Loading nearby amenities…
Taxation est. · year 1
- Rental income
- $16,166
- − Mortgage interest
- −$5,321
- − Property taxes
- −$1,425
- − Insurance
- −$475
- − Repairs & maintenance
- −$1,293
- − Management
- −$1,293
- − Depreciation
- −$2,764
- Taxable income
- $3,594
- Est. tax owed @ 24.0%
- −$863
- After-tax cash flow
- $4,030/yr
For passive investors: Depreciation is non-cash, so a rental often shows a tax loss while cash-flowing — sheltering income. Rental losses are passive: they offset passive income freely, and up to $25,000/yr can offset ordinary (W-2) income if you actively participate and your MAGI is under $100k (phasing out to $0 by $150k); unused losses carry forward. On sale, claimed depreciation is recaptured at up to 25%, and gains may owe capital-gains tax (a 1031 exchange can defer both). Figures are a year-1 estimate at your 24.0% rate — not tax advice; consult a CPA.
Condition & rehab AI · 11 photos
This property requires extensive repairs and maintenance to bring it up to a livable condition. Immediate steps include cleaning and organizing the interior, painting, and replacing damaged flooring and cabinets. The property has significant potential for value increase with these improvements.
Repairs flagged
- Major exterior siding — Severe peeling and damage
- Major interior walls — Severe peeling and damage
- Major kitchen cabinets — Severe damage and wear
- Major bathroom fixtures — Severe damage and wear
- Major flooring — Severe wear and damage
- Unknown HVAC system — No visible system in photos
Value-add opportunities
- Both Clean and organize interior — Improves appearance and functionality
- Both Paint exterior and interior — Enhances curb appeal and value
- Both Replace damaged flooring — Improves comfort and value
- Both Replace damaged cabinets and fixtures — Improves functionality and value
- Both Inspect and replace HVAC system — Improves comfort and value
Renovation cost estimate screening
| Repair item | Severity | Est. cost |
|---|---|---|
| exterior siding · Severe peeling and damage | Major | $15,000–50,000 |
| interior walls · Severe peeling and damage | Major | $15,000–50,000 |
| kitchen cabinets · Severe damage and wear | Major | $15,000–50,000 |
| bathroom fixtures · Severe damage and wear | Major | $15,000–50,000 |
| flooring · Severe wear and damage | Major | $15,000–50,000 |
| HVAC system · No visible system in photos | Unknown | $500–3,000 |
| Total estimated repair cost · 6 items | $75,500–253,000 |
Value-add ROI direction
- Both Clean and organize interior — Improves appearance and functionality ↑
- Both Paint exterior and interior — Enhances curb appeal and value ↑
- Both Replace damaged flooring — Improves comfort and value ↑
- Both Replace damaged cabinets and fixtures — Improves functionality and value ↑
- Both Inspect and replace HVAC system — Improves comfort and value ↑
ⓘ Cost ranges are severity-bucket heuristics (US national rule-of-thumb). Get contractor quotes + a written scope before underwriting a rehab budget.
Schools (NCES district)
- District
- Edgewood ISD
- NCES district ID
- 4818150
- Math proficiency
- 12% ▼ -18.00%
- Reading proficiency
- 21% ▼ -5.00%
- Median HH income
- $27,419
- Composite
- 12.82/100
- National rank
- #9597
- State rank
- #812 of 826 in TX
Livability — San Antonio
- Score
- 80/100
- State rank
- #31
- US rank
- #1616
Category grades
Schools grade is shown separately in the Schools card above.
Census & demographics
- Census place
- San Antonio, TX
- City population
- 1,806,925
- Population (ZIP)
- 6,907
Population outlook (Bexar County) Hauer SSP2
- Today (2025)
- 2,336,851 people
- By 2030
- 2,560,728 · +9.6%
- By 2040
- 3,020,569 · +29.3%
- By 2050
- 3,493,522 · +49.5%
- By 2075
- 4,668,459 · +99.8%
- By 2100
- 5,533,242 · +136.8%
Race, ethnicity, and origin ACS 2023
- Neighborhood character
- Predominantly Hispanic (87%)
- Race & ethnicity
- Hispanic / Latino 87% Two or more races 27% White 8% Black 4% Native American 2%
- Hispanic origin (detail)
- Mexican 73%
- Common ancestry
- Portuguese 1%
- Foreign-born
- 12% · Canada
- Languages at home
- 50% English-only · Spanish 50%
Political lean MEDSL · Bexar
- 2024 margin
- Lean D (+9.8) · D 54.3% · R 44.6% · Other 1.1%
- 2008→2024 swing
- +4.2pp toward D · 2008: 5.6pp · 2024: 9.8pp
- All cycles
- 2024: D+9.8 2020: D+18.2 2016: D+13.5 2012: D+4.6 2008: D+5.6
Not yet ingested
- Civics
- —
Market trends
- HPI YoY
- ▼ -2.26%
- Current HPI
- 244.9905
- Rent YoY
- —
- Metro
- —
- State GDP YoY
- ▲ 3.95%
- F500 in state
- 110
Industry mix (Fortune 500 HQ in TX)
| Industry | F500 HQs | Revenue |
|---|---|---|
| Energy | 16 | $1,198B |
|
||
| Technology | 5 | $198B |
|
||
| Engineering / Construction | 4 | $72B |
|
||
| Energy Services | 3 | $60B |
|
||
| Utilities | 3 | $41B |
|
||
| Healthcare | 2 | $330B |
|
||
Price history
1 event — show timeline
- 2026-05-24 Listed $110,000 LERA
Cash-flow waterfall
monthlySold comps — $/sqft
last 12 mo · ≤1 miLoading sold comps…