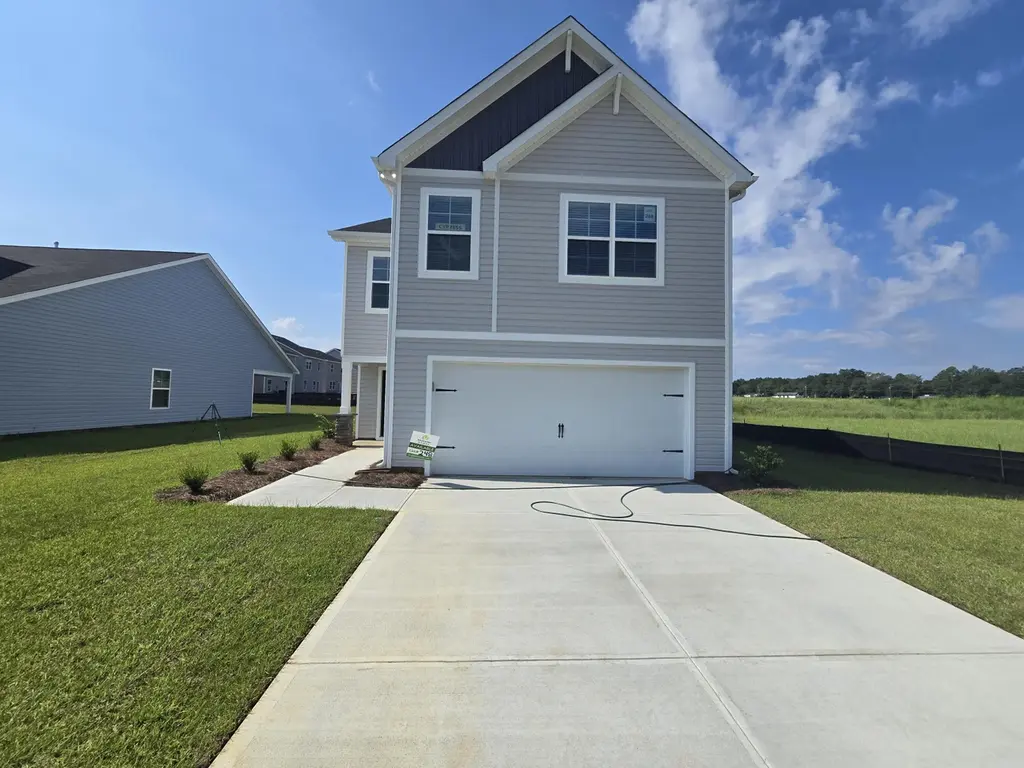
5892 Cobalt Falls Bnd · Aiken, SC
Flood risk No data
- FEMA flood zone
- —
- Chance of flooding over 30 yrs
- —
- Est. flood insurance / yr
- —
Fire risk No data
- Est. fire insurance / yr
- —
Heat risk No data
- Hot days now (above threshold)
- —
- Hot days in 30 yrs
- —
Wind risk No data
- Chance of severe wind over 30 yrs
- —
Air-quality risk No data
- Unhealthy air days now
- —
- Unhealthy air days in 30 yrs
- —
Risk factors via First Street. Map © Google.
Why this score? — see what drove the D+ grade
The composite is a weighted blend of 9 inputs, each scored 0–100. Each bar is that input's sub-score; the figure is the points it added to the 100-point composite (weight × sub-score).
- ARV discount +14.9/15.0
- Cash flow +11.8/30.0
- Condition / age +4.0/5.0
- Rent growth +3.8/5.0
- 1% rule +3.5/10.0
- DSCR +3.5/10.0
- Livability +3.4/5.0
- Schools +3.2/10.0
- Appreciation +0.0/10.0
$249,990
🖨 Deal sheet 📄 Offer letter ✓ Due diligence
Listing remarks
MOVE-IN READY INCENTIVES (Close by 3/31/26) - Receive up to 6,000 in seller cc toward closing costs when using the preferred lending partner and 3000 in choice of options Need more space? The Cypress floor plan delivers 2,075 square feet of thoughtfully designed living space with 4 bedrooms and 2.5 bathrooms, ideal for growing households or those who want room to spread out. The main level features a bright, open layout with a welcoming entryway, complete with a front closet and convenient powder room. Upstairs, the primary suite is privately positioned at the rear of the home, offering a quiet retreat from the rest of the living areas. Three additional bedrooms share a well-appointed fu
Key facts
- 7,405 sq ft lot
- Garage
- Built 2025
Neighborhood map
What this means for you Summary
Snapshot
- This is a 4-bed/2.5-bath single-family listed at $250k. Condition is rated good.
Deal economics
- At list price, monthly cash flow is $-67 ($-810/yr) — negative.
- To cash-flow at today's rent, offer at most $240k (3.9% below list).
- To meet the 1% rule (rent ≥ 1% of price), the offer needs to be $212k (15.1% below list).
- Recommended offer: $212k (15.1% below list) — sets the bar for 1% rule.
- Cap rate 6.0% vs local median 4.1% in Aiken — top-decile yield for the area; either an underpriced asset or a hidden risk that comps aren't pricing in. Stress-test before assuming the spread holds.
Location & tenants
- Location reads 67/100 on livability (#93 in SC) — a middle-class / working-renter tenant base. Strengths: housing A+, health & safety A+, cost of living A; Watch: crime F, commute F.
- Aiken 01 (suburban): math 31% / reading 44% proficiency, ranked #36 of 80 in SC (top 45%) — families likely to look elsewhere, expect single-tenant / working-renter base with shorter leases.
- Zoned schools: North Aiken Elementary (math 12% / reading 19%, grade F, #539 of 597 statewide, top 91%, 466 students, 100% FRL); Schofield Middle (math 18% / reading 30%, grade F, #167 of 229 statewide, top 74%, 401 students, 100% FRL); Aiken High (math 19% / reading 84%, grade D+, #146 of 196 statewide, top 75%, 1,195 students, 100% FRL) — zoned schools average 100% FRL vs 54% district-wide (46 pts higher); higher-poverty schools than district average — tighter screening recommended.
- Market conditions: Rents rising fast (+5.1%/yr); 521 active listings in the ZIP; 6 comparable units currently listed for rent nearby; rentals at typical pace (median 24d on market — plan ~3-4 weeks tenant-placement turnaround); 2,500 units permitted in Aiken County in 2024 (1,023 in 5+ unit buildings).
- This rent runs 43% of the median local income ($60k/yr) — at the standard rent-burdened threshold; future hikes will face affordability resistance.
Forward outlook
- Local home prices are declining (-3.0%/yr); year-one equity from $2k of loan paydown is wiped out by about $8k of value loss. Plan a longer hold.
- Aiken County population projected at +9% by 2050 — modest demand growth; plan on rents tracking national, not racing it.
Negotiation context
- Only 0 days on market — expect competitive offers; lowballing is unlikely to land.
- 3 sale attempts with the ask held roughly flat each time — persistent listings suggest the price (not the market) is what's stuck; bring a comps-based counter.
Questions for the listing agent
- What do current leases actually rent for vs. the listed asking? Can we see a recent rent roll and the last 12 months of T-12 income?
- What does the HOA fee cover, when was the last increase, and are there any pending special assessments or reserve-fund shortfalls?
- Is there a deadline driving the sale (1031 exchange, divorce, estate, relocation)? That informs how much negotiation room exists.
- Schools are B-rated — typically a magnet for longer-tenancy family renters. What's the average tenant stay here, and is there a school-zone premium baked into asking?
- Crime grade is F in this area — have there been break-ins, vandalism, or insurance claims at this property in the last 3 years? What carrier currently insures it and at what premium?
- The area grade is low — what's the realistic commute time and amenity access for the typical tenant pool here? Any planned neighborhood developments (good or bad) we should know about?
- What's the average days-on-market for RENTAL listings here right now (not sales)? A rising rental-DOM trend means longer vacancies and softer asking-rent achievability than the comps imply.
- What's the recent tenant-quality profile in this submarket — average credit score on applications, eviction rate, late-payment / NSF rate, and stable-employment percentage? A property-management company in the area should have these aggregated.
- How much new for-sale + rental construction is in the pipeline within 1–3 miles? Heavy new supply typically softens prices + rents 12–24 months out; constrained supply supports both.
Investment metrics
- 1% rule
- 0.85% ✗
- Cap rate
- 5.97%
- Cash-on-cash
- -1.16%
- DSCR
- 0.95
- GRM
- 9.8
CMA / ARV
- ARV (on-the-fly)
- $298,800
- Comps found
- 12
Show comp detail 12 sales within ~0.75 mi
| Address | Dist | Beds/Ba | Sqft | Sold | Price | $/sf | Match |
|---|---|---|---|---|---|---|---|
| 7136 Foggy River Dr | 0.20mi | 4/2.5 | 1,967 (-5%) | 6mo | $274,400 | $140 | 77 |
| 438 Narrow Bridge Ct | 0.17mi | 5/2.5 (+1) | 2,230 (+8%) | 2mo | $279,900 | $126 | 73 |
| 438 Narrow Bridge Ct | 0.17mi | 5/2.5 (+1) | 2,230 (+8%) | 2mo | $279,900 | $126 | 73 |
| 5938 Cobalt Fls Bnd | 0.02mi | 5/3.0 (+1) | 2,334 (+12%) | 7mo | $278,990 | $120 | 65 |
| 234 NW Shingle Oak Garden Gdn | 0.63mi | 4/3.0 | 1,998 (-4%) | 9mo | $289,990 | $145 | 54 |
| 9111 NW Wafer Ash Bnd | 0.64mi | 4/3.0 | 1,998 (-4%) | 11mo | $289,990 | $145 | 53 |
| 9222 Wafer Ash Bnd NW | 0.59mi | 4/2.5 | 1,889 (-9%) | 11mo | $284,900 | $151 | 48 |
| 220 NW Shingle Oak Garden Gdn | 0.62mi | 5/3.0 (+1) | 2,273 (+10%) | 1mo | $279,990 | $123 | 47 |
| 246 NW Shingle Oak Garden Gdn | 0.65mi | 4/2.0 | 1,852 (-11%) | 7mo | $274,990 | $148 | 44 |
| 9212 Wafer Ash Bnd NW | 0.60mi | 5/3.0 (+1) | 2,225 (+7%) | 13mo | $319,900 | $144 | 42 |
| 7033 Mongolian Oak Dr NW | 0.52mi | 3/2.5 (-1) | 1,823 (-12%) | 11mo | $280,000 | $154 | 41 |
| 9027 Wafer Ash Bnd NW | 0.60mi | 4/2.5 | 2,341 (+13%) | 14mo | $334,900 | $143 | 39 |
Match score weights: distance 35% · size 25% · config 20% · recency 20%. Top-matched comps best support the ARV.
Projected returns pro-forma
-3.0% appreciation · 5.06% rent growth · sell at horizon
- IRR
- -15.9%
- Equity multiple
- 0.42×
- Total profit
- $-40,276
- Equity at exit
- $37,274
- IRR
- -4.2%
- Equity multiple
- 0.70×
- Total profit
- $-21,226
- Equity at exit
- $21,615
Cash invested: $69,997 (down + closing). Projections, not guarantees.
Landlord ↔ Tenant lean methodology
- Overall (STATE)
- 90 Strongly Landlord-Friendly
- State South Carolina
- 90 Strongly Landlord-Friendly · R+6
- County
- — inherits STATE
- City
- — inherits STATE
ZIP-level market 29801
- Rents YoY
- 5.1%
- Active inventory
- 521
- Price-to-rent
- 9.8×
Monthly cashflow live
- Estimated rent
- $2,122 high interval (Pro) →
- Mortgage (P&I)
- −$1,311
- Tax est. 1.5%
- −$312 /mo · $3,750/yr
- Insurance
- −$104
- HOA
- −$16
- Vacancy / Maint / Mgmt
- −$446
- Net cashflow
- $-67
Break-even live
UW: 25.0% down · 7.5% · 30yr · 1.5% tax · 5.0% vac · 8.0% maint · 8.0% mgmt
Financing live
Cash to close
- Down payment
- $62,498
- Closing costs
- $7,500
- Reserves months
- —
- Total cash needed
- —
Loan-product check · same deal, 3 products live
Conventional
25% down · 7.5% · 30yr
- Down + closing
- —
- Monthly P&I
- —
- Monthly cashflow
- —
- DSCR
- —
- Eligible?
- —
Personal DTI + credit; lowest rate.
DSCR
20% down · 8.5% · 30yr
- Down + closing
- —
- Monthly P&I
- —
- Monthly cashflow
- —
- DSCR
- —
- Eligible?
- —
No personal income docs; deal must DSCR.
Hard money
10% down · 12.0% · 12mo
- Down + closing
- —
- Monthly P&I
- —
- Monthly cashflow
- —
- DSCR
- —
- Eligible?
- —
Short-term bridge; refi at stabilization.
Rent comps 6 comps
| Address | Beds | Baths | Sqft | Rent | $/sqft | DOM | Units | Dist |
|---|---|---|---|---|---|---|---|---|
| 844 Silent Barge Cv Aiken, SC | 4.0 | 2.5 | 1763 | $1,899 | $1.08 | 23d | 1 | 0.07mi |
| 7273 Foggy River Dr Aiken, SC | 3.0 | 2.0 | 1923 | $2,035 | $1.06 | 14d | 1 | 0.16mi |
| 7259 Foggy River Dr Aiken, SC | 4.0 | 2.0 | 2157 | $2,045 | $0.95 | 14d | 1 | 0.17mi |
| 7113 Foggy River Dr Aiken, SC | 4.0 | 2.5 | 2172 | $2,035 | $0.94 | 23d | 1 | 0.21mi |
| 7034 Foggy River Dr Aiken, SC | 5.0 | 2.0 | 2459 | $2,375 | $0.97 | 23d | 1 | 0.24mi |
| 221 Grand Oaks Way Aiken, SC | 3.0 | 2.0 | 1822 | $1,980 | $1.09 | 14d | 1 | 0.70mi |
HOA detail
- Monthly dues
- $16 · $192/yr
Listing history 13 events
-
2026-03-26status Pending
-
2026-03-26historical
-
2026-02-20status Pending
-
2026-02-20historical
-
2026-02-20historical
-
2026-02-06price $249,990
-
2026-01-06price $259,900
-
2026-01-02status Active
-
2025-12-31historical
-
2025-09-26price $264,490
-
2025-06-23price $267,790
-
2025-06-06$265,490 Active
-
2025-06-06$249,990
ⓘ Source: listings_history table (triggers on properties + properties_extension) + one-shot
backfill from property_details.listing_events for pre-trigger history.
Nearby sold comps map
Loading sold comps map…
Walkable amenities ~0.75 mi
Loading nearby amenities…
Taxation est. · year 1
- Rental income
- $25,461
- − Mortgage interest
- −$14,003
- − Property taxes
- −$3,750
- − Insurance
- −$1,250
- − Repairs & maintenance
- −$2,037
- − Management
- −$2,037
- − HOA
- −$192
- − Depreciation
- −$7,272
- Taxable loss
- −$5,081
- Est. tax savings @ 24.0%
- +$1,219
- After-tax cash flow
- $410/yr
For passive investors: Depreciation is non-cash, so a rental often shows a tax loss while cash-flowing — sheltering income. Rental losses are passive: they offset passive income freely, and up to $25,000/yr can offset ordinary (W-2) income if you actively participate and your MAGI is under $100k (phasing out to $0 by $150k); unused losses carry forward. On sale, claimed depreciation is recaptured at up to 25%, and gains may owe capital-gains tax (a 1031 exchange can defer both). Figures are a year-1 estimate at your 24.0% rate — not tax advice; consult a CPA.
Condition & rehab AI · 12 photos
This move-in-ready home is in excellent condition with modern finishes and a well-maintained exterior. Minor updates to the exterior and interior could further enhance its value for both resale and rental.
Value-add opportunities
- Both Painting exterior and interior walls — Fresh paint enhances curb appeal and interior aesthetics.
- Both Landscaping improvements — Enhances curb appeal and adds value for both resale and rental.
- Resale Kitchen appliances — Modern appliances improve the home's appeal for potential buyers.
- Resale Bathroom fixtures — Upgraded fixtures can attract more buyers and renters.
- Resale Flooring — New flooring can make the home more appealing and easier to sell or rent.
Renovation cost estimate screening
Value-add ROI direction
- Both Painting exterior and interior walls — Fresh paint enhances curb appeal and interior aesthetics. ↑
- Both Landscaping improvements — Enhances curb appeal and adds value for both resale and rental. ↑
- Resale Kitchen appliances — Modern appliances improve the home's appeal for potential buyers. ↑
- Resale Bathroom fixtures — Upgraded fixtures can attract more buyers and renters. ↑
- Resale Flooring — New flooring can make the home more appealing and easier to sell or rent. ↑
ⓘ Cost ranges are severity-bucket heuristics (US national rule-of-thumb). Get contractor quotes + a written scope before underwriting a rehab budget.
Schools (NCES district)
- District
- Aiken 01
- NCES district ID
- 4500720
- Math proficiency
- 31% ▼ -11.00%
- Reading proficiency
- 44% ▼ -1.00%
- Median HH income
- $45,081
- Composite
- 31.91/100
- National rank
- #5857
- State rank
- #36 of 80 in SC
Livability — Aiken
- Score
- 67/100
- State rank
- #93
- US rank
- #10443
Category grades
Schools grade is shown separately in the Schools card above.
Census & demographics
- County
- Aiken County · 116,534 people
- City population
- 71,807
- Metro
- Augusta-Richmond County, GA-SC
- Population (ZIP)
- 31,108
- Household income
- $59,573
- Rent vs Own
- Severe rent burden
- 1260.0
Population outlook (Aiken County) Hauer SSP2
- Today (2025)
- 178,003 people
- By 2030
- 182,876 · +2.7%
- By 2040
- 189,970 · +6.7%
- By 2050
- 193,840 · +8.9%
- By 2075
- 199,453 · +12.1%
- By 2100
- 192,403 · +8.1%
Race, ethnicity, and origin ACS 2023
- Neighborhood character
- Diverse neighborhood (Simpson 0.57)
- Race & ethnicity
- White 50% Black 42% Hispanic / Latino 5% Two or more races 4% Asian 1%
- Hispanic origin (detail)
- Mexican 1% Puerto Rican 2%
- Common ancestry
- Slovak 2% Italian 1% Serbian 1%
- Foreign-born
- 3% · Canada, Jamaica
- Languages at home
- 95% English-only · Spanish 3% Other Indo-European 1%
Political lean MEDSL · Aiken
- 2024 margin
- Strong R (+25.9) · D 36.4% · R 62.2% · Other 1.4%
- 2008→2024 swing
- -1.9pp toward R · 2008: -24.0pp · 2024: -25.9pp
- All cycles
- 2024: R+25.9 2020: R+22.7 2016: R+27.5 2012: R+26.0 2008: R+24.0
Not yet ingested
- Civics
- —
Market trends
- HPI YoY
- ▼ -278.52%
- Current HPI
- 173.7944
- Rent YoY
- ▲ 5.06%
- Metro
- Augusta-Richmond County, GA-SC
- State GDP YoY
- ▲ 4.51%
- F500 in state
- 2
Industry mix (Fortune 500 HQ in SC)
| Industry | F500 HQs | Revenue |
|---|---|---|
| Packaging | 1 | $7B |
|
||
Price history
-5.8% since first listed13 events — show timeline
- 2026-03-26 Pending — Hive MLS
- 2026-03-26 Listing Removed — Hive MLS
- 2026-02-20 Pending — Hive MLS
- 2026-02-20 Listing Removed — Hive MLS
- 2026-02-20 Listing Removed — Hive MLS
- 2026-02-06 Price Changed $249,990 Hive MLS
- 2026-01-06 Price Changed $259,900 Hive MLS
- 2026-01-02 Relisted — Hive MLS
- 2025-12-31 Listing Removed — Hive MLS
- 2025-09-26 Price Changed $264,490 AMLS
- 2025-06-23 Price Changed $267,790 AMLS
- 2025-06-06 Listed $249,990 Hive MLS
- 2025-06-06 Listed $265,490 Hive MLS
Cash-flow waterfall
monthlySold comps — $/sqft
last 12 mo · ≤1 miLoading sold comps…