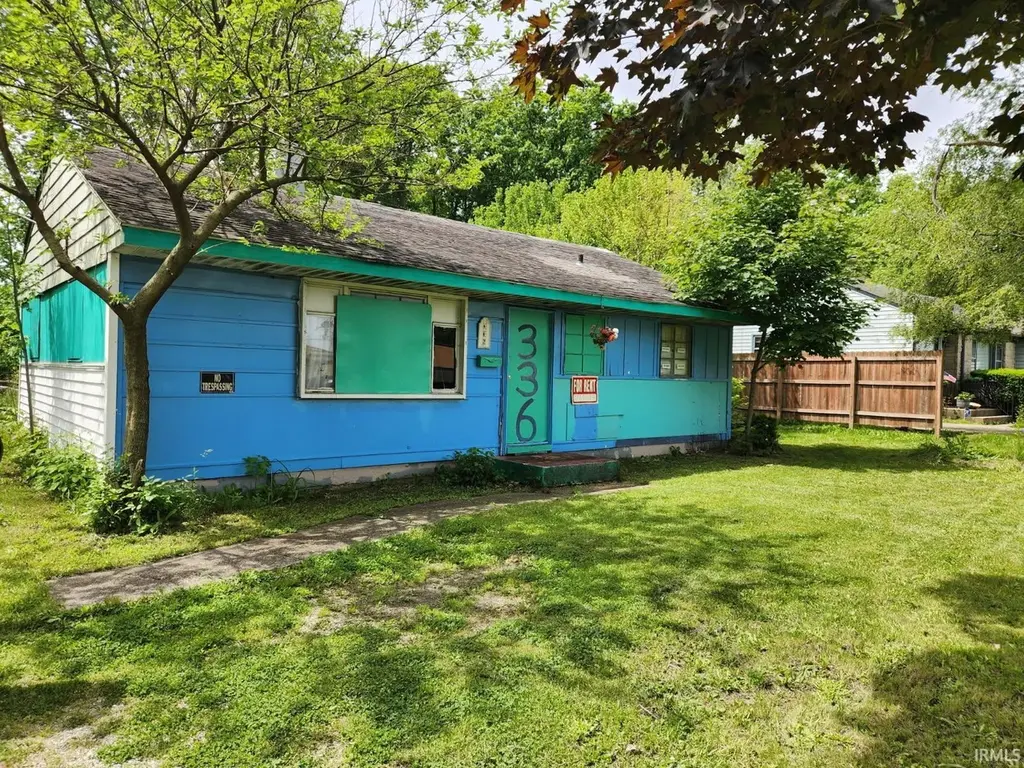
336 E Paulding Rd · Fort Wayne, IN
Flood risk 1/10 · Minimal
- FEMA flood zone
- X (unshaded)
- Chance of flooding over 30 yrs
- 0.0%
- Est. flood insurance / yr
- $507 – $1,088
Fire risk 1/10 · Minimal
- Est. fire insurance / yr
- $717 – $1,331
Heat risk 3/10 · Minor
- Hot days now (above 100°F)
- 7 days/yr
- Hot days in 30 yrs
- 17 days/yr
Wind risk 2/10 · Minimal
- Chance of severe wind over 30 yrs
- —
Air-quality risk 3/10 · Minor
- Unhealthy air days now
- 2 days/yr
- Unhealthy air days in 30 yrs
- 3 days/yr
Risk factors via First Street. Map © Google.
Why this score? — see what drove the C+ grade
The composite is a weighted blend of 9 inputs, each scored 0–100. Each bar is that input's sub-score; the figure is the points it added to the 100-point composite (weight × sub-score).
- Cash flow +22.8/30.0
- ARV discount +15.0/15.0
- DSCR +7.3/10.0
- 1% rule +5.7/10.0
- Livability +4.2/5.0
- Rent growth +2.5/5.0
- Condition / age +2.5/5.0
- Schools +2.2/10.0
- Appreciation +0.0/10.0
$108,000
🖨 Deal sheet (PDF) 📄 Offer letter ✓ Due diligence
Listing remarks
THIS HOME HAS LOTS OF POTENTIAL. IT HAS 3 BEDROOMS, 1 BATH AND TOTAL ELECTRIC.
Key facts
- 0.24 acre lot
- Built 1965
- Listed 26 days
Property features AI
Exterior
- Parking: Driveway
- Utilities: Public water; Public sewer; Electric service
- Home design: Single-family residence; Site-built home; One story
- Construction: Aluminum, vinyl, and wood siding; Slab foundation; Built as site-built construction
- Exterior features: Level lot; Lot dimensions approximately 76 x 141
Interior
- Kitchen: Includes refrigerator and electric range
- Bedrooms: Total of 5 rooms (bedrooms not individually specified)
- Bathrooms: 1 full bathroom (main level)
- Heating & cooling: Electric heating; No cooling
- Interior features: Refrigerator; Electric range; Electric water heater
- Laundry & utility: Laundry on the main level
Neighborhood map
What this means for you Summary
Snapshot
- This is a 3-bed/1.0-bath single-family listed at $108k.
Deal economics
- At list price, monthly cash flow is $188 ($2k/yr) — positive.
- The deal already cash-flows at list — no discount required.
- Meets the 1% rule at list price ($1k rent vs $108k).
- Recommended offer: $106k (1.5% below list) — sets the bar for market timing.
- Cap rate 8.4% vs local median 4.8% in Fort Wayne — top-decile yield for the area; either an underpriced asset or a hidden risk that comps aren't pricing in. Stress-test before assuming the spread holds.
Location & tenants
- Location reads 84/100 on livability (#6 in IN, #676 nationally) — a professional / high-income tenant draw. Strengths: amenities A+, commute A+, cost of living A+; Watch: crime C-, employment D+.
- Fort Wayne Community Schools (urban): math 22% / reading 29% proficiency, ranked #263 of 301 in IN (top 87%) — low school quality limits family demand, transient renter base, plan for 1-2y turnover; 60% free/reduced lunch — lower-income household profile, screen leases tightly.
- Zoned schools: Harrison Hill Elementary School (math 21% / reading 18%, grade F, #814 of 994 statewide, top 83%, 618 students, 76% FRL); Kekionga Middle School (math 10% / reading 17%, grade F, #303 of 330 statewide, top 92%, 538 students, 80% FRL); South Side High School (math 12% / reading 39%, grade F, #322 of 369 statewide, top 87%, 1,423 students, 73% FRL) — zoned schools average 77% FRL vs 60% district-wide (16 pts higher); higher-poverty schools than district average — tighter screening recommended.
- Market conditions: 50 active listings in the ZIP; 18 comparable units currently listed for rent nearby; rentals at typical pace (median 23d on market — plan ~3-4 weeks tenant-placement turnaround); 1,861 units permitted in Allen County in 2024 (576 in 5+ unit buildings).
- This rent runs 31% of the median local income ($45k/yr) — at the standard rent-burdened threshold; future hikes will face affordability resistance.
Forward outlook
- Local home prices are declining (-3.0%/yr); year-one equity from $747 of loan paydown is wiped out by about $3k of value loss. Plan a longer hold.
- Allen County population projected at +10% by 2050 — modest demand growth; plan on rents tracking national, not racing it.
Negotiation context
- It's been on market 26 days — a 2% lower offer ($106k) is reasonable based on typical stale-listing flexibility.
- 10 sale attempts since 9y ago with the ask held roughly flat each time — persistent listings suggest the price (not the market) is what's stuck; bring a comps-based counter.
Questions for the listing agent
- Built in 1965 — when were the roof, HVAC, electrical panel, plumbing, and water heater last replaced?
- Is there a deadline driving the sale (1031 exchange, divorce, estate, relocation)? That informs how much negotiation room exists.
- Schools are D-rated, which usually means shorter tenancies and higher turnover. Who's the typical renter profile here, and what's been the actual vacancy rate?
- What's the average days-on-market for RENTAL listings here right now (not sales)? A rising rental-DOM trend means longer vacancies and softer asking-rent achievability than the comps imply.
- What's the recent tenant-quality profile in this submarket — average credit score on applications, eviction rate, late-payment / NSF rate, and stable-employment percentage? A property-management company in the area should have these aggregated.
- How much new for-sale + rental construction is in the pipeline within 1–3 miles? Heavy new supply typically softens prices + rents 12–24 months out; constrained supply supports both.
Investment metrics
- 1% rule
- 1.07% ✓
- Cap rate
- 8.38%
- Cash-on-cash
- 7.44%
- DSCR
- 1.33
- GRM
- 7.8
CMA / ARV
- ARV (on-the-fly)
- $150,480
- Comps found
- 12
Show comp detail 12 sales within ~0.75 mi
| Address | Dist | Beds/Ba | Sqft | Sold | Price | $/sf | Match |
|---|---|---|---|---|---|---|---|
| 6031 S Calhoun St | 0.22mi | 3/1.0 | 925 (+1%) | 0mo | $164,000 | $177 | 87 |
| 6034 Southcrest Rd | 0.22mi | 3/1.0 | 888 (-3%) | 4mo | $155,000 | $175 | 82 |
| 125 E Crown Ln | 0.28mi | 3/1.0 | 900 (-1%) | 6mo | $130,000 | $144 | 80 |
| 225 Dunbar Ln | 0.43mi | 3/1.0 | 925 (+1%) | 3mo | $153,000 | $165 | 75 |
| 5232 Webster St | 0.42mi | 3/1.0 | 900 (-1%) | 5mo | $144,900 | $161 | 74 |
| 5409 Webster St | 0.36mi | 2/1.0 (-1) | 947 (+4%) | 2mo | $90,000 | $95 | 70 |
| 6420 Downingtown Dr | 0.51mi | 3/1.0 | 962 (+6%) | 5mo | $100,000 | $104 | 63 |
| 411 W Paulding Rd | 0.40mi | 2/1.0 (-1) | 784 (-14%) | 3mo | $140,000 | $179 | 50 |
| 4844 South Harrison St | 0.58mi | 3/1.0 | 792 (-13%) | 2mo | $135,000 | $170 | 49 |
| 4642 Warsaw St | 0.72mi | 3/1.0 | 1,000 (+10%) | 2mo | $142,000 | $142 | 48 |
| 123 Edgeknoll Ln | 0.54mi | 3/2.0 | 1,008 (+10%) | 6mo | $180,000 | $179 | 48 |
| 4915 Gaywood Dr | 0.75mi | 3/1.0 | 1,025 (+12%) | 2mo | $140,000 | $137 | 43 |
Match score weights: distance 35% · size 25% · config 20% · recency 20%. Top-matched comps best support the ARV.
Projected returns pro-forma
-3.0% appreciation · 3.0% rent growth · sell at horizon
- IRR
- -4.9%
- Equity multiple
- 0.82×
- Total profit
- $-5,551
- Equity at exit
- $16,103
- IRR
- 4.8%
- Equity multiple
- 1.35×
- Total profit
- $10,570
- Equity at exit
- $9,338
Cash invested: $30,240 (down + closing). Projections, not guarantees.
Landlord ↔ Tenant lean methodology
- Overall (STATE)
- 90 Strongly Landlord-Friendly
- State Indiana
- 90 Strongly Landlord-Friendly · R+11
- County
- — inherits STATE
- City
- — inherits STATE
ZIP-level market 46816
- Home prices YoY
- -27.9%
- Active inventory
- 50
- Price-to-rent
- 7.8×
Monthly cashflow live
- Estimated rent
- $1,159 high interval (Pro) →
- Mortgage (P&I)
- −$566
- Tax from tax record
- −$117 /mo · $1,401/yr
- Insurance
- −$45
- HOA
- −$0
- Vacancy / Maint / Mgmt
- −$243
- Net cashflow
- $188
Break-even live
Sensitivity live
| Price | -10% $249 | -5% $218 | +0% $188 | +5% $157 | +10% $126 |
|---|---|---|---|---|---|
| Rent | -10% $96 | -5% $142 | +0% $188 | +5% $233 | +10% $279 |
| Rate | -1.0pp $242 | -0.5pp $215 | base $188 | +0.5pp $160 | +1.0pp $131 |
UW: 25.0% down · 7.5% · 30yr · 1.5% tax · 5.0% vac · 8.0% maint · 8.0% mgmt
Financing live
Cash to close
- Down payment
- $27,000
- Closing costs
- $3,240
- Reserves months
- —
- Total cash needed
- —
Loan-product check · same deal, 3 products live
Conventional
25% down · 7.5% · 30yr
- Down + closing
- —
- Monthly P&I
- —
- Monthly cashflow
- —
- DSCR
- —
- Eligible?
- —
Personal DTI + credit; lowest rate.
DSCR
20% down · 8.5% · 30yr
- Down + closing
- —
- Monthly P&I
- —
- Monthly cashflow
- —
- DSCR
- —
- Eligible?
- —
No personal income docs; deal must DSCR.
Hard money
10% down · 12.0% · 12mo
- Down + closing
- —
- Monthly P&I
- —
- Monthly cashflow
- —
- DSCR
- —
- Eligible?
- —
Short-term bridge; refi at stabilization.
Rent comps 18 comps
| Address | Beds | Baths | Sqft | Rent | $/sqft | DOM | Units | Dist |
|---|---|---|---|---|---|---|---|---|
| 6033 S Calhoun St Fort Wayne, IN | 3.0 | 1.0 | 1042 | $1,220 | $1.17 | 22d | 1 | 0.22mi |
| 308 Pursley Dr Fort Wayne, IN | 3.0 | 1.0 | 850 | $1,100 | $1.29 | 45d | 1 | 0.36mi |
| 405 Pursley Dr Fort Wayne, IN | 2.0 | 1.0 | 720 | $850 | $1.18 | 45d | 1 | 0.48mi |
| 5009 Hoagland Ave Fort Wayne, IN | 2.0 | 1.0 | 1000 | $1,300 | $1.30 | 45d | 1 | 0.61mi |
| 6440 Fairfield Ave Fort Wayne, IN | 1.0–2.0 | 1.0–1.5 | 928 | $1,344 | $1.45 | 15d | 10 | 0.61mi |
| 1004 Fayette Dr Fort Wayne, IN | 1.0–2.0 | 1.0 | 679 | $1,199 | $1.76 | 15d | 18 | 0.62mi |
| 4655 Avondale Dr Fort Wayne, IN | 2.0 | 1.0 | 768 | $875 | $1.14 | 45d | 1 | 0.72mi |
| 220 E Hoover Dr Fort Wayne, IN | 2.0–3.0 | 1.5 | 1150 | $1,259 | $1.09 | 15d | 5 | 0.74mi |
| 4522 Spatz Ave Fort Wayne, IN | 2.0 | 1.0 | 840 | $950 | $1.13 | 45d | 1 | 0.97mi |
| 4331 Lafayette St Fort Wayne, IN | 2.0 | 1.0 | 810 | $925 | $1.14 | 15d | 1 | 0.98mi |
| 4126 Lafayette St Fort Wayne, IN | 2.0 | 1.0 | 775 | $1,275 | $1.65 | 45d | 1 | 1.13mi |
| 4121 Monroe St Fort Wayne, IN | 2.0 | 1.0 | 725 | $1,100 | $1.52 | 15d | 1 | 1.15mi |
| 4018 S Clinton St Fort Wayne, IN | 3.0 | 1.0 | 860 | $1,000 | $1.16 | 22d | 1 | 1.22mi |
| 4705 S Anthony Blvd Fort Wayne, IN | 3.0 | 1.0 | 1110 | $1,050 | $0.95 | 15d | 1 | 1.30mi |
| 4129 Bowser Ave Fort Wayne, IN | 3.0 | 1.5 | 850 | $1,250 | $1.47 | 22d | 1 | 1.32mi |
| 3801 Lafayette St Fort Wayne, IN | 2.0 | 1.0 | 1116 | $995 | $0.89 | 15d | 1 | 1.36mi |
| 4014 Oliver St Fort Wayne, IN | 3.0 | 1.0 | 936 | $1,050 | $1.12 | 15d | 1 | 1.36mi |
| 418 W Rudisill Blvd Unit 2 Fort Wayne, IN | 2.0 | 1.0 | 768 | $975 | $1.27 | 22d | 1 | 1.43mi |
Listing history 25 events
-
2026-06-22days on market $108,000 Active 26 DOM
-
2026-06-18days on market $108,000 Active 23 DOM
-
2026-06-17days on market $108,000 Active 22 DOM
-
2026-06-16days on market $108,000 Active 21 DOM
-
2026-06-15days on market $108,000 Active 20 DOM
-
2026-06-14days on market $108,000 Active 18 DOM
-
2026-06-10days on market $108,000 Active 15 DOM
-
2026-06-09days on market $108,000 Active 14 DOM
-
2026-06-08days on market $108,000 Active 13 DOM
-
2026-06-07days on market $108,000 Active 12 DOM
-
2026-06-03days on market $108,000 Active 8 DOM
-
2026-06-02days on market $108,000 Active 7 DOM
-
2026-06-01days on market $108,000 Active 6 DOM
-
2026-05-31days on market $108,000 Active 5 DOM
-
2026-05-30days on market $108,000 Active 4 DOM
-
2026-05-27$108,000 Active
-
2022-07-03$89,900 Active
-
2022-05-05$89,900
-
2021-06-13$59,900
-
2021-05-07$59,900
-
2021-03-08$59,900
-
2021-02-26$59,900
-
2020-09-24$59,900
-
2019-05-09$39,900
-
2017-05-30$41,900
ⓘ Source: listings_history table (triggers on properties + properties_extension) + one-shot
backfill from property_details.listing_events for pre-trigger history.
Tax reassessment forecast IN · Partial reset (capped growth)
- Current annual tax
- $1,401 · $117/mo
- Projected year-2 tax
- $1,401 · $117/mo
- Expected delta
- $0/yr ($0/mo · 0.0%)
ⓘ Screening estimate from a state-policy table — verify with the county assessor before closing.
Climate risk First Street
- Flood 1/10 Low FEMA zone X (unshaded) · 0% chance over 30 yrs
- Wildfire 1/10 Low
- Heat 3/10 Moderate 7 d/yr ≥100°F today · 17 d/yr by 30 yrs out
- Wind 2/10 Low
- Air quality 3/10 Moderate 2 unhealthy d/yr today · 3 by 30 yrs out
Nearby sold comps map
Loading sold comps map…
Walkable amenities ~0.75 mi
Loading nearby amenities…
Taxation est. · year 1
- Rental income
- $13,909
- − Mortgage interest
- −$6,050
- − Property taxes
- −$1,401
- − Insurance
- −$540
- − Repairs & maintenance
- −$1,113
- − Management
- −$1,113
- − Depreciation
- −$3,142
- Taxable income
- $550
- Est. tax owed @ 24.0%
- −$132
- After-tax cash flow
- $2,118/yr
For passive investors: Depreciation is non-cash, so a rental often shows a tax loss while cash-flowing — sheltering income. Rental losses are passive: they offset passive income freely, and up to $25,000/yr can offset ordinary (W-2) income if you actively participate and your MAGI is under $100k (phasing out to $0 by $150k); unused losses carry forward. On sale, claimed depreciation is recaptured at up to 25%, and gains may owe capital-gains tax (a 1031 exchange can defer both). Figures are a year-1 estimate at your 24.0% rate — not tax advice; consult a CPA.
Schools (NCES district)
- District
- Fort Wayne Community Schools
- NCES district ID
- 1803630
- Math proficiency
- 22% ▼ -11.00%
- Reading proficiency
- 29% ▼ -7.00%
- Median HH income
- $41,951
- Composite
- 21.68/100
- National rank
- #8275
- State rank
- #263 of 301 in IN
Livability — Fort Wayne
- Score
- 84/100
- State rank
- #6
- US rank
- #676
Category grades
Schools grade is shown separately in the Schools card above.
Census & demographics
- Census place
- Fort Wayne, IN
- County
- Allen County · 326,813 people
- City population
- 326,813
- Metro
- Fort Wayne, IN
- Population (ZIP)
- 19,514
- Household income
- $45,343
- Rent vs Own
- Severe rent burden
- 921.0
Population outlook (Allen County) Hauer SSP2
- Today (2025)
- 394,020 people
- By 2030
- 405,128 · +2.8%
- By 2040
- 423,476 · +7.5%
- By 2050
- 435,137 · +10.4%
- By 2075
- 450,293 · +14.3%
- By 2100
- 424,101 · +7.6%
Race, ethnicity, and origin ACS 2023
- Neighborhood character
- Highly diverse neighborhood (Simpson 0.74)
- Race & ethnicity
- White 34% Black 30% Asian 20% Hispanic / Latino 11% Two or more races 8%
- Hispanic origin (detail)
- Mexican 9%
- Common ancestry
- Portuguese 2% Italian 2% Romanian 1%
- Foreign-born
- 21% · Philippines, Canada, China
- Languages at home
- 73% English-only · Other Asian/Pacific 16% Spanish 10%
Political lean MEDSL · Allen
- 2024 margin
- R (+12.5) · D 42.9% · R 55.4% · Other 1.7%
- 2008→2024 swing
- -8.1pp toward R · 2008: -4.3pp · 2024: -12.5pp
- All cycles
- 2024: R+12.5 2020: R+11.2 2016: R+19.6 2012: R+16.8 2008: R+4.3
Not yet ingested
- Civics
- —
Market trends
- HPI YoY
- ▼ -108.64%
- Current HPI
- 279.9884
- Rent YoY
- —
- Metro
- Fort Wayne, IN
- State GDP YoY
- ▲ 2.90%
- F500 in state
- 18
Industry mix (Fortune 500 HQ in IN)
| Industry | F500 HQs | Revenue |
|---|---|---|
| Industrial Machinery | 2 | $37B |
|
||
| Healthcare | 1 | $177B |
|
||
| Pharmaceuticals | 1 | $45B |
|
||
| Metals / Steel | 1 | $18B |
|
||
| Agriculture | 1 | $17B |
|
||
| Packaging | 1 | $12B |
|
||
Price history
+157.8% since first listed10 events — show timeline
- 2026-05-27 Listed $108,000 IRMLS
- 2022-07-03 Listed $89,900 IRMLS
- 2022-05-05 Listed $89,900 IRMLS
- 2021-06-13 Listed $59,900 IRMLS
- 2021-05-07 Listed $59,900 IRMLS
- 2021-03-08 Listed $59,900 IRMLS
- 2021-02-26 Listed $59,900 IRMLS
- 2020-09-24 Listed $59,900 IRMLS
- 2019-05-09 Listed $39,900 IRMLS
- 2017-05-30 Listed $41,900 IRMLS
Property tax history
+4.4%/yrLatest (2024): $1,401 · -19.9% YoY. Source: county tax records.
Cash-flow waterfall
monthlySold comps — $/sqft
last 12 mo · ≤1 miLoading sold comps…