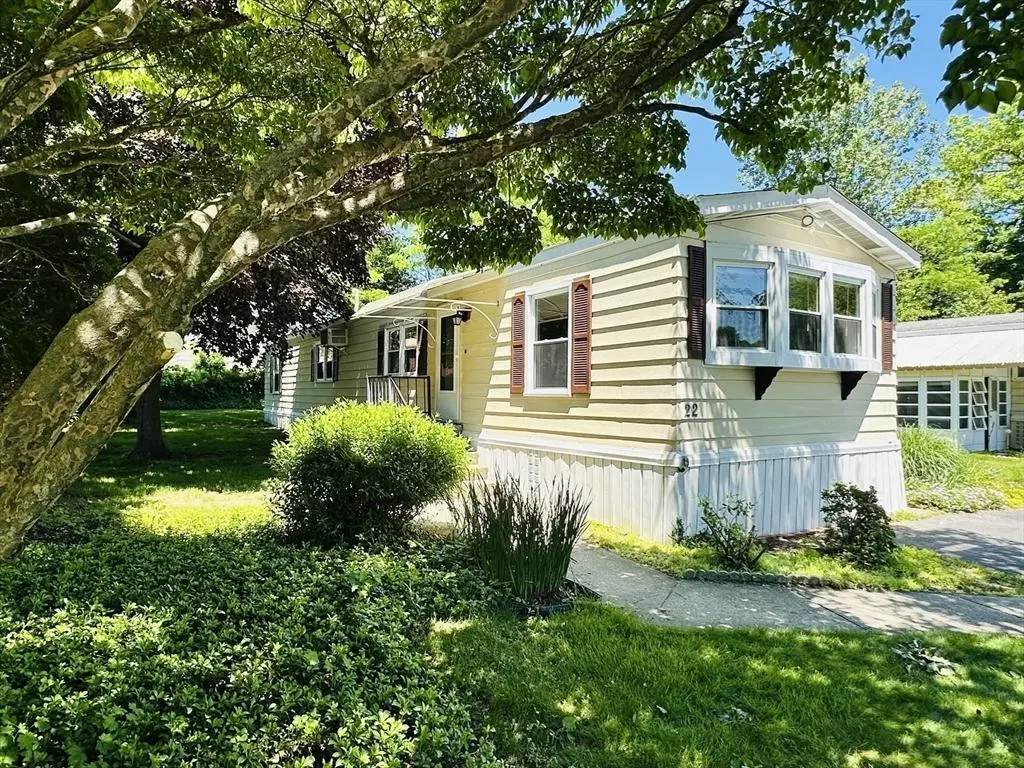
22 Contessa Dr · Springfield, MA
Flood risk 1/10 · Minimal
- FEMA flood zone
- X (unshaded)
- Chance of flooding over 30 yrs
- 0.0%
- Est. flood insurance / yr
- $507 – $1,088
Fire risk 3/10 · Minor
- Est. fire insurance / yr
- $915 – $1,699
Heat risk 4/10 · Minor
- Hot days now (above 97°F)
- 7 days/yr
- Hot days in 30 yrs
- 16 days/yr
Wind risk 5/10 · Moderate
- Chance of severe wind over 30 yrs
- 25.0%
Air-quality risk 2/10 · Minimal
- Unhealthy air days now
- 1 days/yr
- Unhealthy air days in 30 yrs
- 2 days/yr
Risk factors via First Street. Map © Google.
Why this score? — see what drove the C- grade
The composite is a weighted blend of 9 inputs, each scored 0–100. Each bar is that input's sub-score; the figure is the points it added to the 100-point composite (weight × sub-score).
- Cash flow +24.9/30.0
- 1% rule +10.0/10.0
- DSCR +8.1/10.0
- Condition / age +3.8/5.0
- Livability +3.7/5.0
- Rent growth +2.5/5.0
- Schools +1.6/10.0
- ARV discount +0.0/15.0
- Appreciation +0.0/10.0
$134,900
🖨 Deal sheet (PDF) 📄 Offer letter ✓ Due diligence
Listing remarks
Welcome to Eastwood Estates, a 55+ community nestled inside a residential neighborhood! This well cared for home sits on a tranquil lot with established trees and flower gardens providing a private outdoor area. The interior is perfectly laid out with the main bedroom located at the back of the home for privacy and the full bath just steps away. The kitchen, dining area, and living room are at the center of it all with the 2nd bedroom for guests at the front, offering its own 1/2 bath. Several light fixtures have been updated and new luxury vinyl plank flooring was installed in the freshly painted kitchen. Both baths were refreshed with new coats of paint as well, so all you need to do is m
Key facts
- Main bedroom
- Tranquil lot
- 2nd bedroom
Tags
Property features AI
Finance
- HOA & community: Community association with monthly fee (association present); Community features include public transportation, shopping, park access, walk/jog trails and bike path; Senior community
Exterior
- Parking: Off-street paved parking; 2 open parking spaces
- Utilities: Public water; Public sewer; Electric for range; Washer hookup; Electric and gas dryer hookups
- Home design: Mobile home; Tan exterior color; Shingle roof; Approximately built (builder source)
- Construction: Block foundation
- Exterior features: Wood deck; Storage; Garden; Level lot; Paved public road frontage (publicly maintained)
Interior
- Kitchen: Vinyl flooring; Dining area; Exterior access to wood deck; Overhead lighting; Range; Refrigerator; Range hood
- Bedrooms: Main-level primary bedroom with ceiling fan, closet, vinyl flooring and overhead lighting; Main-level second bedroom with closet, vinyl flooring, half-bath access and overhead lighting
- Flooring: Vinyl flooring throughout
- Bathrooms: One full bathroom with shower stall, vinyl flooring and sconce/overhead lighting; One half bathroom with overhead lighting
- Heating & cooling: Central forced-air heating (natural gas); Wall cooling unit(s)
- Interior features: Insulated windows; Custom built closet/cabinets in living room; Exterior access from living room and kitchen; Total of 4 rooms
- Laundry & utility: Washer hookup (first floor); Electric and gas dryer hookups (first floor)
Neighborhood map
What this means for you Summary
Snapshot
- This is a 2-bed/1.5-bath manufactured listed at $135k. Condition is rated good.
Deal economics
- At list price, monthly cash flow is $291 ($3k/yr) — positive.
- The deal already cash-flows at list — no discount required.
- Meets the 1% rule at list price ($2k rent vs $135k).
- Recommended offer: $133k (1.5% below list) — sets the bar for market timing.
- Cap rate 8.9% vs local median 5.0% in Springfield — top-decile yield for the area; either an underpriced asset or a hidden risk that comps aren't pricing in. Stress-test before assuming the spread holds.
Location & tenants
- Location reads 73/100 on livability (#97 in MA) — a middle-class / working-renter tenant base. Strengths: commute A+, health & safety A+, amenities A; Watch: crime F, employment D-.
- Springfield (urban): math 13% / reading 25% proficiency, ranked #296 of 302 in MA (top 98%) — low school quality limits family demand, transient renter base, plan for 1-2y turnover; 81% free/reduced lunch — lower-income household profile, screen leases tightly.
- Zoned schools: Springfield Public Day Elementary School (math 10% / reading 10%, grade F, #909 of 938 statewide, top 97%, 32 students, 0% FRL); Springfield Public Day Middle School (math 5% / reading 5%, grade F, #302 of 305 statewide, top 99%, 51 students, 0% FRL); Springfield Public Day High School (math 24% / reading 24%, grade F, #287 of 343 statewide, top 87%, 61 students, 0% FRL) — zoned schools average 0% FRL vs 81% district-wide (81 pts lower); this property's tenant base skews higher-income than the district average.
- Market conditions: 16 active listings in the ZIP; 5 comparable units currently listed for rent nearby; rentals lingering (median 46d on market — plan ~5-8 weeks vacancy on turnover, expect pricing pressure); 60% of comp listings sitting > 30 days — soft ceiling on asking rent; 453 units permitted in Hampden County in 2024 (116 in 5+ unit buildings).
Forward outlook
- Local home prices are declining (-3.0%/yr); year-one equity from $933 of loan paydown is wiped out by about $4k of value loss. Plan a longer hold.
- Hampden County population projected at +5% by 2050 — modest demand growth; plan on rents tracking national, not racing it.
Negotiation context
- It's been on market 18 days — a 2% lower offer ($133k) is reasonable based on typical stale-listing flexibility.
Risks & watch-outs
- Climate carrying-cost: moderate wind risk, 25% chance of damaging wind over 30y — expect insurance premiums to compound above CPI over the hold.
Questions for the listing agent
- Built in 1979 — when were the roof, HVAC, electrical panel, plumbing, and water heater last replaced?
- What does the HOA fee cover, when was the last increase, and are there any pending special assessments or reserve-fund shortfalls?
- Is there a deadline driving the sale (1031 exchange, divorce, estate, relocation)? That informs how much negotiation room exists.
- Schools are D-rated, which usually means shorter tenancies and higher turnover. Who's the typical renter profile here, and what's been the actual vacancy rate?
- Crime grade is F in this area — have there been break-ins, vandalism, or insurance claims at this property in the last 3 years? What carrier currently insures it and at what premium?
- What's the average days-on-market for RENTAL listings here right now (not sales)? A rising rental-DOM trend means longer vacancies and softer asking-rent achievability than the comps imply.
- What's the recent tenant-quality profile in this submarket — average credit score on applications, eviction rate, late-payment / NSF rate, and stable-employment percentage? A property-management company in the area should have these aggregated.
- How much new for-sale + rental construction is in the pipeline within 1–3 miles? Heavy new supply typically softens prices + rents 12–24 months out; constrained supply supports both.
Investment metrics
- 1% rule
- 1.50% ✓
- Cap rate
- 8.88%
- Cash-on-cash
- 9.25%
- DSCR
- 1.41
- GRM
- 5.5
CMA / ARV
- ARV (on-the-fly)
- $104,060
- Comps found
- 3
Show comp detail 3 sales within ~0.75 mi
| Address | Dist | Beds/Ba | Sqft | Sold | Price | $/sf | Match |
|---|---|---|---|---|---|---|---|
| 70 Shumway Unit B12 | 0.09mi | 2/1.0 | 870 (+1%) | 8mo | $105,000 | $121 | 85 |
| 70 Shumway St Unit A3 | 0.09mi | 2/1.0 | 916 (+6%) | 1mo | $130,000 | $142 | 82 |
| 26 Elm Shade Way | 0.30mi | 2/1.0 | 886 (+3%) | 10mo | $85,000 | $96 | 71 |
Match score weights: distance 35% · size 25% · config 20% · recency 20%. Top-matched comps best support the ARV.
Projected returns pro-forma
-3.0% appreciation · 3.0% rent growth · sell at horizon
- IRR
- -2.1%
- Equity multiple
- 0.92×
- Total profit
- $-3,059
- Equity at exit
- $20,114
- IRR
- 7.7%
- Equity multiple
- 1.59×
- Total profit
- $22,277
- Equity at exit
- $11,664
Cash invested: $37,772 (down + closing). Projections, not guarantees.
Landlord ↔ Tenant lean methodology
- Overall (STATE)
- 20 Strongly Tenant-Friendly
- State Massachusetts
- 20 Strongly Tenant-Friendly · D+15
- County
- — inherits STATE
- City
- — inherits STATE
ZIP-level market 01119
- Home prices YoY
- -30.7%
- Active inventory
- 16
- Price-to-rent
- 5.5×
Monthly cashflow live
- Estimated rent
- $2,029 high interval (Pro) →
- Mortgage (P&I)
- −$707
- Tax est. 1.5%
- −$169 /mo · $2,024/yr
- Insurance
- −$56
- HOA
- −$380
- Vacancy / Maint / Mgmt
- −$426
- Net cashflow
- $291
Break-even live
Sensitivity live
| Price | -10% $384 | -5% $338 | +0% $291 | +5% $244 | +10% $198 |
|---|---|---|---|---|---|
| Rent | -10% $131 | -5% $211 | +0% $291 | +5% $371 | +10% $451 |
| Rate | -1.0pp $359 | -0.5pp $325 | base $291 | +0.5pp $256 | +1.0pp $221 |
UW: 25.0% down · 7.5% · 30yr · 1.5% tax · 5.0% vac · 8.0% maint · 8.0% mgmt
Financing live
Cash to close
- Down payment
- $33,725
- Closing costs
- $4,047
- Reserves months
- —
- Total cash needed
- —
Loan-product check · same deal, 3 products live
Conventional
25% down · 7.5% · 30yr
- Down + closing
- —
- Monthly P&I
- —
- Monthly cashflow
- —
- DSCR
- —
- Eligible?
- —
Personal DTI + credit; lowest rate.
DSCR
20% down · 8.5% · 30yr
- Down + closing
- —
- Monthly P&I
- —
- Monthly cashflow
- —
- DSCR
- —
- Eligible?
- —
No personal income docs; deal must DSCR.
Hard money
10% down · 12.0% · 12mo
- Down + closing
- —
- Monthly P&I
- —
- Monthly cashflow
- —
- DSCR
- —
- Eligible?
- —
Short-term bridge; refi at stabilization.
Rent comps 5 comps
| Address | Beds | Baths | Sqft | Rent | $/sqft | DOM | Units | Dist |
|---|---|---|---|---|---|---|---|---|
| 65 Wisteria St Springfield, MA | 2.0 | 1.5 | 972 | $2,100 | $2.16 | 45d | 1 | 0.21mi |
| 149 Darling St Springfield, MA | 2.0 | 1.0 | 900 | $2,100 | $2.33 | 15d | 1 | 1.13mi |
| 19-21 Daniel St Unit 19 Springfield, MA | 3.0 | 1.0 | 1050 | $2,000 | $1.90 | 45d | 1 | 1.34mi |
| 183 Boston Rd Springfield, MA | 2.0 | 1.0 | 740 | $1,595 | $2.16 | 26d | 1 | 1.42mi |
| 13 Decatur St Unit 13 Indian Orchard, MA | 2.0 | 1.0 | 900 | $1,900 | $2.11 | 45d | 1 | 1.50mi |
HOA detail
- Monthly dues
- $380 · $4,560/yr
Listing history 13 events
-
2026-06-22days on market $134,900 Active 18 DOM
-
2026-06-18days on market $134,900 Active 15 DOM
-
2026-06-17days on market $134,900 Active 14 DOM
-
2026-06-16days on market $134,900 Active 13 DOM
-
2026-06-15days on market $134,900 Active 12 DOM
-
2026-06-14days on market $134,900 Active 10 DOM
-
2026-06-13days on market $134,900 Active 9 DOM
-
2026-06-10days on market $134,900 Active 7 DOM
-
2026-06-09days on market $134,900 Active 6 DOM
-
2026-06-08days on market $134,900 Active 5 DOM
-
2026-06-07statusdays on market $134,900 Active 4 DOM
-
2026-06-05remarks 699-char remark
-
2026-06-05$134,900 New 1 DOM
ⓘ Source: listings_history table (triggers on properties + properties_extension) + one-shot
backfill from property_details.listing_events for pre-trigger history.
Climate risk First Street
- Flood 1/10 Low FEMA zone X (unshaded) · 0% chance over 30 yrs
- Wildfire 3/10 Moderate
- Heat 4/10 Moderate 7 d/yr ≥97°F today · 16 d/yr by 30 yrs out
- Wind 5/10 Major 25% chance of damaging wind over 30 yrs
- Air quality 2/10 Low 1 unhealthy d/yr today · 2 by 30 yrs out
Nearby sold comps map
Loading sold comps map…
Walkable amenities ~0.75 mi
Loading nearby amenities…
Taxation est. · year 1
- Rental income
- $24,354
- − Mortgage interest
- −$7,556
- − Property taxes
- −$2,024
- − Insurance
- −$674
- − Repairs & maintenance
- −$1,948
- − Management
- −$1,948
- − HOA
- −$4,560
- − Depreciation
- −$3,924
- Taxable income
- $1,718
- Est. tax owed @ 24.0%
- −$412
- After-tax cash flow
- $3,080/yr
For passive investors: Depreciation is non-cash, so a rental often shows a tax loss while cash-flowing — sheltering income. Rental losses are passive: they offset passive income freely, and up to $25,000/yr can offset ordinary (W-2) income if you actively participate and your MAGI is under $100k (phasing out to $0 by $150k); unused losses carry forward. On sale, claimed depreciation is recaptured at up to 25%, and gains may owe capital-gains tax (a 1031 exchange can defer both). Figures are a year-1 estimate at your 24.0% rate — not tax advice; consult a CPA.
Condition & rehab AI · 13 photos
This well-maintained mobile home in Eastwood Estates is move-in ready with fresh paint and new flooring, making it an attractive option for both buyers and renters.
Value-add opportunities
- Resale Painting the exterior siding — Fresh paint can enhance curb appeal and property value.
- Resale Upgrading the kitchen appliances — Modern appliances can attract more buyers and increase the home's value.
- Both Landscaping improvements — Enhanced landscaping can improve curb appeal and attract more renters.
Renovation cost estimate screening
Value-add ROI direction
- Resale Painting the exterior siding — Fresh paint can enhance curb appeal and property value. ↑
- Resale Upgrading the kitchen appliances — Modern appliances can attract more buyers and increase the home's value. ↑
- Both Landscaping improvements — Enhanced landscaping can improve curb appeal and attract more renters. ↑
ⓘ Cost ranges are severity-bucket heuristics (US national rule-of-thumb). Get contractor quotes + a written scope before underwriting a rehab budget.
Schools (NCES district)
- District
- Springfield
- NCES district ID
- 2511130
- Math proficiency
- 13% ▼ -12.00%
- Reading proficiency
- 25% ▼ -5.00%
- Median HH income
- $34,938
- Composite
- 15.6/100
- National rank
- #9293
- State rank
- #296 of 302 in MA
Livability — Springfield
- Score
- 73/100
- State rank
- #97
- US rank
- #5195
Category grades
Schools grade is shown separately in the Schools card above.
Census & demographics
- Census place
- Springfield, MA
- City population
- 61,006
- Population (ZIP)
- 14,059
Population outlook (Hampden County) Hauer SSP2
- Today (2025)
- 485,646 people
- By 2030
- 491,517 · +1.2%
- By 2040
- 500,539 · +3.1%
- By 2050
- 508,827 · +4.8%
- By 2075
- 539,167 · +11.0%
- By 2100
- 545,698 · +12.4%
Race, ethnicity, and origin ACS 2023
- Neighborhood character
- Diverse neighborhood (Simpson 0.68)
- Race & ethnicity
- White 41% Hispanic / Latino 33% Black 20% Two or more races 14% Asian 4%
- Hispanic origin (detail)
- Puerto Rican 29% Dominican 2%
- Common ancestry
- Lithuanian 8% Romanian 4% Russian 1%
- Foreign-born
- 7% · Canada
- Languages at home
- 72% English-only · Spanish 24% Other Indo-European 1% Vietnamese 1%
Political lean MEDSL · Hampden
- 2024 margin
- Lean D (+8.9) · D 53.4% · R 44.5% · Other 2.1%
- 2008→2024 swing
- -16.4pp toward R · 2008: 25.3pp · 2024: 8.9pp
- All cycles
- 2024: D+8.9 2020: D+17.7 2016: D+16.0 2012: D+25.4 2008: D+25.3
Not yet ingested
- Civics
- —
Market trends
- HPI YoY
- ▼ -154.94%
- Current HPI
- 349.652
- Rent YoY
- —
- Metro
- —
- State GDP YoY
- ▲ 2.28%
- F500 in state
- 38
Industry mix (Fortune 500 HQ in MA)
| Industry | F500 HQs | Revenue |
|---|---|---|
| Technology | 3 | $17B |
|
||
| Insurance | 2 | $84B |
|
||
| Retail | 2 | $76B |
|
||
| Life Sciences | 1 | $43B |
|
||
| Energy Technology | 1 | $31B |
|
||
| Aerospace / Defense | 1 | $18B |
|
||
Price history
1 event — show timeline
- 2026-06-03 Listed $134,900 MLS PIN
Cash-flow waterfall
monthlySold comps — $/sqft
last 12 mo · ≤1 miLoading sold comps…