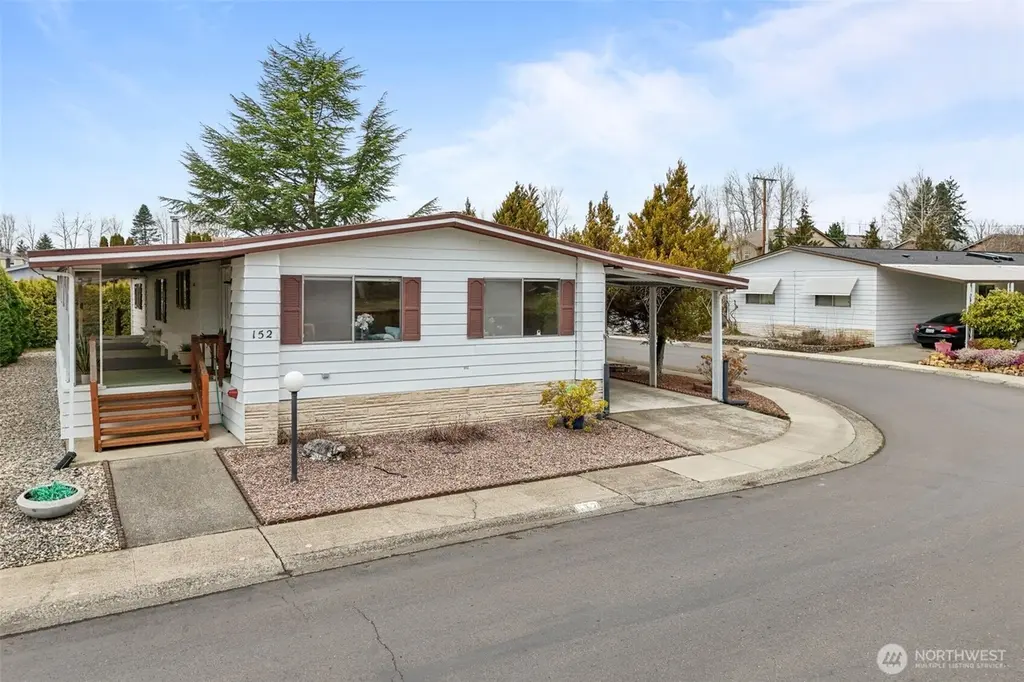
11436 SE 208th St #152 · Kent, WA
Flood risk 1/10 · Minimal
- FEMA flood zone
- X (unshaded)
- Chance of flooding over 30 yrs
- 0.0%
- Est. flood insurance / yr
- $473 – $860
Fire risk 1/10 · Minimal
- Est. fire insurance / yr
- $604 – $1,122
Heat risk 3/10 · Minor
- Hot days now (above 87°F)
- 7 days/yr
- Hot days in 30 yrs
- 15 days/yr
Wind risk 1/10 · Minimal
- Chance of severe wind over 30 yrs
- —
Air-quality risk 8/10 · Major
- Unhealthy air days now
- 12 days/yr
- Unhealthy air days in 30 yrs
- 12 days/yr
Risk factors via First Street. Map © Google.
Why this score? — see what drove the B grade
The composite is a weighted blend of 9 inputs, each scored 0–100. Each bar is that input's sub-score; the figure is the points it added to the 100-point composite (weight × sub-score).
- Cash flow +30.0/30.0
- 1% rule +10.0/10.0
- DSCR +10.0/10.0
- ARV discount +9.7/15.0
- Schools +4.8/10.0
- Livability +4.0/5.0
- Rent growth +3.4/5.0
- Condition / age +2.5/5.0
- Appreciation +0.0/10.0
$125,000
🖨 Deal sheet 📄 Offer letter ✓ Due diligence
Listing remarks
One of the largest homes available in Pantera Lago, this spacious 1,488 sq ft residence offers outstanding value and flexible living in a vibrant 55+ community. Designed with comfort and functionality in mind, the generous layout provides multiple living areas, ample storage, and room to spread out—ideal for everyday living, hobbies, or hosting guests. The home features a bright and open feel, enhanced by natural light and thoughtful design. Enjoy year-round comfort with a heat pump and A/C, plus the cozy charm of a freestanding wood stove for relaxing evenings. Step outside to a covered deck—perfect for morning coffee or quiet outdoor enjoyment. Additional features include acce
Key facts
- Ada access
- Heat pump
- Swimming pool
Tags
Neighborhood map
What this means for you Summary
Snapshot
- This is a 2-bed/2.0-bath manufactured listed at $125k.
Deal economics
- At list price, monthly cash flow is $1k ($12k/yr) — positive.
- The deal already cash-flows at list — no discount required.
- Meets the 1% rule at list price ($2k rent vs $125k).
- Recommended offer: $114k (9.0% below list) — sets the bar for market timing.
- Cap rate 16.3% vs local median 2.7% in Kent — top-decile yield for the area; either an underpriced asset or a hidden risk that comps aren't pricing in. Stress-test before assuming the spread holds.
Location & tenants
- Location reads 79/100 on livability (#109 in WA, #2,154 nationally) — a middle-class / working-renter tenant base. Strengths: amenities A+, commute A+, housing A+; Watch: schools C-, crime F, cost of living F.
- Kent School District (urban): math 47% / reading 57% proficiency, ranked #109 of 291 in WA (top 38%) — acceptable for families but not a draw, mixed tenant base, ~2y average lease.
- Market conditions: Rents rising (+3.5%/yr); 167 active listings in the ZIP; 14 comparable units currently listed for rent nearby; rentals at typical pace (median 24d on market — plan ~3-4 weeks tenant-placement turnaround); solid renter incomes; 10,555 units permitted in King County in 2024 (7,119 in 5+ unit buildings).
Forward outlook
- Local home prices are declining (-3.0%/yr); year-one equity from $864 of loan paydown is wiped out by about $4k of value loss. Plan a longer hold.
- King County population projected at +44% by 2050 — long-run rental-demand tailwind backs the buy-and-hold thesis.
- At projected returns (-3.0% appreciation + 3.5% rent growth), your $35k cash investment doubles in ~4 years — after that, you're playing with house money.
Negotiation context
- It's been on market 102 days — a 9% lower offer ($114k) is reasonable based on typical stale-listing flexibility.
- 5 sale attempts since 20y ago with the ask held roughly flat each time — persistent listings suggest the price (not the market) is what's stuck; bring a comps-based counter.
- Current owner paid $79k; list at $125k implies a 58% gain — meaningful room to come down on a strong offer.
Questions for the listing agent
- It's been on market 102 days. Have you received any prior offers? Is the seller open to a 9% concession, seller financing, or rate buy-down credit?
- Why hasn't it sold? Are there any deal-killer items the seller is aware of (foundation, flood, title, zoning, code violations)?
- Is there a deadline driving the sale (1031 exchange, divorce, estate, relocation)? That informs how much negotiation room exists.
- Crime grade is F in this area — have there been break-ins, vandalism, or insurance claims at this property in the last 3 years? What carrier currently insures it and at what premium?
- What's the average days-on-market for RENTAL listings here right now (not sales)? A rising rental-DOM trend means longer vacancies and softer asking-rent achievability than the comps imply.
- What's the recent tenant-quality profile in this submarket — average credit score on applications, eviction rate, late-payment / NSF rate, and stable-employment percentage? A property-management company in the area should have these aggregated.
- How much new for-sale + rental construction is in the pipeline within 1–3 miles? Heavy new supply typically softens prices + rents 12–24 months out; constrained supply supports both.
Investment metrics
- 1% rule
- 1.93% ✓
- Cap rate
- 16.27%
- Cash-on-cash
- 35.63%
- DSCR
- 2.59
- GRM
- 4.3
CMA / ARV
- ARV (median comp)
- $131,515
- List price
- $125,000
- Delta
- -4.95%
- Verdict
- FAIR
- Comps
- 14 within 1.0 mi
Show comp detail 11 sales within ~0.75 mi
| Address | Dist | Beds/Ba | Sqft | Sold | Price | $/sf | Match |
|---|---|---|---|---|---|---|---|
| 11436 SE 208th St #36 | 0.00mi | 3/2.0 (+1) | 1,500 (+1%) | 5mo | $168,000 | $112 | 89 |
| 11436 SE 208th St #180 | 0.06mi | 2/2.0 | 1,440 (-3%) | 5mo | $132,500 | $92 | 88 |
| 11436 SE 208th St #88 | 0.00mi | 3/2.0 (+1) | 1,464 (-2%) | 8mo | $126,000 | $86 | 86 |
| 20750 113th Pl SE | 0.10mi | 3/2.0 (+1) | 1,456 (-2%) | 4mo | $65,000 | $45 | 83 |
| 11436 SE 208th St #116 | 0.00mi | 2/2.0 | 1,498 (+1%) | 20mo | $145,000 | $97 | 82 |
| 11436 SE 208th St #41 | 0.00mi | 2/2.0 | 1,458 (-2%) | 24mo | $250,000 | $171 | 77 |
| 11436 SE 208th St #124 | 0.06mi | 2/2.0 | 1,680 (+13%) | 0mo | $115,000 | $68 | 76 |
| 11436 SE 208th St #15 | 0.06mi | 2/2.0 | 1,566 (+5%) | 16mo | $255,000 | $163 | 75 |
| 11436 SE 208th St #92 | 0.06mi | 3/2.0 (+1) | 1,536 (+3%) | 17mo | $133,500 | $87 | 73 |
| 11436 SE 208th St #123 | 0.06mi | 2/2.0 | 1,659 (+12%) | 11mo | $130,000 | $78 | 69 |
| 12218 SE 206th St | 0.60mi | 3/2.0 (+1) | 1,480 (-0%) | 6mo | $415,000 | $280 | 61 |
Match score weights: distance 35% · size 25% · config 20% · recency 20%. Top-matched comps best support the ARV.
Projected returns pro-forma
-3.0% appreciation · 3.53% rent growth · sell at horizon
- IRR
- 31.9%
- Equity multiple
- 2.35×
- Total profit
- $47,262
- Equity at exit
- $18,638
- IRR
- 39.3%
- Equity multiple
- 4.77×
- Total profit
- $131,888
- Equity at exit
- $10,808
Cash invested: $35,000 (down + closing). Projections, not guarantees.
Landlord ↔ Tenant lean methodology
- Overall (STATE)
- 28 Tenant-Leaning
- State Washington
- 28 Tenant-Leaning · D+8
- County
- — inherits STATE
- City
- — inherits STATE
ZIP-level market 98031
- Rents YoY
- 3.5%
- Active inventory
- 167
- Price-to-rent
- 4.3×
Monthly cashflow live
- Estimated rent
- $2,409 high interval (Pro) →
- Mortgage (P&I)
- −$656
- Tax est. 1.5%
- −$156 /mo · $1,875/yr
- Insurance
- −$52
- HOA
- −$0
- Vacancy / Maint / Mgmt
- −$506
- Net cashflow
- $1,039
Break-even live
UW: 25.0% down · 7.5% · 30yr · 1.5% tax · 5.0% vac · 8.0% maint · 8.0% mgmt
Financing live
Cash to close
- Down payment
- $31,250
- Closing costs
- $3,750
- Reserves months
- —
- Total cash needed
- —
Loan-product check · same deal, 3 products live
Conventional
25% down · 7.5% · 30yr
- Down + closing
- —
- Monthly P&I
- —
- Monthly cashflow
- —
- DSCR
- —
- Eligible?
- —
Personal DTI + credit; lowest rate.
DSCR
20% down · 8.5% · 30yr
- Down + closing
- —
- Monthly P&I
- —
- Monthly cashflow
- —
- DSCR
- —
- Eligible?
- —
No personal income docs; deal must DSCR.
Hard money
10% down · 12.0% · 12mo
- Down + closing
- —
- Monthly P&I
- —
- Monthly cashflow
- —
- DSCR
- —
- Eligible?
- —
Short-term bridge; refi at stabilization.
Rent comps 14 comps
| Address | Beds | Baths | Sqft | Rent | $/sqft | DOM | Units | Dist |
|---|---|---|---|---|---|---|---|---|
| 20803 110th Ln SE Kent, WA | 2.0 | 2.5 | 1361 | $2,845 | $2.09 | 43d | 1 | 0.22mi |
| 20805 109th Ln SE Kent, WA | 2.0 | 1.5 | 1250 | $2,700 | $2.16 | 43d | 1 | 0.26mi |
| 11101 SE 208th St Kent, WA | 1.0–3.0 | 1.0–2.0 | 971 | $1,978 | $2.04 | 1d | 17 | 0.28mi |
| 10820 SE 211th Pl Kent, WA | 1.0–3.0 | 1.0–1.5 | 907 | $2,032 | $2.24 | 2d | 20 | 0.29mi |
| 12012 SE 210th St Kent, WA | 3.0 | 1.5 | 1230 | $1,820 | $1.48 | 24d | 1 | 0.48mi |
| 20506 103rd Ave SE Kent, WA | 3.0 | 1.0 | 1180 | $2,295 | $1.94 | 23d | 1 | 0.63mi |
| 21822 107th Pl SE #6 Kent, WA | 3.0 | 1.5 | 1152 | $1,525 | $1.32 | 21d | 1 | 0.82mi |
| 19388 114th Pl SE Kent, WA | 3.0 | 2.5 | 1600 | $3,095 | $1.93 | 43d | 1 | 0.82mi |
| 11500 SE 221st Pl Kent, WA | 3.0 | 2.5 | 1770 | $3,100 | $1.75 | 43d | 1 | 0.95mi |
| 21627 127th Pl SE Kent, WA | 3.0 | 2.0 | 1420 | $3,095 | $2.18 | 16d | 1 | 1.08mi |
| 11211 SE 226th St Kent, WA | 3.0 | 2.0 | 1012 | $2,250 | $2.22 | 18d | 1 | 1.24mi |
| 9333 S 200th St Kent, WA | 3.0 | 1.0 | 1060 | $2,450 | $2.31 | 4d | 1 | 1.27mi |
| 10815 SE 184th Ln Renton, WA | 1.0–2.0 | 1.0–2.0 | 860 | $2,445 | $2.84 | 15d | 3 | 1.42mi |
| 10530 SE 229th Pl Kent, WA | 3.0 | 1.0 | 1000 | $3,000 | $3.00 | 43d | 1 | 1.48mi |
Listing history 25 events
-
2026-06-18days on market $125,000 Active 102 DOM
-
2026-06-17days on market $125,000 Active 101 DOM
-
2026-06-16days on market $125,000 Active 100 DOM
-
2026-06-15days on market $125,000 Active 99 DOM
-
2026-06-13days on market $125,000 Active 97 DOM
-
2026-06-09days on market $125,000 Active 93 DOM
-
2026-06-08days on market $125,000 Active 92 DOM
-
2026-06-07days on market $125,000 Active 91 DOM
-
2026-06-04days on market $125,000 Active 88 DOM
-
2026-06-03days on market $125,000 Active 87 DOM
-
2026-06-02days on market $125,000 Active 86 DOM
-
2026-06-01days on market $125,000 Active 85 DOM
-
2026-05-31days on market $125,000 Active 84 DOM
-
2026-03-26status Active
-
2026-03-23status Pending
-
2026-03-05$125,000 Active
-
2020-05-15soldstatus $79,000 Sold
-
2020-05-05status Pending Inspection
-
2020-05-02$79,000 Active
-
2017-05-18soldstatus $67,000 Sold
-
2017-04-22status Pending
-
2017-04-19status Pending Inspection
-
2017-04-06$75,000 Active
-
2006-04-26soldstatus $67,500
-
2006-02-16$67,500
ⓘ Source: listings_history table (triggers on properties + properties_extension) + one-shot
backfill from property_details.listing_events for pre-trigger history.
Climate risk First Street
- Flood 1/10 Low FEMA zone X (unshaded) · 0% chance over 30 yrs
- Wildfire 1/10 Low
- Heat 3/10 Moderate 7 d/yr ≥87°F today · 15 d/yr by 30 yrs out
- Wind 1/10 Low
- Air quality 8/10 Severe 12 unhealthy d/yr today · 12 by 30 yrs out
Nearby sold comps map
Loading sold comps map…
Walkable amenities ~0.75 mi
Loading nearby amenities…
Taxation est. · year 1
- Rental income
- $28,908
- − Mortgage interest
- −$7,002
- − Property taxes
- −$1,875
- − Insurance
- −$625
- − Repairs & maintenance
- −$2,313
- − Management
- −$2,313
- − Depreciation
- −$3,636
- Taxable income
- $11,144
- Est. tax owed @ 24.0%
- −$2,675
- After-tax cash flow
- $9,796/yr
For passive investors: Depreciation is non-cash, so a rental often shows a tax loss while cash-flowing — sheltering income. Rental losses are passive: they offset passive income freely, and up to $25,000/yr can offset ordinary (W-2) income if you actively participate and your MAGI is under $100k (phasing out to $0 by $150k); unused losses carry forward. On sale, claimed depreciation is recaptured at up to 25%, and gains may owe capital-gains tax (a 1031 exchange can defer both). Figures are a year-1 estimate at your 24.0% rate — not tax advice; consult a CPA.
Schools (NCES district)
- District
- Kent School District
- NCES district ID
- 5303960
- Math proficiency
- 47% ▼ -1.00%
- Reading proficiency
- 57% ▼ -1.00%
- Median HH income
- $69,823
- Composite
- 48.25/100
- National rank
- #4714
- State rank
- #109 of 291 in WA
Livability — Kent
- Score
- 79/100
- State rank
- #109
- US rank
- #2154
Category grades
Schools grade is shown separately in the Schools card above.
Census & demographics
- Census place
- Kent, WA
- County
- King County · 2,251,916 people
- City population
- 119,479
- Metro
- Seattle-Tacoma-Bellevue, WA
- Population (ZIP)
- 40,094
- Household income
- $105,965
- Rent vs Own
- Severe rent burden
- 1151.0
Population outlook (King County) Hauer SSP2
- Today (2025)
- 2,576,485 people
- By 2030
- 2,803,316 · +8.8%
- By 2040
- 3,255,921 · +26.4%
- By 2050
- 3,706,444 · +43.9%
- By 2075
- 4,746,063 · +84.2%
- By 2100
- 5,407,730 · +109.9%
Race, ethnicity, and origin ACS 2023
- Neighborhood character
- Highly diverse neighborhood (Simpson 0.77)
- Race & ethnicity
- White 36% Asian 27% Black 13% Hispanic / Latino 13% Two or more races 13% Pacific Islander 1%
- Hispanic origin (detail)
- Mexican 9%
- Common ancestry
- Italian 5% Portuguese 2% Subsaharan African 2%
- Foreign-born
- 31% · Canada, Vietnam, China
- Languages at home
- 58% English-only · Spanish 9% Other Indo-European 7% Vietnamese 4%
Political lean MEDSL · King
- 2024 margin
- Solid D (+51.7) · D 74.2% · R 22.5% · Other 3.4%
- 2008→2024 swing
- +9.6pp toward D · 2008: 42.1pp · 2024: 51.7pp
- All cycles
- 2024: D+51.7 2020: D+52.7 2016: D+50.4 2012: D+39.9 2008: D+42.1
Not yet ingested
- Civics
- —
Market trends
- HPI YoY
- ▼ -673.58%
- Current HPI
- 308.1747
- Rent YoY
- ▲ 3.53%
- Metro
- Seattle-Tacoma-Bellevue, WA
- State GDP YoY
- ▲ 4.65%
- F500 in state
- 22
Industry mix (Fortune 500 HQ in WA)
| Industry | F500 HQs | Revenue |
|---|---|---|
| Retail | 2 | $269B |
|
||
| Technology / Retail | 1 | $638B |
|
||
| Technology | 1 | $245B |
|
||
| Telecommunications | 1 | $38B |
|
||
| Food / Beverage | 1 | $36B |
|
||
| Automotive / Trucks | 1 | $34B |
|
||
Price history
+85.2% since first listed12 events — show timeline
- 2026-03-26 Relisted — NWMLS as Distributed by MLS Grid
- 2026-03-23 Pending — NWMLS as Distributed by MLS Grid
- 2026-03-05 Listed $125,000 NWMLS as Distributed by MLS Grid
- 2020-05-15 Sold (MLS) $79,000 NWMLS as Distributed by MLS Grid
- 2020-05-05 Pending — NWMLS as Distributed by MLS Grid
- 2020-05-02 Listed $79,000 NWMLS as Distributed by MLS Grid
- 2017-05-18 Sold (MLS) $67,000 NWMLS as Distributed by MLS Grid
- 2017-04-22 Pending — NWMLS as Distributed by MLS Grid
- 2017-04-19 Pending — NWMLS as Distributed by MLS Grid
- 2017-04-06 Listed $75,000 NWMLS as Distributed by MLS Grid
- 2006-04-26 Sold (MLS) $67,500 NWMLS as Distributed by MLS Grid
- 2006-02-16 Listed $67,500 NWMLS as Distributed by MLS Grid
Cash-flow waterfall
monthlySold comps — $/sqft
last 12 mo · ≤1 miLoading sold comps…