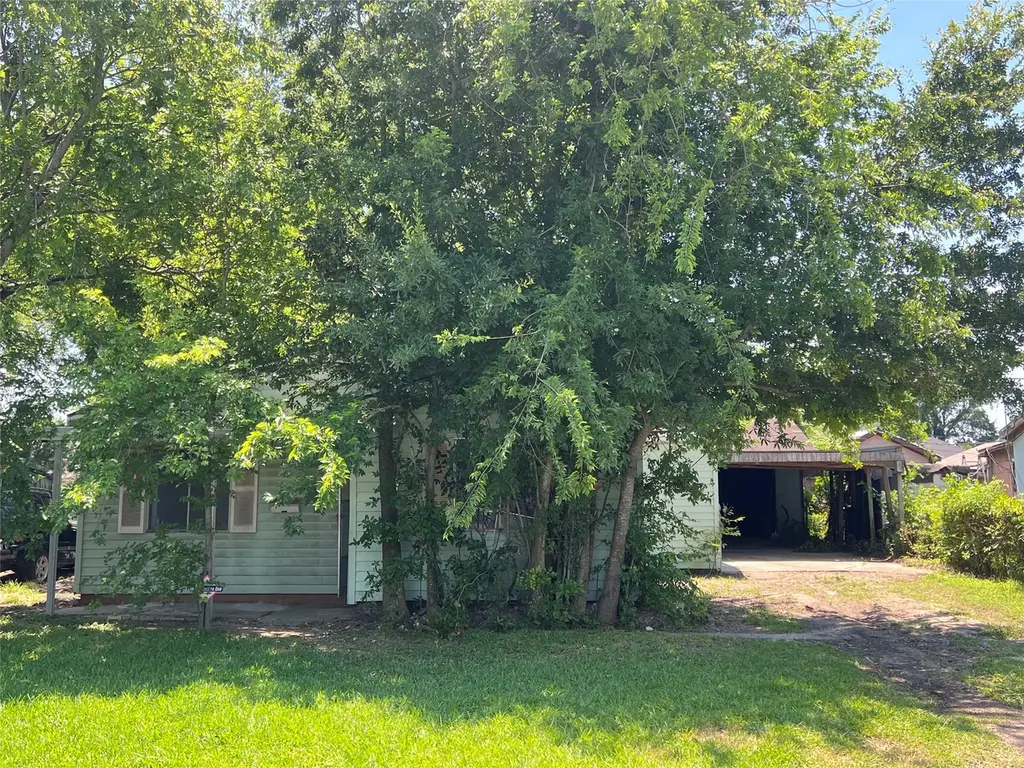
10338 Wiggins St · Jacinto City, TX
Flood risk 1/10 · Minimal
- FEMA flood zone
- X (unshaded)
- Chance of flooding over 30 yrs
- 0.0%
- Est. flood insurance / yr
- $507 – $1,088
Fire risk 3/10 · Minor
- Est. fire insurance / yr
- $1,222 – $2,270
Heat risk 9/10 · Severe
- Hot days now (above 109°F)
- 7 days/yr
- Hot days in 30 yrs
- 25 days/yr
Wind risk 9/10 · Severe
- Chance of severe wind over 30 yrs
- 99.0%
Air-quality risk 2/10 · Minimal
- Unhealthy air days now
- 2 days/yr
- Unhealthy air days in 30 yrs
- 2 days/yr
Risk factors via First Street. Map © Google.
Why this score? — see what drove the B+ grade
The composite is a weighted blend of 9 inputs, each scored 0–100. Each bar is that input's sub-score; the figure is the points it added to the 100-point composite (weight × sub-score).
- Cash flow +24.9/30.0
- ARV discount +15.0/15.0
- Appreciation +10.0/10.0
- 1% rule +8.8/10.0
- DSCR +8.1/10.0
- Livability +3.5/5.0
- Schools +2.8/10.0
- Rent growth +2.5/5.0
- Condition / age +2.5/5.0
$79,990
🖨 Deal sheet (PDF) 📄 Offer letter ✓ Due diligence
Listing remarks
Investor Special in the heart of Jacinto City! This 934 sqft, 2-bedroom, 1-bath fixer-upper sits on a 5,000 sqft lot and is full of potential for an investor, flipper, or buyer looking to customize a home to their liking. Major improvements have already been completed, including foundation repairs with a lifetime transferable warranty for added peace of mind. Inside, the home features newly installed wood laminate flooring and offers a great layout ready for the next owner to bring their vision to life. The oversized detached garage provides plenty of room for parking, storage, workshop space, or additional project potential. Conveniently located with easy access to nearby shopping, dining,
Key facts
- 5,000 sq ft lot
- 3 garage spots
- Built 1950
Tags
Property features AI
Finance
- Other: Building area approximately 934; Lot about 5,000 square feet (0.1148 acres)
- Financial info: Lease not considered
Exterior
- Parking: Detached garage; 3 garage spaces
- Utilities: Public water; Public sewer; Public power
- Home design: Residential property; Full ownership; Entry on slab foundation
- Construction: Built in 1950; Cement siding, vinyl siding, and wood siding; Composition roof; Slab foundation
- Exterior features: Concrete road surface; Located in a subdivision
Interior
- Bedrooms: 5 total rooms
- Bathrooms: 1 full bathroom
- Heating & cooling: Heating available (space heater); Window units for cooling and heating
- Interior features: Washer hookup; Electric dryer hookup; Gas dryer hookup
- Laundry & utility: Washer hookup; Electric dryer hookup; Gas dryer hookup
Neighborhood map
What this means for you Summary
Snapshot
- This is a 2-bed/1.0-bath single-family listed at $80k.
Deal economics
- At list price, monthly cash flow is $172 ($2k/yr) — positive.
- The deal already cash-flows at list — no discount required.
- Meets the 1% rule at list price ($1k rent vs $80k).
- Recommended offer: $79k (1.5% below list) — sets the bar for market timing.
Location & tenants
- Location reads 70/100 on livability (#384 in TX) — a middle-class / working-renter tenant base. Strengths: cost of living A+, housing A+, health & safety A-; Watch: amenities F, commute F, employment F.
- Galena Park ISD (suburban): math 32% / reading 33% proficiency, ranked #578 of 826 in TX (top 70%) — families likely to look elsewhere, expect single-tenant / working-renter base with shorter leases; 74% free/reduced lunch — lower-income household profile, screen leases tightly.
- Zoned schools: Jacinto City El (math 31% / reading 32%, grade F, #2,396 of 4,322 statewide, top 56%, 714 students, 89% FRL); Galena Park Middle (math 28% / reading 31%, grade F, #1,077 of 1,662 statewide, top 66%, 943 students, 88% FRL); Galena Park H S (math 37% / reading 36%, grade F, #924 of 1,632 statewide, top 57%, 1,914 students, 87% FRL).
- Market conditions: 154 active listings in the ZIP; 24 comparable units currently listed for rent nearby; rentals at typical pace (median 15d on market — plan ~3-4 weeks tenant-placement turnaround); 29,883 units permitted in Harris County in 2024 (8,621 in 5+ unit buildings).
Forward outlook
- In year one you build about $9k of equity ($554 loan paydown + $8k appreciation (10.0% local appreciation)).
- Harris County population projected at +47% by 2050 — long-run rental-demand tailwind backs the buy-and-hold thesis.
- At projected returns (10.0% appreciation + 3.0% rent growth), your $22k cash investment doubles in ~3 years — after that, you're playing with house money.
- By year 4, paydown + projected appreciation supports a ~$30k cash-out refi (75% LTV) — recoverable capital for the next deal without selling this one.
Negotiation context
- It's been on market 16 days — a 2% lower offer ($79k) is reasonable based on typical stale-listing flexibility.
Risks & watch-outs
- Watch-outs: property tax is 3.7% of price; built in 1950 — expect roof / HVAC / electrical / plumbing capex.
- Climate carrying-cost: severe wind risk, 99% chance of damaging wind over 30y; extreme-heat days projected 7→25/yr by 2055 (HVAC capex compounding) — expect insurance premiums to compound above CPI over the hold.
Questions for the listing agent
- Built in 1950 — when were the roof, HVAC, electrical panel, plumbing, and water heater last replaced?
- Property tax is high relative to price — has the assessment been appealed recently, and will the sale trigger a re-assessment?
- Is there a deadline driving the sale (1031 exchange, divorce, estate, relocation)? That informs how much negotiation room exists.
- Schools are F-rated, which usually means shorter tenancies and higher turnover. Who's the typical renter profile here, and what's been the actual vacancy rate?
- What's the average days-on-market for RENTAL listings here right now (not sales)? A rising rental-DOM trend means longer vacancies and softer asking-rent achievability than the comps imply.
- What's the recent tenant-quality profile in this submarket — average credit score on applications, eviction rate, late-payment / NSF rate, and stable-employment percentage? A property-management company in the area should have these aggregated.
- How much new for-sale + rental construction is in the pipeline within 1–3 miles? Heavy new supply typically softens prices + rents 12–24 months out; constrained supply supports both.
Investment metrics
- 1% rule
- 1.38% ✓
- Cap rate
- 8.87%
- Cash-on-cash
- 9.22%
- DSCR
- 1.41
- GRM
- 6.0
CMA / ARV
- ARV (median comp)
- $142,998
- List price
- $79,990
- Delta
- -44.06%
- Verdict
- UNDERPRICED
- Comps
- 20 within 1.0 mi
Show comp detail 9 sales within ~0.75 mi
| Address | Dist | Beds/Ba | Sqft | Sold | Price | $/sf | Match |
|---|---|---|---|---|---|---|---|
| 10338 Wiggins St | 0.00mi | 2/1.0 | 934 (0%) | 1mo | $79,990 | $86 | 100 |
| 10338 Norvic St | 0.05mi | 2/2.0 | 800 (-14%) | 3mo | $160,000 | $200 | 67 |
| 10713 Burman St | 0.36mi | 3/2.0 (+1) | 933 (-0%) | 14mo | $159,000 | $170 | 62 |
| 10314 Chadwick St | 0.26mi | 2/1.0 | 800 (-14%) | 2mo | $139,000 | $174 | 62 |
| 10530 Chadwick St | 0.32mi | 2/1.0 | 800 (-14%) | 1mo | $85,265 | $107 | 60 |
| 10113 Flaxman St | 0.44mi | 3/1.0 (+1) | 994 (+6%) | 13mo | $150,000 | $151 | 53 |
| 10617 Burman St | 0.28mi | 2/1.0 | 828 (-11%) | 20mo | $225,000 | $272 | 51 |
| 11002 Muscatine St | 0.69mi | 2/1.0 | 969 (+4%) | 18mo | $105,000 | $108 | 46 |
| 10638 Fairfax St | 0.48mi | 3/1.5 (+1) | 1,039 (+11%) | 22mo | $213,000 | $205 | 34 |
Match score weights: distance 35% · size 25% · config 20% · recency 20%. Top-matched comps best support the ARV.
Projected returns pro-forma
10.0% appreciation · 3.0% rent growth · sell at horizon
- IRR
- 31.1%
- Equity multiple
- 3.44×
- Total profit
- $54,628
- Equity at exit
- $72,061
- IRR
- 26.9%
- Equity multiple
- 7.81×
- Total profit
- $152,470
- Equity at exit
- $155,403
Cash invested: $22,397 (down + closing). Projections, not guarantees.
Landlord ↔ Tenant lean methodology
- Overall (STATE)
- 87 Strongly Landlord-Friendly
- State Texas
- 87 Strongly Landlord-Friendly · R+5
- County
- — inherits STATE
- City
- — inherits STATE
ZIP-level market 77029
- Home prices YoY
- 7.2%
- Active inventory
- 154
- Price-to-rent
- 6.0×
Monthly cashflow live
- Estimated rent
- $1,106 high interval (Pro) →
- Mortgage (P&I)
- −$419
- Tax from tax record
- −$249 /mo · $2,984/yr
- Insurance
- −$33
- HOA
- −$0
- Vacancy / Maint / Mgmt
- −$232
- Net cashflow
- $172
Break-even live
Sensitivity live
| Price | -10% $217 | -5% $195 | +0% $172 | +5% $149 | +10% $127 |
|---|---|---|---|---|---|
| Rent | -10% $85 | -5% $128 | +0% $172 | +5% $216 | +10% $259 |
| Rate | -1.0pp $212 | -0.5pp $192 | base $172 | +0.5pp $151 | +1.0pp $130 |
UW: 25.0% down · 7.5% · 30yr · 1.5% tax · 5.0% vac · 8.0% maint · 8.0% mgmt
Financing live
Cash to close
- Down payment
- $19,998
- Closing costs
- $2,400
- Reserves months
- —
- Total cash needed
- —
Loan-product check · same deal, 3 products live
Conventional
25% down · 7.5% · 30yr
- Down + closing
- —
- Monthly P&I
- —
- Monthly cashflow
- —
- DSCR
- —
- Eligible?
- —
Personal DTI + credit; lowest rate.
DSCR
20% down · 8.5% · 30yr
- Down + closing
- —
- Monthly P&I
- —
- Monthly cashflow
- —
- DSCR
- —
- Eligible?
- —
No personal income docs; deal must DSCR.
Hard money
10% down · 12.0% · 12mo
- Down + closing
- —
- Monthly P&I
- —
- Monthly cashflow
- —
- DSCR
- —
- Eligible?
- —
Short-term bridge; refi at stabilization.
Rent comps 24 comps
| Address | Beds | Baths | Sqft | Rent | $/sqft | DOM | Units | Dist |
|---|---|---|---|---|---|---|---|---|
| 10208 Challenger 7 Dr Jacinto City, TX | 2.0 | 1.0 | 900 | $1,190 | $1.32 | 44d | 1 | 0.29mi |
| 10202 Challenger 7 Dr Unit 10223 Jacinto City, TX | 1.0 | 1.0 | 615 | $823 | $1.34 | 0d | 1 | 0.32mi |
| 10202 Challenger 7 Dr Unit 10223 Jacinto City, TX | 1.0 | 1.0 | 705 | $1,009 | $1.43 | 15d | 1 | 0.32mi |
| 10202 Challenger 7 Dr Unit 10253 Jacinto City, TX | 1.0 | 1.0 | 705 | $1,004 | $1.42 | 44d | 1 | 0.32mi |
| 10202 Challenger 7 Dr Unit 10259 Jacinto City, TX | 2.0 | 2.0 | 900 | $1,099 | $1.22 | 0d | 1 | 0.32mi |
| 10202 Challenger 7 Dr Unit 422 Jacinto City, TX | 2.0 | 2.0 | 900 | $1,115 | $1.24 | 8d | 1 | 0.32mi |
| 10202 Challenger 7 Dr Unit 1162 Jacinto City, TX | 1.0 | 1.0 | 615 | $834 | $1.36 | 6d | 1 | 0.32mi |
| 10202 Challenger 7 Dr Apt 321 Jacinto City, TX | 1.0 | 1.0 | 615 | $834 | $1.36 | 8d | 1 | 0.32mi |
| 10202 Challenger 7 Dr Unit 424 Jacinto City, TX | 2.0 | 2.0 | 900 | $1,115 | $1.24 | 6d | 1 | 0.32mi |
| 10202 Challenger 7 Dr Unit 1047 Jacinto City, TX | 1.0 | 1.0 | 705 | $971 | $1.38 | 19d | 1 | 0.33mi |
| 10202 Challenger 7 Dr Unit 2047 Jacinto City, TX | 2.0 | 2.0 | 900 | $1,150 | $1.28 | 12d | 1 | 0.33mi |
| 10202 Challenger 7 Dr Unit 1047 Jacinto City, TX | 1.0 | 1.0 | 615 | $864 | $1.40 | 0d | 1 | 0.33mi |
| 10202 Challenger 7 Dr Jacinto City, TX | 1.0 | 1.0 | 615 | $823 | $1.34 | 13d | 1 | 0.33mi |
| 1726 Switzer St Unit 4 Houston, TX | 1.0 | 1.0 | 620 | $500 | $0.81 | 20d | 1 | 0.46mi |
| 1726 Switzer St Houston, TX | 1.0 | 1.0 | 620 | $500 | $0.81 | 16d | 1 | 0.46mi |
| 9907 Lanewell St Unit a Houston, TX | 3.0 | 2.0 | 872 | $1,154 | $1.32 | 23d | 1 | 0.62mi |
| 9701 Market St Houston, TX | 1.0–2.0 | 1.0 | 798 | $1,309 | $1.64 | 8d | 1 | 0.72mi |
| 9806 Fillmore St Houston, TX | 2.0 | 2.0 | 850 | $1,850 | $2.18 | 44d | 1 | 0.77mi |
| 9713 Stedman St Unit b Houston, TX | 3.0 | 2.0 | 872 | $1,095 | $1.26 | 44d | 1 | 1.15mi |
| 9743 Veyblum St Unit B Houston, TX | 3.0 | 2.0 | 872 | $1,145 | $1.31 | 6d | 1 | 1.24mi |
| 8726 Josie St Houston, TX | 3.0 | 1.0 | 950 | $1,000 | $1.05 | 44d | 1 | 1.39mi |
| 8710 Josie St Houston, TX | 3.0 | 1.0 | 1000 | $1,090 | $1.09 | 0d | 1 | 1.43mi |
| 768 Coolwood Dr Houston, TX | 2.0 | 1.0 | 1102 | $1,295 | $1.18 | 44d | 1 | 1.47mi |
| 778 Coolwood Dr Houston, TX | 2.0 | 1.0 | 1000 | $1,295 | $1.29 | 44d | 1 | 1.50mi |
Listing history 5 events
-
2026-05-31status $79,990 Pending 16 DOM
-
2026-05-31days on market $79,990 Active 16 DOM
-
2026-05-15$89,990 Active 966-char remark
-
2026-05-05soldstatus
-
1988-06-19soldstatus
ⓘ Source: listings_history table (triggers on properties + properties_extension) + one-shot
backfill from property_details.listing_events for pre-trigger history.
Tax reassessment forecast TX · Resets to sale price
- Current annual tax
- $2,984 · $249/mo
- Projected year-2 tax
- $2,984 · $249/mo
- Expected delta
- $0/yr ($0/mo · 0.0%)
ⓘ Screening estimate from a state-policy table — verify with the county assessor before closing.
Climate risk First Street
- Flood 1/10 Low FEMA zone X (unshaded) · 0% chance over 30 yrs
- Wildfire 3/10 Moderate
- Heat 9/10 Extreme 7 d/yr ≥109°F today · 25 d/yr by 30 yrs out
- Wind 9/10 Extreme 99% chance of damaging wind over 30 yrs
- Air quality 2/10 Low 2 unhealthy d/yr today · 2 by 30 yrs out
Nearby sold comps map
Loading sold comps map…
Walkable amenities ~0.75 mi
Loading nearby amenities…
Taxation est. · year 1
- Rental income
- $13,269
- − Mortgage interest
- −$4,481
- − Property taxes
- −$2,984
- − Insurance
- −$400
- − Repairs & maintenance
- −$1,061
- − Management
- −$1,061
- − Depreciation
- −$2,327
- Taxable income
- $954
- Est. tax owed @ 24.0%
- −$229
- After-tax cash flow
- $1,835/yr
For passive investors: Depreciation is non-cash, so a rental often shows a tax loss while cash-flowing — sheltering income. Rental losses are passive: they offset passive income freely, and up to $25,000/yr can offset ordinary (W-2) income if you actively participate and your MAGI is under $100k (phasing out to $0 by $150k); unused losses carry forward. On sale, claimed depreciation is recaptured at up to 25%, and gains may owe capital-gains tax (a 1031 exchange can defer both). Figures are a year-1 estimate at your 24.0% rate — not tax advice; consult a CPA.
Schools (NCES district)
- District
- Galena Park ISD
- NCES district ID
- 4820250
- Math proficiency
- 32% ▼ -20.00%
- Reading proficiency
- 33% ▼ -7.00%
- Median HH income
- $43,158
- Composite
- 27.62/100
- National rank
- #6927
- State rank
- #578 of 826 in TX
Livability — Jacinto City
- Score
- 70/100
- State rank
- #384
- US rank
- #8027
Category grades
Schools grade is shown separately in the Schools card above.
Census & demographics
- Census place
- Jacinto City, TX
- County
- Harris County · 4,702,590 people
- City population
- 16,154
- Metro
- Houston-The Woodlands-Sugar Land, TX
- Population (ZIP)
- 16,154
- Household income
- $48,279
- Rent vs Own
- Severe rent burden
- 457.0
Population outlook (Harris County) Hauer SSP2
- Today (2025)
- 5,571,493 people
- By 2030
- 6,089,821 · +9.3%
- By 2040
- 7,142,806 · +28.2%
- By 2050
- 8,185,864 · +46.9%
- By 2075
- 10,574,329 · +89.8%
- By 2100
- 12,109,958 · +117.4%
Race, ethnicity, and origin ACS 2023
- Neighborhood character
- Predominantly Hispanic (72%)
- Race & ethnicity
- Hispanic / Latino 72% Two or more races 32% Black 22% White 5%
- Hispanic origin (detail)
- Mexican 66%
- Foreign-born
- 31% · Canada
- Languages at home
- 39% English-only · Spanish 61%
Political lean MEDSL · Harris
- 2024 margin
- Lean D (+5.5) · D 52.0% · R 46.4% · Other 1.6%
- 2008→2024 swing
- +3.9pp toward D · 2008: 1.6pp · 2024: 5.5pp
- All cycles
- 2024: D+5.5 2020: D+13.3 2016: D+12.4 2012: D+0.1 2008: D+1.6
Not yet ingested
- Civics
- —
Market trends
- HPI YoY
- ▲ 18.53%
- Current HPI
- 276.1811
- Rent YoY
- —
- Metro
- Houston-The Woodlands-Sugar Land, TX
- State GDP YoY
- ▲ 3.95%
- F500 in state
- 110
Industry mix (Fortune 500 HQ in TX)
| Industry | F500 HQs | Revenue |
|---|---|---|
| Energy | 16 | $1,198B |
|
||
| Technology | 5 | $198B |
|
||
| Engineering / Construction | 4 | $72B |
|
||
| Energy Services | 3 | $60B |
|
||
| Utilities | 3 | $41B |
|
||
| Healthcare | 2 | $330B |
|
||
Price history
-11.1% since first listed7 events — show timeline
- 2026-06-04 Sold (Public Records) — Public Records
- 2026-06-04 Sold (MLS) — HARMLS
- 2026-05-31 Pending — HARMLS
- 2026-05-22 Price Changed $79,990 HARMLS
- 2026-05-15 Listed $89,990 HARMLS
- 2026-05-05 Sold (Public Records) — Public Records
- 1988-06-19 Sold (Public Records) — Public Records
Property tax history
+10.0%/yrLatest (2025): $2,984 · +1.3% YoY. Source: county tax records.
Cash-flow waterfall
monthlySold comps — $/sqft
last 12 mo · ≤1 miLoading sold comps…