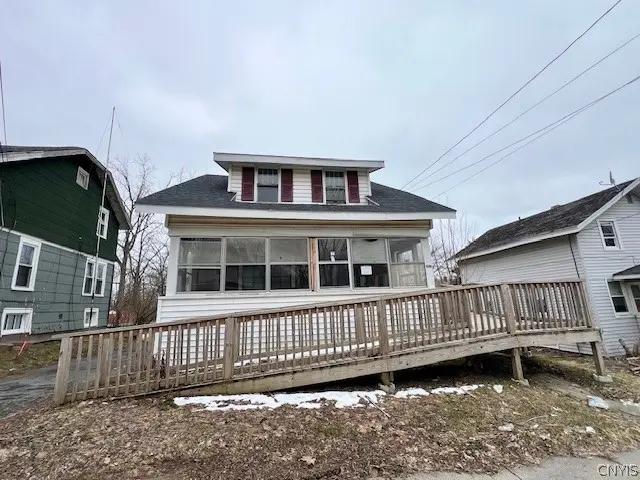
1016 Gotham St · Watertown, NY
Flood risk 1/10 · Minimal
- FEMA flood zone
- X
- Chance of flooding over 30 yrs
- 0.0%
- Est. flood insurance / yr
- $473 – $860
Fire risk 2/10 · Minimal
- Est. fire insurance / yr
- $691 – $1,283
Heat risk 2/10 · Minimal
- Hot days now (above 91°F)
- 7 days/yr
- Hot days in 30 yrs
- 15 days/yr
Wind risk 1/10 · Minimal
- Chance of severe wind over 30 yrs
- 0.0%
Air-quality risk 2/10 · Minimal
- Unhealthy air days now
- 1 days/yr
- Unhealthy air days in 30 yrs
- 1 days/yr
Risk factors via First Street. Map © Google.
Why this score? — see what drove the B grade
The composite is a weighted blend of 9 inputs, each scored 0–100. Each bar is that input's sub-score; the figure is the points it added to the 100-point composite (weight × sub-score).
- Cash flow +30.0/30.0
- 1% rule +10.0/10.0
- DSCR +10.0/10.0
- ARV discount +7.5/15.0
- Rent growth +5.0/5.0
- Schools +3.7/10.0
- Livability +3.4/5.0
- Condition / age +2.5/5.0
- Appreciation +0.0/10.0
$52,000
🖨 Deal sheet 📄 Offer letter ✓ Due diligence
Listing remarks
Opportunity awaits at 1016 Gotham St in Watertown! This 3 bedroom, 1 bathroom home offers 989 square feet of potential and is perfect for investors, flippers, or buyers looking to build equity. Built in 1905, this two story property sits on a 0.14 acre lot and features a detached two car garage, enclosed porch, and full basement. Inside, the home is ready for renovation, giving you the chance to design and update to your own style. Located in a neighborhood setting near public transportation, this property offers convenience and strong upside value. Bring your vision and restore this home to its full potential.
Key facts
- Full basement
- Neighborhood setting
- Enclosed porch
Tags
Neighborhood map
What this means for you Summary
Snapshot
- This is a 3-bed/1.0-bath single-family listed at $52k.
Deal economics
- At list price, monthly cash flow is $688 ($8k/yr) — positive.
- The deal already cash-flows at list — no discount required.
- Meets the 1% rule at list price ($1k rent vs $52k).
- Cap rate 22.2% vs local median 6.2% in Watertown — top-decile yield for the area; either an underpriced asset or a hidden risk that comps aren't pricing in. Stress-test before assuming the spread holds.
Location & tenants
- Location reads 68/100 on livability (#540 in NY) — a middle-class / working-renter tenant base. Strengths: health & safety A+, cost of living A-, housing A-; Watch: amenities C-, schools D, crime F.
- Watertown City School District (urban): math 34% / reading 54% proficiency, ranked #481 of 590 in NY (top 82%) — families likely to look elsewhere, expect single-tenant / working-renter base with shorter leases.
- Market conditions: Rents rising fast (+10.0%/yr); 223 active listings in the ZIP; 8 comparable units currently listed for rent nearby; rentals lingering (median 44d on market — plan ~5-8 weeks vacancy on turnover, expect pricing pressure); 100% of comp listings sitting > 30 days — soft ceiling on asking rent; 196 units permitted in Jefferson County in 2024 (0 in 5+ unit buildings).
Forward outlook
- Local home prices are declining (-3.0%/yr); year-one equity from $360 of loan paydown is wiped out by about $2k of value loss. Plan a longer hold.
- Jefferson County population projected at -12% by 2050 — secular population decline; favor cash flow + early exit over multi-decade hold.
- At projected returns (-3.0% appreciation + 8.0% rent growth), your $15k cash investment doubles in ~2 years — after that, you're playing with house money.
Negotiation context
- Only 14 days on market — expect competitive offers; lowballing is unlikely to land.
Risks & watch-outs
- Watch-outs: property tax is 3.0% of price; built in 1905 — expect roof / HVAC / electrical / plumbing capex.
Questions for the listing agent
- Built in 1905 — when were the roof, HVAC, electrical panel, plumbing, and water heater last replaced?
- Property tax is high relative to price — has the assessment been appealed recently, and will the sale trigger a re-assessment?
- Is there a deadline driving the sale (1031 exchange, divorce, estate, relocation)? That informs how much negotiation room exists.
- Schools are D-rated, which usually means shorter tenancies and higher turnover. Who's the typical renter profile here, and what's been the actual vacancy rate?
- Crime grade is F in this area — have there been break-ins, vandalism, or insurance claims at this property in the last 3 years? What carrier currently insures it and at what premium?
- What's the average days-on-market for RENTAL listings here right now (not sales)? A rising rental-DOM trend means longer vacancies and softer asking-rent achievability than the comps imply.
- What's the recent tenant-quality profile in this submarket — average credit score on applications, eviction rate, late-payment / NSF rate, and stable-employment percentage? A property-management company in the area should have these aggregated.
- How much new for-sale + rental construction is in the pipeline within 1–3 miles? Heavy new supply typically softens prices + rents 12–24 months out; constrained supply supports both.
Investment metrics
- 1% rule
- 2.70% ✓
- Cap rate
- 22.17%
- Cash-on-cash
- 56.72%
- DSCR
- 3.52
- GRM
- 3.1
CMA / ARV
- ARV (on-the-fly)
- $179,009
- Comps found
- 10
Show comp detail 10 sales within ~0.75 mi
| Address | Dist | Beds/Ba | Sqft | Sold | Price | $/sf | Match |
|---|---|---|---|---|---|---|---|
| 1016 Gotham St | 0.00mi | 3/1.0 | 989 (0%) | 1mo | $52,000 | $53 | 99 |
| 400 Pawling St | 0.28mi | 2/1.5 (-1) | 1,010 (+2%) | 20mo | $135,000 | $134 | 60 |
| 1202 Sherman St | 0.70mi | 3/1.5 | 994 (+0%) | 6mo | $215,000 | $216 | 59 |
| 401 Pawling St | 0.27mi | 2/1.0 (-1) | 880 (-11%) | 10mo | $159,000 | $181 | 55 |
| 232 Haley St | 0.20mi | 2/2.0 (-1) | 1,114 (+13%) | 10mo | $210,000 | $189 | 52 |
| 1137 Franklin St | 0.36mi | 2/1.0 (-1) | 868 (-12%) | 10mo | $110,000 | $127 | 50 |
| 18451 County Route 162 | 0.63mi | 3/1.0 | 1,065 (+8%) | 19mo | $218,450 | $205 | 42 |
| 137 Barben Ave | 0.66mi | 2/2.0 (-1) | 1,043 (+6%) | 16mo | $169,300 | $162 | 38 |
| 1366 Washington St | 0.73mi | 2/1.5 (-1) | 1,107 (+12%) | 5mo | $191,000 | $173 | 35 |
| 1106 Harrison St | 0.55mi | 2/1.5 (-1) | 1,124 (+14%) | 15mo | $210,000 | $187 | 32 |
Match score weights: distance 35% · size 25% · config 20% · recency 20%. Top-matched comps best support the ARV.
Projected returns pro-forma
-3.0% appreciation · 8.0% rent growth · sell at horizon
- IRR
- 61.1%
- Equity multiple
- 3.95×
- Total profit
- $42,893
- Equity at exit
- $7,753
- IRR
- 67.5%
- Equity multiple
- 9.78×
- Total profit
- $127,844
- Equity at exit
- $4,496
Cash invested: $14,560 (down + closing). Projections, not guarantees.
Landlord ↔ Tenant lean methodology
- Overall (STATE)
- 15 Strongly Tenant-Friendly
- State New York
- 15 Strongly Tenant-Friendly · D+10
- County
- — inherits STATE
- City
- — inherits STATE
ZIP-level market 13601
- Home prices YoY
- -5.6%
- Rents YoY
- 10.0%
- Active inventory
- 223
- Price-to-rent
- 3.1×
Monthly cashflow live
- Estimated rent
- $1,406 high interval (Pro) →
- Mortgage (P&I)
- −$273
- Tax from tax record
- −$128 /mo · $1,535/yr
- Insurance
- −$22
- HOA
- −$0
- Vacancy / Maint / Mgmt
- −$295
- Net cashflow
- $688
Break-even live
UW: 25.0% down · 7.5% · 30yr · 1.5% tax · 5.0% vac · 8.0% maint · 8.0% mgmt
Financing live
Cash to close
- Down payment
- $13,000
- Closing costs
- $1,560
- Reserves months
- —
- Total cash needed
- —
Loan-product check · same deal, 3 products live
Conventional
25% down · 7.5% · 30yr
- Down + closing
- —
- Monthly P&I
- —
- Monthly cashflow
- —
- DSCR
- —
- Eligible?
- —
Personal DTI + credit; lowest rate.
DSCR
20% down · 8.5% · 30yr
- Down + closing
- —
- Monthly P&I
- —
- Monthly cashflow
- —
- DSCR
- —
- Eligible?
- —
No personal income docs; deal must DSCR.
Hard money
10% down · 12.0% · 12mo
- Down + closing
- —
- Monthly P&I
- —
- Monthly cashflow
- —
- DSCR
- —
- Eligible?
- —
Short-term bridge; refi at stabilization.
Rent comps 8 comps
| Address | Beds | Baths | Sqft | Rent | $/sqft | DOM | Units | Dist |
|---|---|---|---|---|---|---|---|---|
| 816 Boyd St Unit 1 Watertown, NY | 2.0 | 1.0 | 980 | $1,500 | $1.53 | 44d | 1 | 0.62mi |
| 927 State St Watertown, NY | 2.0 | 1.0 | 900 | $1,000 | $1.11 | 44d | 1 | 0.74mi |
| 159 Mullin St Unit 2 Watertown, NY | 2.0 | 1.0 | 900 | $1,200 | $1.33 | 44d | 1 | 0.85mi |
| 311 High St Watertown, NY | 2.0 | 1.0 | 851 | $1,200 | $1.41 | 44d | 1 | 1.01mi |
| 2240 Kristina Park Watertown, NY | 1.0–3.0 | 1.0–2.0 | 1072 | $1,615 | $1.51 | 44d | 5 | 1.03mi |
| 256 Michigan Ave Watertown, NY | 2.0–4.0 | 1.0–2.5 | 1435 | $1,440 | $1.00 | 44d | 9 | 1.22mi |
| 1815 Olmstead Dr Watertown, NY | 2.0–4.0 | 1.0–2.0 | 1380 | $1,462 | $1.06 | 44d | 6 | 1.28mi |
| 136 N Meadow St Unit A Watertown, NY | 2.0 | 1.0 | 1000 | $995 | $0.99 | 44d | 1 | 1.36mi |
Listing history 3 events
-
2026-04-15status Pending
-
2026-04-08historical Active Under Contract
-
2026-04-01$52,000 Active
ⓘ Source: listings_history table (triggers on properties + properties_extension) + one-shot
backfill from property_details.listing_events for pre-trigger history.
Tax reassessment forecast NY · Partial reset (capped growth)
- Current annual tax
- $1,535 · $128/mo
- Projected year-2 tax
- $1,535 · $128/mo
- Expected delta
- $0/yr ($0/mo · 0.0%)
ⓘ Screening estimate from a state-policy table — verify with the county assessor before closing.
Climate risk First Street
- Flood 1/10 Low FEMA zone X · 0% chance over 30 yrs
- Wildfire 2/10 Low
- Heat 2/10 Low 7 d/yr ≥91°F today · 15 d/yr by 30 yrs out
- Wind 1/10 Low 0% chance of damaging wind over 30 yrs
- Air quality 2/10 Low 1 unhealthy d/yr today · 1 by 30 yrs out
Nearby sold comps map
Loading sold comps map…
Walkable amenities ~0.75 mi
Loading nearby amenities…
Taxation est. · year 1
- Rental income
- $16,868
- − Mortgage interest
- −$2,913
- − Property taxes
- −$1,535
- − Insurance
- −$260
- − Repairs & maintenance
- −$1,349
- − Management
- −$1,349
- − Depreciation
- −$1,513
- Taxable income
- $7,948
- Est. tax owed @ 24.0%
- −$1,908
- After-tax cash flow
- $6,351/yr
For passive investors: Depreciation is non-cash, so a rental often shows a tax loss while cash-flowing — sheltering income. Rental losses are passive: they offset passive income freely, and up to $25,000/yr can offset ordinary (W-2) income if you actively participate and your MAGI is under $100k (phasing out to $0 by $150k); unused losses carry forward. On sale, claimed depreciation is recaptured at up to 25%, and gains may owe capital-gains tax (a 1031 exchange can defer both). Figures are a year-1 estimate at your 24.0% rate — not tax advice; consult a CPA.
Schools (NCES district)
- District
- Watertown City School District
- NCES district ID
- 3630120
- Math proficiency
- 34% ▼ -10.00%
- Reading proficiency
- 54% ▲ 12.00%
- Median HH income
- $40,919
- Composite
- 36.86/100
- National rank
- #4551
- State rank
- #481 of 590 in NY
Livability — Watertown
- Score
- 68/100
- State rank
- #540
- US rank
- #9700
Category grades
Schools grade is shown separately in the Schools card above.
Census & demographics
- Census place
- Watertown, NY
- County
- Jefferson County · 47,417 people
- City population
- 36,839
- Metro
- Watertown-Fort Drum, NY
- Population (ZIP)
- 36,839
- Household income
- $58,791
- Rent vs Own
- Severe rent burden
- 1634.0
Population outlook (Jefferson County) Hauer SSP2
- Today (2025)
- 111,748 people
- By 2030
- 109,370 · -2.1%
- By 2040
- 103,828 · -7.1%
- By 2050
- 98,523 · -11.8%
- By 2075
- 91,422 · -18.2%
- By 2100
- 78,214 · -30.0%
Race, ethnicity, and origin ACS 2023
- Neighborhood character
- Predominantly White (82%)
- Race & ethnicity
- White 82% Two or more races 7% Hispanic / Latino 6% Black 4% Asian 2%
- Hispanic origin (detail)
- Mexican 2% Puerto Rican 2%
- Common ancestry
- Lithuanian 7% Romanian 3% Slovak 2%
- Foreign-born
- 4% · Canada
- Languages at home
- 94% English-only · Spanish 3% Other Indo-European 1% German/W. Germanic 1%
Political lean MEDSL · Jefferson
- 2024 margin
- Strong R (+23.6) · D 38.2% · R 61.8%
- 2008→2024 swing
- -18.3pp toward R · 2008: -5.3pp · 2024: -23.6pp
- All cycles
- 2024: R+23.6 2020: R+19.0 2016: R+22.4 2012: R+2.9 2008: R+5.3
Not yet ingested
- Civics
- —
Market trends
- HPI YoY
- ▼ -18.86%
- Current HPI
- 316.636
- Rent YoY
- ▲ 9.96%
- Metro
- Watertown-Fort Drum, NY
- State GDP YoY
- ▲ 2.60%
- F500 in state
- 92
Industry mix (Fortune 500 HQ in NY)
| Industry | F500 HQs | Revenue |
|---|---|---|
| Financial Services | 10 | $950B |
|
||
| Consumer Goods | 9 | $162B |
|
||
| Insurance | 4 | $225B |
|
||
| Telecommunications | 2 | $144B |
|
||
| Pharmaceuticals | 2 | $112B |
|
||
| Media / Entertainment | 2 | $69B |
|
||
Price history
3 events — show timeline
- 2026-04-15 Pending — CNYIS
- 2026-04-08 Contingent — CNYIS
- 2026-04-01 Listed $52,000 CNYIS
Property tax history
+21.7%/yrLatest (2025): $1,535 · +2.0% YoY. Source: county tax records.
Cash-flow waterfall
monthlySold comps — $/sqft
last 12 mo · ≤1 miLoading sold comps…