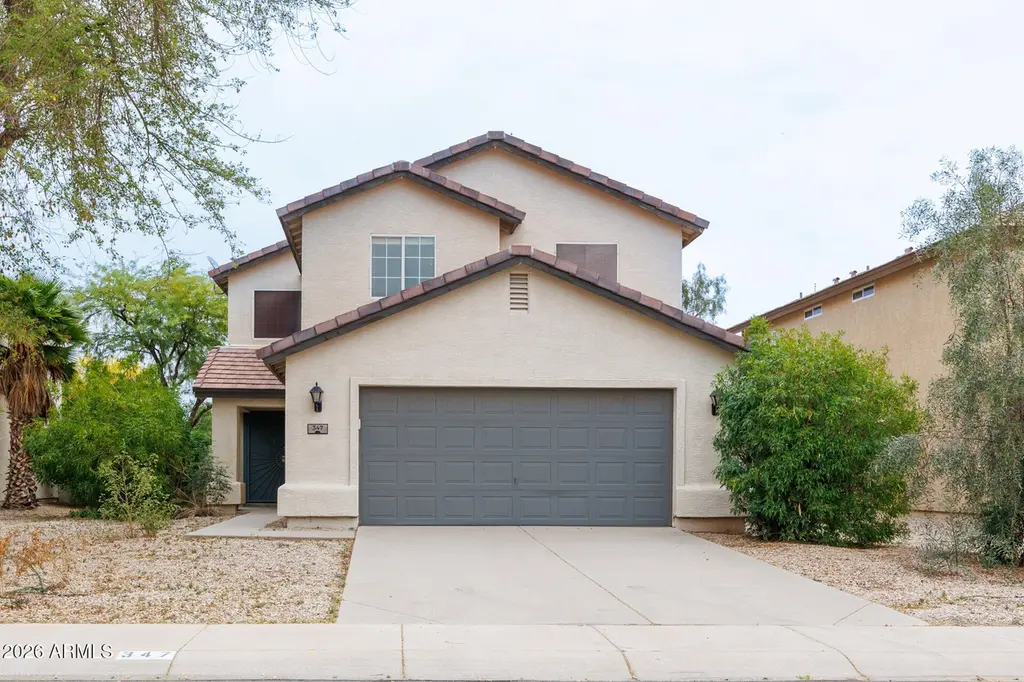
347 S 16th St · Coolidge, AZ
Flood risk 1/10 · Minimal
- FEMA flood zone
- X (unshaded)
- Chance of flooding over 30 yrs
- 0.0%
- Est. flood insurance / yr
- $507 – $1,088
Fire risk 6/10 · Moderate
- Est. fire insurance / yr
- $610 – $1,132
Heat risk 9/10 · Severe
- Hot days now (above 113°F)
- 7 days/yr
- Hot days in 30 yrs
- 19 days/yr
Wind risk 1/10 · Minimal
- Chance of severe wind over 30 yrs
- —
Air-quality risk 1/10 · Minimal
- Unhealthy air days now
- 0 days/yr
- Unhealthy air days in 30 yrs
- 0 days/yr
Risk factors via First Street. Map © Google.
Why this score? — see what drove the D- grade
The composite is a weighted blend of 9 inputs, each scored 0–100. Each bar is that input's sub-score; the figure is the points it added to the 100-point composite (weight × sub-score).
- ARV discount +15.0/15.0
- Cash flow +10.4/30.0
- DSCR +3.0/10.0
- Livability +2.9/5.0
- Rent growth +2.7/5.0
- Condition / age +2.5/5.0
- 1% rule +2.3/10.0
- Schools +1.0/10.0
- Appreciation +0.0/10.0
$265,500
🖨 Deal sheet 📄 Offer letter ✓ Due diligence
Listing remarks MLS
This HUD Home features 4 bedrooms and 3 bathrooms with a spacious, functional layout and excellent potential. The OPEN CONCEPT KITCHEN and LIVING ROOM create a seamless flow, while GENEROUS LIVING AREAS provide ample space for. ENTERTAINING and EVERYDAY LIVING. A FULL BEDROOM AND BATH DOWNSTAIRS offers ideal NEXT GEN LIVING OPTIONS, perfect for guests, multigenerational living, or added privacy. Enjoy the neighborhood parks in HEARTLAND RANCH and the added bonus of this home BACKING A COMMUNITY WALKING PATH.
Key facts
- Open-concept kitchen
- Ample space
- 5,866 sq ft lot
Tags
Neighborhood map
What this means for you Summary
Snapshot
- This is a 4-bed/3.0-bath single-family listed at $266k.
Deal economics
- At list price, monthly cash flow is $-140 ($-2k/yr) — negative.
- To cash-flow at today's rent, offer at most $241k (9.3% below list).
- To meet the 1% rule (rent ≥ 1% of price), the offer needs to be $195k (26.7% below list).
- Recommended offer: $195k (26.7% below list) — sets the bar for 1% rule.
- Cap rate 5.7% vs local median 4.5% in Coolidge — meaningfully above typical; check what's discounted (condition, days-on-market, listing class) to confirm the premium yield is real.
Location & tenants
- Location reads 57/100 on livability (#235 in AZ) — a working-class tenant base; expect higher turnover. Strengths: cost of living A+, housing A+; Watch: employment D, schools F, amenities F.
- Coolidge Unified District (4442) (town): math 8% / reading 14% proficiency, ranked #229 of 249 in AZ (top 92%) — low school quality limits family demand, transient renter base, plan for 1-2y turnover; 68% free/reduced lunch — lower-income household profile, screen leases tightly.
- Market conditions: Rents flat; 260 active listings in the ZIP; 20 comparable units currently listed for rent nearby; rentals lingering (median 44d on market — plan ~5-8 weeks vacancy on turnover, expect pricing pressure); 65% of comp listings sitting > 30 days — soft ceiling on asking rent; 9,504 units permitted in Pinal County in 2024 (776 in 5+ unit buildings).
- This rent runs 36% of the median local income ($65k/yr) — at the standard rent-burdened threshold; future hikes will face affordability resistance.
Forward outlook
- Local home prices are declining (-3.0%/yr); year-one equity from $2k of loan paydown is wiped out by about $8k of value loss. Plan a longer hold.
Negotiation context
- It's been on market 68 days — a 6% lower offer ($250k) is reasonable based on typical stale-listing flexibility.
- 6 sale attempts since 9y ago; this cycle's ask has dropped $30k (10%) from the opening price — seller is motivated, your offer sets the floor, not the list.
Risks & watch-outs
- Climate carrying-cost: major wildfire risk; extreme-heat days projected 7→19/yr by 2055 (HVAC capex compounding) — expect insurance premiums to compound above CPI over the hold.
Questions for the listing agent
- What do current leases actually rent for vs. the listed asking? Can we see a recent rent roll and the last 12 months of T-12 income?
- It's been on market 68 days. Have you received any prior offers? Is the seller open to a 27% concession, seller financing, or rate buy-down credit?
- What does the HOA fee cover, when was the last increase, and are there any pending special assessments or reserve-fund shortfalls?
- Why hasn't it sold? Are there any deal-killer items the seller is aware of (foundation, flood, title, zoning, code violations)?
- Is there a deadline driving the sale (1031 exchange, divorce, estate, relocation)? That informs how much negotiation room exists.
- Schools are F-rated, which usually means shorter tenancies and higher turnover. Who's the typical renter profile here, and what's been the actual vacancy rate?
- The area grade is low — what's the realistic commute time and amenity access for the typical tenant pool here? Any planned neighborhood developments (good or bad) we should know about?
- What's the average days-on-market for RENTAL listings here right now (not sales)? A rising rental-DOM trend means longer vacancies and softer asking-rent achievability than the comps imply.
- What's the recent tenant-quality profile in this submarket — average credit score on applications, eviction rate, late-payment / NSF rate, and stable-employment percentage? A property-management company in the area should have these aggregated.
- How much new for-sale + rental construction is in the pipeline within 1–3 miles? Heavy new supply typically softens prices + rents 12–24 months out; constrained supply supports both.
Investment metrics
- 1% rule
- 0.73% ✗
- Cap rate
- 5.66%
- Cash-on-cash
- -2.26%
- DSCR
- 0.90
- GRM
- 11.4
CMA / ARV
- ARV (median comp)
- $321,565
- List price
- $265,500
- Delta
- -17.44%
- Verdict
- UNDERPRICED
- Comps
- 20 within 1.0 mi
Show comp detail 12 sales within ~0.75 mi
| Address | Dist | Beds/Ba | Sqft | Sold | Price | $/sf | Match |
|---|---|---|---|---|---|---|---|
| 1707 W Harding Ave | 0.15mi | 4/3.0 | 2,301 (0%) | 2mo | $310,000 | $135 | 91 |
| 1629 W Wilson Ave | 0.10mi | 4/3.0 | 2,337 (+2%) | 8mo | $292,500 | $125 | 86 |
| 166 S 18th St | 0.28mi | 4/3.0 | 2,337 (+2%) | 2mo | $275,000 | $118 | 83 |
| 2119 W Central Ave | 0.45mi | 4/2.5 | 2,288 (-0%) | 4mo | $287,500 | $126 | 73 |
| 2113 W Central Ave | 0.44mi | 4/3.0 | 2,288 (-0%) | 7mo | $300,000 | $131 | 72 |
| 161 S 21st St | 0.37mi | 5/2.5 (+1) | 2,287 (-1%) | 4mo | $299,000 | $131 | 71 |
| 113 S 21st St | 0.39mi | 5/2.5 (+1) | 2,288 (-0%) | 6mo | $317,000 | $139 | 69 |
| 1744 W Pinkley Ave | 0.42mi | 4/2.0 | 2,151 (-6%) | 2mo | $289,999 | $135 | 64 |
| 2252 W Broadway Ave | 0.66mi | 5/2.5 (+1) | 2,288 (-0%) | 8mo | $249,000 | $109 | 54 |
| 544 N 14th Dr | 0.50mi | 5/3.0 (+1) | 2,076 (-10%) | 3mo | $368,470 | $177 | 53 |
| 2003 W Pinkley Ave | 0.48mi | 4/2.0 | 2,034 (-12%) | 6mo | $280,000 | $138 | 49 |
| 1408 W Bealey Ave | 0.63mi | 5/3.0 (+1) | 2,076 (-10%) | 4mo | $359,990 | $173 | 46 |
Match score weights: distance 35% · size 25% · config 20% · recency 20%. Top-matched comps best support the ARV.
Projected returns pro-forma
-3.0% appreciation · 0.97% rent growth · sell at horizon
- IRR
- -22.2%
- Equity multiple
- 0.25×
- Total profit
- $-55,915
- Equity at exit
- $39,587
- IRR
- -21.6%
- Equity multiple
- -0.02×
- Total profit
- $-75,811
- Equity at exit
- $22,956
Cash invested: $74,340 (down + closing). Projections, not guarantees.
Landlord ↔ Tenant lean methodology
- Overall (STATE)
- 87 Strongly Landlord-Friendly
- State Arizona
- 87 Strongly Landlord-Friendly · R+3
- County
- — inherits STATE
- City
- — inherits STATE
ZIP-level market 85128
- Home prices YoY
- -7.9%
- Rents YoY
- 1.0%
- Active inventory
- 260
- Price-to-rent
- 11.4×
Monthly cashflow live
- Estimated rent
- $1,946 high interval (Pro) →
- Mortgage (P&I)
- −$1,392
- Tax from tax record
- −$120 /mo · $1,438/yr
- Insurance
- −$111
- HOA
- −$55
- Vacancy / Maint / Mgmt
- −$409
- Net cashflow
- $-140
Break-even live
UW: 25.0% down · 7.5% · 30yr · 1.5% tax · 5.0% vac · 8.0% maint · 8.0% mgmt
Financing live
Cash to close
- Down payment
- $66,375
- Closing costs
- $7,965
- Reserves months
- —
- Total cash needed
- —
Loan-product check · same deal, 3 products live
Conventional
25% down · 7.5% · 30yr
- Down + closing
- —
- Monthly P&I
- —
- Monthly cashflow
- —
- DSCR
- —
- Eligible?
- —
Personal DTI + credit; lowest rate.
DSCR
20% down · 8.5% · 30yr
- Down + closing
- —
- Monthly P&I
- —
- Monthly cashflow
- —
- DSCR
- —
- Eligible?
- —
No personal income docs; deal must DSCR.
Hard money
10% down · 12.0% · 12mo
- Down + closing
- —
- Monthly P&I
- —
- Monthly cashflow
- —
- DSCR
- —
- Eligible?
- —
Short-term bridge; refi at stabilization.
Rent comps 20 comps
| Address | Beds | Baths | Sqft | Rent | $/sqft | DOM | Units | Dist |
|---|---|---|---|---|---|---|---|---|
| 1605 W Central Ave Coolidge, AZ | 4.0 | 2.0 | 1903 | $1,749 | $0.92 | 43d | 1 | 0.22mi |
| 1633 W Pinkley Ct Coolidge, AZ | 4.0 | 2.0 | 1906 | $1,800 | $0.94 | 43d | 1 | 0.29mi |
| 1286 W Roosevelt Ave Coolidge, AZ | 4.0 | 2.0 | 1604 | $1,649 | $1.03 | 20d | 1 | 0.34mi |
| 110 N Cholla Coolidge, AZ | 5.0 | 3.0 | 3132 | $2,000 | $0.64 | 15d | 1 | 0.36mi |
| 1366 W Pinkley Way Coolidge, AZ | 4.0 | 2.0 | 1907 | $2,050 | $1.07 | 21d | 1 | 0.42mi |
| 1206 W Prior Ave Coolidge, AZ | 4.0 | 2.0 | 1938 | $1,795 | $0.93 | 43d | 1 | 0.42mi |
| 1209 W Seagoe Ave Coolidge, AZ | 4.0 | 2.0 | 1608 | $1,695 | $1.05 | 43d | 1 | 0.45mi |
| 1304 W Byrd Ave Coolidge, AZ | 4.0 | 2.0 | 1775 | $1,725 | $0.97 | 24d | 1 | 0.59mi |
| 1304 W Byrd Ave Coolidge, AZ | 4.0 | 2.0 | 1775 | $1,725 | $0.97 | 20d | 1 | 0.59mi |
| 2234 W Central Ave Coolidge, AZ | 4.0 | 2.5 | 2011 | $1,765 | $0.88 | 43d | 1 | 0.61mi |
| 2233 W Broadway Ave Coolidge, AZ | 3.0 | 2.0 | 2288 | $1,790 | $0.78 | 5d | 1 | 0.63mi |
| 2233 W Broadway Ave Coolidge, AZ | 3.0 | 2.5 | 2288 | $1,735 | $0.76 | 43d | 1 | 0.63mi |
| 651 N 13th Pl Coolidge, AZ | 4.0 | 2.5 | 1858 | $2,300 | $1.24 | 5d | 1 | 0.66mi |
| 1330 W Hess Ave Coolidge, AZ | 4.0 | 2.0 | 1787 | $1,795 | $1.00 | 43d | 1 | 0.93mi |
| 1653 W Hopi Dr Coolidge, AZ | 3.0 | 2.0 | 1760 | $1,620 | $0.92 | 43d | 1 | 0.97mi |
| 1707 W Hopi Dr Coolidge, AZ | 3.0 | 2.0 | 1720 | $2,095 | $1.22 | 43d | 1 | 0.98mi |
| 1505 S Navajo Ln Coolidge, AZ | 3.0 | 2.5 | 1743 | $1,700 | $0.98 | 43d | 1 | 1.07mi |
| 1019 W Hess Ave Coolidge, AZ | 4.0 | 2.0 | 1590 | $1,700 | $1.07 | 43d | 1 | 1.09mi |
| 855 W Taylor Ave Coolidge, AZ | 5.0 | 3.0 | 2500 | $2,050 | $0.82 | 43d | 1 | 1.17mi |
| 611 W Verde Ln Coolidge, AZ | 3.0 | 2.0 | 1681 | $1,395 | $0.83 | 43d | 1 | 1.17mi |
HOA detail
- Monthly dues
- $55 · $660/yr
Listing history 36 events
-
2026-06-18days on market $265,500 Active 68 DOM
-
2026-06-17days on market $265,500 Active 67 DOM
-
2026-06-16days on market $265,500 Active 66 DOM
-
2026-06-15days on market $265,500 Active 65 DOM
-
2026-06-13days on market $265,500 Active 63 DOM
-
2026-06-13days on market $265,500 Active 62 DOM
-
2026-06-09days on market $265,500 Active 59 DOM
-
2026-06-08days on market $265,500 Active 58 DOM
-
2026-06-07days on market $265,500 Active 57 DOM
-
2026-06-04days on market $265,500 Active 54 DOM
-
2026-06-03days on market $265,500 Active 53 DOM
-
2026-06-02pricedays on market $265,500 Active 52 DOM
-
2026-06-01days on market $295,000 Active 51 DOM
-
2026-05-31days on market $295,000 Active 50 DOM
-
2026-04-11$295,000 Active 513-char remark
Show marketing remark (513 chars)
This HUD Home features 4 bedrooms and 3 bathrooms with a spacious, functional layout and excellent potential. The OPEN CONCEPT KITCHEN and LIVING ROOM create a seamless flow, while GENEROUS LIVING AREAS provide ample space for. ENTERTAINING and EVERYDAY LIVING. A FULL BEDROOM AND BATH DOWNSTAIRS offers ideal NEXT GEN LIVING OPTIONS, perfect for guests, multigenerational living, or added privacy. Enjoy the neighborhood parks in HEARTLAND RANCH and the added bonus of this home BACKING A COMMUNITY WALKING PATH.
-
2025-04-24historical
-
2025-04-09price $320,000
-
2025-01-07price $340,000
-
2024-12-31price $342,000
-
2024-12-23price $344,000
-
2024-12-16price $346,000
-
2024-12-09price $348,000
-
2024-11-04$350,000 Active
-
2021-11-23soldstatus $359,900 Closed
-
2021-11-23soldstatus $359,900
-
2021-10-23historical Under Contract Accepting Backups
-
2021-10-23status Active
-
2021-10-04historical Contract Contingent on Buyer Sale
-
2021-10-01$359,900 Active
-
2017-04-18soldstatus $149,900 Closed
-
2017-04-18soldstatus $149,000
-
2017-03-15historical Under Contract Accepting Backups
-
2017-03-10status Active
-
2017-02-27historical Under Contract Accepting Backups
-
2017-02-24$149,900 Active
-
2004-08-02soldstatus $61,650
ⓘ Source: listings_history table (triggers on properties + properties_extension) + one-shot
backfill from property_details.listing_events for pre-trigger history.
Tax reassessment forecast AZ · Resets to sale price
- Current annual tax
- $1,438 · $120/mo
- Projected year-2 tax
- $1,752 · $146/mo
- Expected delta
- +$314/yr (+$26/mo · 21.9%)
ⓘ Screening estimate from a state-policy table — verify with the county assessor before closing.
Climate risk First Street
- Flood 1/10 Low FEMA zone X (unshaded) · 0% chance over 30 yrs
- Wildfire 6/10 Major
- Heat 9/10 Extreme 7 d/yr ≥113°F today · 19 d/yr by 30 yrs out
- Wind 1/10 Low
- Air quality 1/10 Low 0 unhealthy d/yr today · 0 by 30 yrs out
Nearby sold comps map
Loading sold comps map…
Walkable amenities ~0.75 mi
Loading nearby amenities…
Taxation est. · year 1
- Rental income
- $23,356
- − Mortgage interest
- −$14,872
- − Property taxes
- −$1,438
- − Insurance
- −$1,328
- − Repairs & maintenance
- −$1,868
- − Management
- −$1,868
- − HOA
- −$660
- − Depreciation
- −$7,724
- Taxable loss
- −$6,403
- Est. tax savings @ 24.0%
- +$1,537
- After-tax cash flow
- $-146/yr
For passive investors: Depreciation is non-cash, so a rental often shows a tax loss while cash-flowing — sheltering income. Rental losses are passive: they offset passive income freely, and up to $25,000/yr can offset ordinary (W-2) income if you actively participate and your MAGI is under $100k (phasing out to $0 by $150k); unused losses carry forward. On sale, claimed depreciation is recaptured at up to 25%, and gains may owe capital-gains tax (a 1031 exchange can defer both). Figures are a year-1 estimate at your 24.0% rate — not tax advice; consult a CPA.
Schools (NCES district)
- District
- Coolidge Unified District (4442)
- NCES district ID
- 0402320
- Math proficiency
- 8% ▼ -6.00%
- Reading proficiency
- 14% ▼ -2.00%
- Median HH income
- $49,182
- Composite
- 10.35/100
- National rank
- #9787
- State rank
- #229 of 249 in AZ
Livability — Coolidge
- Score
- 57/100
- State rank
- #235
- US rank
- #22344
Category grades
Schools grade is shown separately in the Schools card above.
Census & demographics
- Census place
- Coolidge, AZ
- County
- Pinal County · 399,947 people
- City population
- 19,487
- Metro
- Phoenix-Mesa-Chandler, AZ
- Population (ZIP)
- 19,487
- Household income
- $65,477
- Rent vs Own
- Severe rent burden
- 264.0
Population outlook (Pinal County) Hauer SSP2
- Today (2025)
- 437,574 people
- By 2030
- 446,903 · +2.1%
- By 2040
- 452,589 · +3.4%
- By 2050
- 444,126 · +1.5%
- By 2075
- 430,300 · -1.7%
- By 2100
- 393,536 · -10.1%
Race, ethnicity, and origin ACS 2023
- Neighborhood character
- Diverse neighborhood (Simpson 0.64)
- Race & ethnicity
- Hispanic / Latino 52% White 29% Two or more races 22% Native American 17% Black 4%
- Hispanic origin (detail)
- Mexican 49%
- Common ancestry
- Lithuanian 1% Portuguese 1% Serbian 1%
- Foreign-born
- 9% · Canada
- Languages at home
- 71% English-only · Spanish 25% Other Indo-European 1%
Political lean MEDSL · Pinal
- 2024 margin
- Strong R (+22.1) · D 38.5% · R 60.6%
- 2008→2024 swing
- -7.6pp toward R · 2008: -14.5pp · 2024: -22.1pp
- All cycles
- 2024: R+22.1 2020: R+17.3 2016: R+19.3 2012: R+17.1 2008: R+14.5
Not yet ingested
- Civics
- —
Market trends
- HPI YoY
- ▼ -23.95%
- Current HPI
- 280.3422
- Rent YoY
- ▲ 0.97%
- Metro
- Phoenix-Mesa-Chandler, AZ
- State GDP YoY
- ▲ 4.54%
- F500 in state
- 20
Industry mix (Fortune 500 HQ in AZ)
| Industry | F500 HQs | Revenue |
|---|---|---|
| Technology | 2 | $13B |
|
||
| Mining / Metals | 1 | $23B |
|
||
| Environmental Services | 1 | $16B |
|
||
| Metals / Steel | 1 | $14B |
|
||
| Technology Distribution | 1 | $9B |
|
||
| Homebuilding | 1 | $8B |
|
||
Price history
+378.5% since first listed22 events — show timeline
- 2026-04-11 Listed $295,000 ARMLS
- 2025-04-24 Listing Removed — ARMLS
- 2025-04-09 Price Changed $320,000 ARMLS
- 2025-01-07 Price Changed $340,000 ARMLS
- 2024-12-31 Price Changed $342,000 ARMLS
- 2024-12-23 Price Changed $344,000 ARMLS
- 2024-12-16 Price Changed $346,000 ARMLS
- 2024-12-09 Price Changed $348,000 ARMLS
- 2024-11-04 Listed $350,000 ARMLS
- 2021-11-23 Sold (Public Records) $359,900 Public Records
- 2021-11-23 Sold (MLS) $359,900 ARMLS
- 2021-10-23 Contingent — ARMLS
- 2021-10-23 Relisted — ARMLS
- 2021-10-04 Contingent — ARMLS
- 2021-10-01 Listed $359,900 ARMLS
- 2017-04-18 Sold (Public Records) $149,000 Public Records
- 2017-04-18 Sold (MLS) $149,900 ARMLS
- 2017-03-15 Contingent — ARMLS
- 2017-03-10 Relisted — ARMLS
- 2017-02-27 Contingent — ARMLS
- 2017-02-24 Listed $149,900 ARMLS
- 2004-08-02 Sold (Public Records) $61,650 Public Records
Property tax history
+0.1%/yrLatest (2025): $1,438 · +5.3% YoY. Source: county tax records.
Cash-flow waterfall
monthlySold comps — $/sqft
last 12 mo · ≤1 miLoading sold comps…