8430 15th Pl SE #13 · Lake Stevens, WA
Flood risk No data
- FEMA flood zone
- —
- Chance of flooding over 30 yrs
- —
- Est. flood insurance / yr
- —
Fire risk No data
- Est. fire insurance / yr
- —
Heat risk No data
- Hot days now (above threshold)
- —
- Hot days in 30 yrs
- —
Wind risk No data
- Chance of severe wind over 30 yrs
- —
Air-quality risk No data
- Unhealthy air days now
- —
- Unhealthy air days in 30 yrs
- —
Risk factors via First Street. Map © Google.
Why this score? — see what drove the A- grade
The composite is a weighted blend of 9 inputs, each scored 0–100. Each bar is that input's sub-score; the figure is the points it added to the 100-point composite (weight × sub-score).
- Cash flow +30.0/30.0
- ARV discount +15.0/15.0
- 1% rule +10.0/10.0
- DSCR +10.0/10.0
- Schools +5.8/10.0
- Livability +4.2/5.0
- Rent growth +2.5/5.0
- Condition / age +2.5/5.0
- Appreciation +0.0/10.0
$105,000
🖨 Deal sheet 📄 Offer letter ✓ Due diligence
Listing remarks
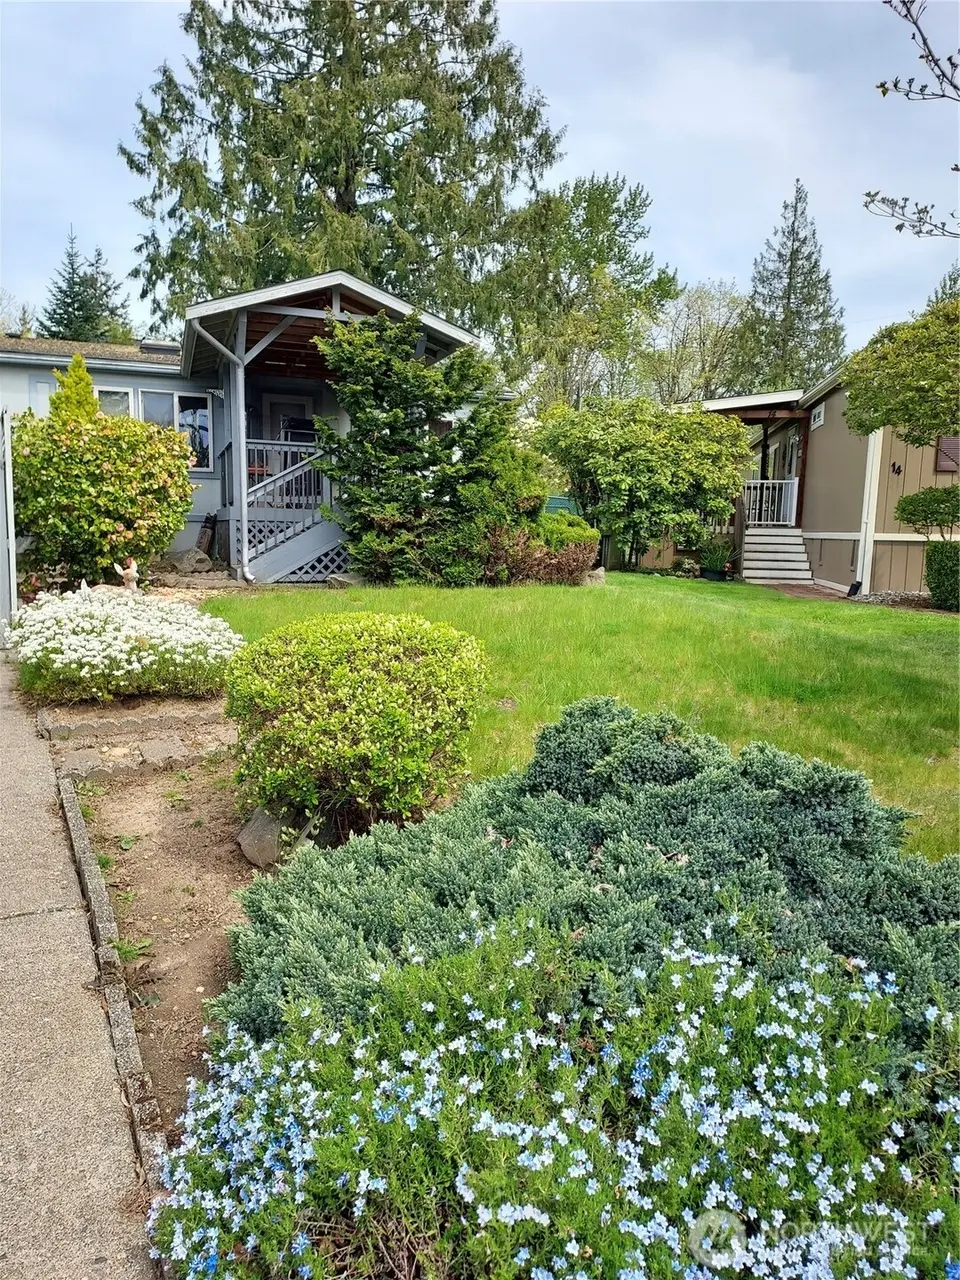
Welcome to the highly sought-after Premier 55+ Cardinal Estates Park! This charming home offers just under 1,100 square feet of comfortable living space, featuring 3 bedrooms and 2 full bathrooms. The spacious primary suite easily accommodates a king-size bed and includes a walk-in closet. Enjoy the large sunroom off the kitchen, complete with separate heat for year-round enjoyment and direct access to the private backyard. The open living room flows into a generous kitchen with ample cabinet and counter space. Additional features include a laundry room with storage, two separate storage areas, and plenty of parking. Accessibility is enhanced with a convenient ramp leading to the sunroom. R
Key facts
- Large sunroom
- Private back yard
- Rv storage on site
Tags
Property features AI
Finance
- Other: Property condition: Fair
- Financial info: Listing terms: Cash; Land lease: $1,102
- HOA & community: Located in Cardinal Estates manufactured home park; Park has 99 homes; Park amenities include common area and RV parking; Park approved for sale; Senior community
Exterior
- Parking: Carport
- Utilities: Electric energy source; Public water (PUD); Public power (PUD); Lake Stevens sewer; Electric water heater
- Home design: Manufactured double-wide home (Model: 28x40, Make: Maro); One story; South-facing entry
- Construction: Wood construction; Composition roof; Wood skirt; Pillar/post/pier foundation; Manufactured home (double wide)
- Exterior features: Wood exterior products; Patio/porch/deck; Paved lot; Back yard/carport storage location; View
Interior
- Kitchen: Dishwasher; Microwave; Refrigerator; Stove/Range
- Bedrooms: 3 bedrooms
- Flooring: Vinyl; Carpet
- Bathrooms: 2 full bathrooms (includes 2 bathtubs and 2 showers)
- Heating & cooling: Forced air heating; Wall furnace
- Interior features: Water heater (located in primary closet); Ceiling fans; Double pane windows; Skylights; Vaulted ceilings; Walk-in closet; Bath off primary
- Laundry & utility: Washer; Dryer
Neighborhood map
What this means for you Summary
Snapshot
- This is a 2-bed/2.0-bath manufactured listed at $105k.
Deal economics
- At list price, monthly cash flow is $1k ($13k/yr) — positive.
- The deal already cash-flows at list — no discount required.
- Meets the 1% rule at list price ($2k rent vs $105k).
- Recommended offer: $102k (3.0% below list) — sets the bar for market timing.
- Cap rate 18.8% vs local median 2.8% in Lake Stevens — top-decile yield for the area; either an underpriced asset or a hidden risk that comps aren't pricing in. Stress-test before assuming the spread holds.
Location & tenants
- Location reads 83/100 on livability (#51 in WA, #917 nationally) — a professional / high-income tenant draw. Strengths: crime A+, employment A+, housing A+; Watch: amenities C-, cost of living F.
- Lake Stevens School District (suburban): math 57% / reading 70% proficiency, ranked #31 of 291 in WA (top 11%) — acceptable for families but not a draw, mixed tenant base, ~2y average lease.
- Market conditions: Rents flat; 418 active listings in the ZIP; 3 comparable units currently listed for rent nearby; rentals leasing fast (median 4d on market — plan ~1-2 weeks tenant-placement turnaround); high-income renter base; 3,982 units permitted in Snohomish County in 2024 (1,492 in 5+ unit buildings).
Forward outlook
- Local home prices are declining (-3.0%/yr); year-one equity from $726 of loan paydown is wiped out by about $3k of value loss. Plan a longer hold.
- Snohomish County population projected at +30% by 2050 — long-run rental-demand tailwind backs the buy-and-hold thesis.
- At projected returns (-3.0% appreciation + 0.2% rent growth), your $29k cash investment doubles in ~3 years — after that, you're playing with house money.
Negotiation context
- It's been on market 46 days — a 3% lower offer ($102k) is reasonable based on typical stale-listing flexibility.
- 3 sale attempts since 14y ago; this cycle's ask has dropped $45k (30%) from the opening price — seller is motivated, your offer sets the floor, not the list.
- Current owner paid $46k; list at $105k implies a 126% gain — meaningful room to come down on a strong offer.
Questions for the listing agent
- It's been on market 46 days. Have you received any prior offers? Is the seller open to a 3% concession, seller financing, or rate buy-down credit?
- Is there a deadline driving the sale (1031 exchange, divorce, estate, relocation)? That informs how much negotiation room exists.
- Schools are B-rated — typically a magnet for longer-tenancy family renters. What's the average tenant stay here, and is there a school-zone premium baked into asking?
- What's the average days-on-market for RENTAL listings here right now (not sales)? A rising rental-DOM trend means longer vacancies and softer asking-rent achievability than the comps imply.
- What's the recent tenant-quality profile in this submarket — average credit score on applications, eviction rate, late-payment / NSF rate, and stable-employment percentage? A property-management company in the area should have these aggregated.
- How much new for-sale + rental construction is in the pipeline within 1–3 miles? Heavy new supply typically softens prices + rents 12–24 months out; constrained supply supports both.
Investment metrics
- 1% rule
- 2.14% ✓
- Cap rate
- 18.81%
- Cash-on-cash
- 44.69%
- DSCR
- 2.99
- GRM
- 3.9
CMA / ARV
- ARV (median comp)
- $137,360
- List price
- $105,000
- Delta
- -23.56%
- Verdict
- UNDERPRICED
- Comps
- 20 within 1.0 mi
Show comp detail 3 sales within ~0.75 mi
| Address | Dist | Beds/Ba | Sqft | Sold | Price | $/sf | Match |
|---|---|---|---|---|---|---|---|
| 1316 91st Ave SE #39 | 0.34mi | 2/1.0 | 960 (-11%) | 4mo | $113,000 | $118 | 58 |
| 1316 91st Ave SE #33 | 0.34mi | 3/2.0 (+1) | 924 (-14%) | 8mo | $70,000 | $76 | 48 |
| 1316 91st Ave SE #29 | 0.34mi | 3/2.0 (+1) | 1,188 (+10%) | 21mo | $201,000 | $169 | 45 |
Match score weights: distance 35% · size 25% · config 20% · recency 20%. Top-matched comps best support the ARV.
Projected returns pro-forma
-3.0% appreciation · 0.19% rent growth · sell at horizon
- IRR
- 38.6%
- Equity multiple
- 2.58×
- Total profit
- $46,555
- Equity at exit
- $15,656
- IRR
- 43.7%
- Equity multiple
- 4.62×
- Total profit
- $106,402
- Equity at exit
- $9,078
Cash invested: $29,400 (down + closing). Projections, not guarantees.
Landlord ↔ Tenant lean methodology
- Overall (STATE)
- 28 Tenant-Leaning
- State Washington
- 28 Tenant-Leaning · D+8
- County
- — inherits STATE
- City
- — inherits STATE
ZIP-level market 98258
- Rents YoY
- 0.2%
- Active inventory
- 418
- Price-to-rent
- 3.9×
Monthly cashflow live
- Estimated rent
- $2,246 medium interval (Pro) →
- Mortgage (P&I)
- −$551
- Tax from tax record
- −$85 /mo · $1,022/yr
- Insurance
- −$44
- HOA
- −$0
- Vacancy / Maint / Mgmt
- −$472
- Net cashflow
- $1,095
Break-even live
UW: 25.0% down · 7.5% · 30yr · 1.5% tax · 5.0% vac · 8.0% maint · 8.0% mgmt
Financing live
Cash to close
- Down payment
- $26,250
- Closing costs
- $3,150
- Reserves months
- —
- Total cash needed
- —
Loan-product check · same deal, 3 products live
Conventional
25% down · 7.5% · 30yr
- Down + closing
- —
- Monthly P&I
- —
- Monthly cashflow
- —
- DSCR
- —
- Eligible?
- —
Personal DTI + credit; lowest rate.
DSCR
20% down · 8.5% · 30yr
- Down + closing
- —
- Monthly P&I
- —
- Monthly cashflow
- —
- DSCR
- —
- Eligible?
- —
No personal income docs; deal must DSCR.
Hard money
10% down · 12.0% · 12mo
- Down + closing
- —
- Monthly P&I
- —
- Monthly cashflow
- —
- DSCR
- —
- Eligible?
- —
Short-term bridge; refi at stabilization.
Rent comps 3 comps
| Address | Beds | Baths | Sqft | Rent | $/sqft | DOM | Units | Dist |
|---|---|---|---|---|---|---|---|---|
| 7412 19th Pl SE Lake Stevens, WA | 3.0 | 2.0 | 1374 | $1,400 | $1.02 | 4d | 1 | 0.74mi |
| 10227 20th St SE Lake Stevens, WA | 1.0 | 1.0 | 720 | $1,992 | $2.76 | 1d | 7 | 0.99mi |
| 9504 Chapel Hill Rd Lake Stevens, WA | 3.0 | 2.5 | 1340 | $2,950 | $2.20 | 5d | 1 | 1.20mi |
Listing history 24 events
-
2026-06-18status $105,000 Pending 46 DOM
-
2026-06-17days on market $105,000 Active 46 DOM
-
2026-06-16days on market $105,000 Active 45 DOM
-
2026-06-15days on market $105,000 Active 44 DOM
-
2026-06-13days on market $105,000 Active 42 DOM
-
2026-06-13days on market $105,000 Active 41 DOM
-
2026-06-09days on market $105,000 Active 38 DOM
-
2026-06-08days on market $105,000 Active 37 DOM
-
2026-06-07pricedays on market $105,000 Active 36 DOM
-
2026-06-04days on market $120,000 Active 33 DOM
-
2026-06-03days on market $120,000 Active 32 DOM
-
2026-06-02days on market $120,000 Active 31 DOM
-
2026-06-01days on market $120,000 Active 30 DOM
-
2026-05-31days on market $120,000 Active 29 DOM
-
2026-05-12price $120,000
-
2026-05-02$150,000 Active
-
2015-04-07status Pending
-
2015-04-01status Pending Inspection
-
2015-03-23Active
-
2012-05-21historical
-
2012-05-21soldstatus $46,500 Sold
-
2012-05-04status Pending
-
2012-04-24status Pending Inspection
-
2012-04-17$46,500 Active
ⓘ Source: listings_history table (triggers on properties + properties_extension) + one-shot
backfill from property_details.listing_events for pre-trigger history.
Tax reassessment forecast WA · Resets to sale price
- Current annual tax
- $1,022 · $85/mo
- Projected year-2 tax
- $1,029 · $86/mo
- Expected delta
- +$8/yr (+$1/mo · 0.7%)
ⓘ Screening estimate from a state-policy table — verify with the county assessor before closing.
Nearby sold comps map
Loading sold comps map…
Walkable amenities ~0.75 mi
Loading nearby amenities…
Taxation est. · year 1
- Rental income
- $26,955
- − Mortgage interest
- −$5,882
- − Property taxes
- −$1,022
- − Insurance
- −$525
- − Repairs & maintenance
- −$2,156
- − Management
- −$2,156
- − Depreciation
- −$3,055
- Taxable income
- $12,159
- Est. tax owed @ 24.0%
- −$2,918
- After-tax cash flow
- $10,222/yr
For passive investors: Depreciation is non-cash, so a rental often shows a tax loss while cash-flowing — sheltering income. Rental losses are passive: they offset passive income freely, and up to $25,000/yr can offset ordinary (W-2) income if you actively participate and your MAGI is under $100k (phasing out to $0 by $150k); unused losses carry forward. On sale, claimed depreciation is recaptured at up to 25%, and gains may owe capital-gains tax (a 1031 exchange can defer both). Figures are a year-1 estimate at your 24.0% rate — not tax advice; consult a CPA.
Schools (NCES district)
- District
- Lake Stevens School District
- NCES district ID
- 5304200
- Math proficiency
- 57% ▼ -2.00%
- Reading proficiency
- 70% ▬ 0.00%
- Median HH income
- $78,301
- Composite
- 58.12/100
- National rank
- #2141
- State rank
- #31 of 291 in WA
Livability — Lake Stevens
- Score
- 83/100
- State rank
- #51
- US rank
- #917
Category grades
Schools grade is shown separately in the Schools card above.
Census & demographics
- Census place
- Lake Stevens, WA
- County
- Snohomish County · 786,756 people
- City population
- 52,752
- Metro
- Seattle-Tacoma-Bellevue, WA
- Population (ZIP)
- 52,752
- Household income
- $123,898
- Rent vs Own
- Severe rent burden
- 786.0
Population outlook (Snohomish County) Hauer SSP2
- Today (2025)
- 899,800 people
- By 2030
- 960,975 · +6.8%
- By 2040
- 1,074,447 · +19.4%
- By 2050
- 1,171,954 · +30.2%
- By 2075
- 1,384,849 · +53.9%
- By 2100
- 1,497,296 · +66.4%
Race, ethnicity, and origin ACS 2023
- Neighborhood character
- Predominantly White (73%)
- Race & ethnicity
- White 73% Hispanic / Latino 12% Two or more races 11% Asian 6% Black 2%
- Hispanic origin (detail)
- Mexican 7%
- Common ancestry
- Portuguese 7% Italian 3% Slovak 2%
- Foreign-born
- 10% · Canada, Vietnam, China
- Languages at home
- 87% English-only · Spanish 5% Russian/Polish/Slavic 2% Other Indo-European 1%
Political lean MEDSL · Snohomish
- 2024 margin
- D (+19.0) · D 57.8% · R 38.9% · Other 3.3%
- 2008→2024 swing
- +0.1pp no change · 2008: 18.9pp · 2024: 19.0pp
- All cycles
- 2024: D+19.0 2020: D+20.6 2016: D+16.6 2012: D+16.2 2008: D+18.9
Not yet ingested
- Civics
- —
Market trends
- HPI YoY
- ▼ -725.77%
- Current HPI
- 303.8934
- Rent YoY
- ▲ 0.19%
- Metro
- Seattle-Tacoma-Bellevue, WA
- State GDP YoY
- ▲ 4.65%
- F500 in state
- 22
Industry mix (Fortune 500 HQ in WA)
| Industry | F500 HQs | Revenue |
|---|---|---|
| Retail | 2 | $269B |
|
||
| Technology / Retail | 1 | $638B |
|
||
| Technology | 1 | $245B |
|
||
| Telecommunications | 1 | $38B |
|
||
| Food / Beverage | 1 | $36B |
|
||
| Automotive / Trucks | 1 | $34B |
|
||
Price history
+125.8% since first listed12 events — show timeline
- 2026-06-18 Pending — NWMLS as Distributed by MLS Grid
- 2026-06-05 Price Changed $105,000 NWMLS as Distributed by MLS Grid
- 2026-05-12 Price Changed $120,000 NWMLS as Distributed by MLS Grid
- 2026-05-02 Listed $150,000 NWMLS as Distributed by MLS Grid
- 2015-04-07 Pending — NWMLS as Distributed by MLS Grid
- 2015-04-01 Pending — NWMLS as Distributed by MLS Grid
- 2015-03-23 Listed — NWMLS as Distributed by MLS Grid
- 2012-05-21 Delisted — NWMLS as Distributed by MLS Grid
- 2012-05-21 Sold (MLS) $46,500 NWMLS as Distributed by MLS Grid
- 2012-05-04 Pending — NWMLS as Distributed by MLS Grid
- 2012-04-24 Pending — NWMLS as Distributed by MLS Grid
- 2012-04-17 Listed $46,500 NWMLS as Distributed by MLS Grid
Property tax history
+4.6%/yrLatest (2026): $1,022 · +6.4% YoY. Source: county tax records.
Cash-flow waterfall
monthlySold comps — $/sqft
last 12 mo · ≤1 miLoading sold comps…