509 Mountain View Rd · West End-Cobb Town, AL
Flood risk 1/10 · Minimal
- FEMA flood zone
- X (unshaded)
- Chance of flooding over 30 yrs
- 0.0%
- Est. flood insurance / yr
- $507 – $1,088
Fire risk 4/10 · Minor
- Est. fire insurance / yr
- $916 – $1,700
Heat risk 5/10 · Moderate
- Hot days now (above 105°F)
- 7 days/yr
- Hot days in 30 yrs
- 20 days/yr
Wind risk 6/10 · Moderate
- Chance of severe wind over 30 yrs
- 27.0%
Air-quality risk 2/10 · Minimal
- Unhealthy air days now
- 1 days/yr
- Unhealthy air days in 30 yrs
- 2 days/yr
Risk factors via First Street. Map © Google.
Why this score? — see what drove the D grade
The composite is a weighted blend of 9 inputs, each scored 0–100. Each bar is that input's sub-score; the figure is the points it added to the 100-point composite (weight × sub-score).
- Cash flow +15.0/30.0
- ARV discount +7.5/15.0
- 1% rule +5.0/10.0
- DSCR +5.0/10.0
- Schools +2.9/10.0
- Rent growth +2.5/5.0
- Livability +2.5/5.0
- Condition / age +2.5/5.0
- Appreciation +0.0/10.0
$15,000
🖨 Deal sheet 📄 Offer letter ✓ Due diligence
Listing remarks
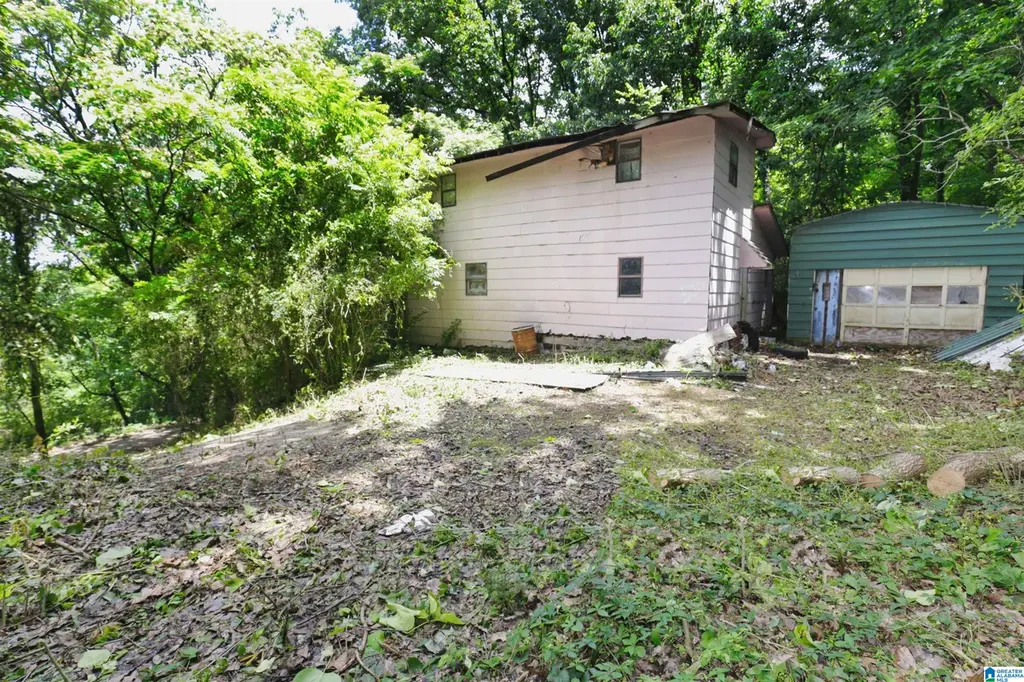
Investor opportunity! This handyman special is full of potential and ready for the right buyer to bring it back to life. Current layout includes 2 bedrooms and 1 full bath upstairs, along with a separate primary bedroom and bath on the main level for added privacy and flexibility. Situated on a wooded 0.27± acre lot, this property offers a peaceful setting while still being conveniently located close to town. Whether you’re an investor looking for your next project, a flipper, or a buyer wanting to customize a home to fit your vision, this property offers endless possibilities at an affordable price point. Property is being sold as-is. Use caution when entering and viewing the
Key facts
- Added privacy
- Wooded lot
- Conveniently located
Tags
Property features AI
Finance
- Other: Lot size approximately 0.27 acres; Subdivision: MOUNTAINVIEW
Exterior
- Parking: Driveway parking; Off-street parking
- Utilities: Public water; Septic system; Internet service available
- Home design: Existing construction; Tri-level: no; Split level: no; Split foyer: no
- Construction: Wood siding; Crawl space foundation
- Exterior features: Open deck; No pool; No patio; No garden/patio; Not waterfront
Interior
- Kitchen: Laminate countertops; Kitchen on main level
- Bedrooms: Master bedroom on main level; Two additional bedrooms on upper level
- Flooring: Subflooring
- Bathrooms: Two full bathrooms; Tub/shower combo
- Heating & cooling: No heat; No air conditioning
- Interior features: Handyman special; Attic present; Ceilings: other (see remarks); Subflooring
- Laundry & utility: Mud room on main level
Neighborhood map
What this means for you Summary
Snapshot
- This is a 3-bed/2.0-bath single-family listed at $15k.
Deal economics
- At list price, monthly cash flow is $920 ($11k/yr) — positive.
- The deal already cash-flows at list — no discount required.
- Meets the 1% rule at list price ($1k rent vs $15k).
Location & tenants
- Location reads: area grade D — affects rentability + tenant quality, not the cash-flow math above.
- Calhoun County (rural): math 19% / reading 49% proficiency, ranked #46 of 129 in AL (top 36%) — families likely to look elsewhere, expect single-tenant / working-renter base with shorter leases.
- Zoned schools: Wellborn Elementary School (math 20% / reading 39%, grade F, #367 of 627 statewide, top 60%, 582 students, 83% FRL); Wellborn High School (math 8% / reading 36%, grade F, #142 of 305 statewide, top 51%, 491 students, 81% FRL) — zoned schools average 82% FRL vs 49% district-wide (33 pts higher); higher-poverty schools than district average — tighter screening recommended.
- Market conditions: 73 active listings in the ZIP; 135 units permitted in Calhoun County in 2024 (0 in 5+ unit buildings).
Forward outlook
- Local home prices are declining (-3.0%/yr); year-one equity from $104 of loan paydown is wiped out by about $450 of value loss. Plan a longer hold.
- Calhoun County population projected at -21% by 2050 — secular population decline; favor cash flow + early exit over multi-decade hold.
- At projected returns (-3.0% appreciation + 3.0% rent growth), your $4k cash investment doubles in ~1 year — after that, you're playing with house money.
Negotiation context
- Only 2 days on market — expect competitive offers; lowballing is unlikely to land.
Risks & watch-outs
- Climate carrying-cost: major wind risk, 27% chance of damaging wind over 30y; extreme-heat days projected 7→20/yr by 2055 (HVAC capex compounding) — expect insurance premiums to compound above CPI over the hold.
Questions for the listing agent
- Is there a deadline driving the sale (1031 exchange, divorce, estate, relocation)? That informs how much negotiation room exists.
- The area grade is low — what's the realistic commute time and amenity access for the typical tenant pool here? Any planned neighborhood developments (good or bad) we should know about?
- What's the average days-on-market for RENTAL listings here right now (not sales)? A rising rental-DOM trend means longer vacancies and softer asking-rent achievability than the comps imply.
- What's the recent tenant-quality profile in this submarket — average credit score on applications, eviction rate, late-payment / NSF rate, and stable-employment percentage? A property-management company in the area should have these aggregated.
- How much new for-sale + rental construction is in the pipeline within 1–3 miles? Heavy new supply typically softens prices + rents 12–24 months out; constrained supply supports both.
Investment metrics
- 1% rule
- 8.57% ✓
- Cap rate
- 79.90%
- Cash-on-cash
- 262.89%
- DSCR
- 12.70
- GRM
- 1.0
CMA / ARV
- ARV (on-the-fly)
- $141,120
- Comps found
- 3
Show comp detail 3 sales within ~0.75 mi
| Address | Dist | Beds/Ba | Sqft | Sold | Price | $/sf | Match |
|---|---|---|---|---|---|---|---|
| 2321 C St | 0.17mi | 3/2.0 | 1,381 (+10%) | 17mo | $155,000 | $112 | 61 |
| 602 Mountainview Rd | 0.04mi | 2/1.0 (-1) | 1,130 (-10%) | 22mo | $49,900 | $44 | 54 |
| 211 Corning St | 0.67mi | 2/2.0 (-1) | 1,216 (-4%) | 11mo | $155,000 | $127 | 49 |
Match score weights: distance 35% · size 25% · config 20% · recency 20%. Top-matched comps best support the ARV.
Projected returns pro-forma
-3.0% appreciation · 3.0% rent growth · sell at horizon
- IRR
- —
- Equity multiple
- 14.38×
- Total profit
- $56,186
- Equity at exit
- $2,237
- IRR
- —
- Equity multiple
- 30.63×
- Total profit
- $124,444
- Equity at exit
- $1,297
Cash invested: $4,200 (down + closing). Projections, not guarantees.
Landlord ↔ Tenant lean methodology
- Overall (STATE)
- 90 Strongly Landlord-Friendly
- State Alabama
- 90 Strongly Landlord-Friendly · R+15
- County
- — inherits STATE
- City
- — inherits STATE
ZIP-level market 36201
- Active inventory
- 73
- Price-to-rent
- 1.0×
Monthly cashflow live
- Estimated rent
- $1,286 medium interval (Pro) →
- Mortgage (P&I)
- −$79
- Tax from tax record
- −$11 /mo · $128/yr
- Insurance
- −$6
- HOA
- −$0
- Vacancy / Maint / Mgmt
- −$270
- Net cashflow
- $920
Break-even live
UW: 25.0% down · 7.5% · 30yr · 1.5% tax · 5.0% vac · 8.0% maint · 8.0% mgmt
Financing live
Cash to close
- Down payment
- $3,750
- Closing costs
- $450
- Reserves months
- —
- Total cash needed
- —
Loan-product check · same deal, 3 products live
Conventional
25% down · 7.5% · 30yr
- Down + closing
- —
- Monthly P&I
- —
- Monthly cashflow
- —
- DSCR
- —
- Eligible?
- —
Personal DTI + credit; lowest rate.
DSCR
20% down · 8.5% · 30yr
- Down + closing
- —
- Monthly P&I
- —
- Monthly cashflow
- —
- DSCR
- —
- Eligible?
- —
No personal income docs; deal must DSCR.
Hard money
10% down · 12.0% · 12mo
- Down + closing
- —
- Monthly P&I
- —
- Monthly cashflow
- —
- DSCR
- —
- Eligible?
- —
Short-term bridge; refi at stabilization.
Listing history 3 events
-
2026-06-07statusdays on market $15,000 Pending 2 DOM
-
2026-06-03remarks 686-char remark
-
2026-06-03$15,000 Active 1 DOM
ⓘ Source: listings_history table (triggers on properties + properties_extension) + one-shot
backfill from property_details.listing_events for pre-trigger history.
Tax reassessment forecast AL · Resets to sale price
- Current annual tax
- $128 · $11/mo
- Projected year-2 tax
- $128 · $11/mo
- Expected delta
- $0/yr ($0/mo · 0.0%)
ⓘ Screening estimate from a state-policy table — verify with the county assessor before closing.
Climate risk First Street
- Flood 1/10 Low FEMA zone X (unshaded) · 0% chance over 30 yrs
- Wildfire 4/10 Moderate
- Heat 5/10 Major 7 d/yr ≥105°F today · 20 d/yr by 30 yrs out
- Wind 6/10 Major 27% chance of damaging wind over 30 yrs
- Air quality 2/10 Low 1 unhealthy d/yr today · 2 by 30 yrs out
Nearby sold comps map
Loading sold comps map…
Walkable amenities ~0.75 mi
Loading nearby amenities…
Taxation est. · year 1
- Rental income
- $15,428
- − Mortgage interest
- −$840
- − Property taxes
- −$128
- − Insurance
- −$75
- − Repairs & maintenance
- −$1,234
- − Management
- −$1,234
- − Depreciation
- −$436
- Taxable income
- $11,480
- Est. tax owed @ 24.0%
- −$2,755
- After-tax cash flow
- $8,286/yr
For passive investors: Depreciation is non-cash, so a rental often shows a tax loss while cash-flowing — sheltering income. Rental losses are passive: they offset passive income freely, and up to $25,000/yr can offset ordinary (W-2) income if you actively participate and your MAGI is under $100k (phasing out to $0 by $150k); unused losses carry forward. On sale, claimed depreciation is recaptured at up to 25%, and gains may owe capital-gains tax (a 1031 exchange can defer both). Figures are a year-1 estimate at your 24.0% rate — not tax advice; consult a CPA.
Schools (NCES district)
- District
- Calhoun County
- NCES district ID
- 0100540
- Math proficiency
- 19% ▼ -26.00%
- Reading proficiency
- 49% ▬ 0.00%
- Median HH income
- $44,891
- Composite
- 28.91/100
- National rank
- #6635
- State rank
- #46 of 129 in AL
Livability — West End-Cobb Town
No livability data for this city. (Only ~50 U.S. cities are tracked.)
Census & demographics
- Census place
- West End-Cobb Town, AL
- City population
- 17,406
- Population (ZIP)
- 17,406
Population outlook (Calhoun County) Hauer SSP2
- Today (2025)
- 109,765 people
- By 2030
- 105,708 · -3.7%
- By 2040
- 96,192 · -12.4%
- By 2050
- 86,413 · -21.3%
- By 2075
- 63,467 · -42.2%
- By 2100
- 44,704 · -59.3%
Race, ethnicity, and origin ACS 2023
- Neighborhood character
- Diverse neighborhood (Simpson 0.57)
- Race & ethnicity
- White 47% Black 46% Two or more races 5% Hispanic / Latino 3%
- Common ancestry
- Lithuanian 2% Slovak 1% Scandinavian 1%
- Foreign-born
- 2% · Canada
- Languages at home
- 98% English-only · Spanish 2%
Political lean MEDSL · Calhoun
- 2024 margin
- Solid R (+44.8) · D 27.2% · R 71.9%
- 2008→2024 swing
- -12.2pp toward R · 2008: -32.5pp · 2024: -44.8pp
- All cycles
- 2024: R+44.8 2020: R+39.0 2016: R+41.4 2012: R+31.9 2008: R+32.5
Not yet ingested
- Civics
- —
Market trends
- HPI YoY
- ▼ -78.92%
- Current HPI
- 59.1512
- Rent YoY
- —
- Metro
- —
- State GDP YoY
- ▲ 2.94%
- F500 in state
- 4
Industry mix (Fortune 500 HQ in AL)
| Industry | F500 HQs | Revenue |
|---|---|---|
| Financial Services | 1 | $8B |
|
||
| Healthcare | 1 | $5B |
|
||
Price history
1 event — show timeline
- 2026-06-03 Listed $15,000 Greater Alabama MLS
Property tax history
+1.0%/yrLatest (2025): $128 · -5.9% YoY. Source: county tax records.
Cash-flow waterfall
monthlySold comps — $/sqft
last 12 mo · ≤1 miLoading sold comps…