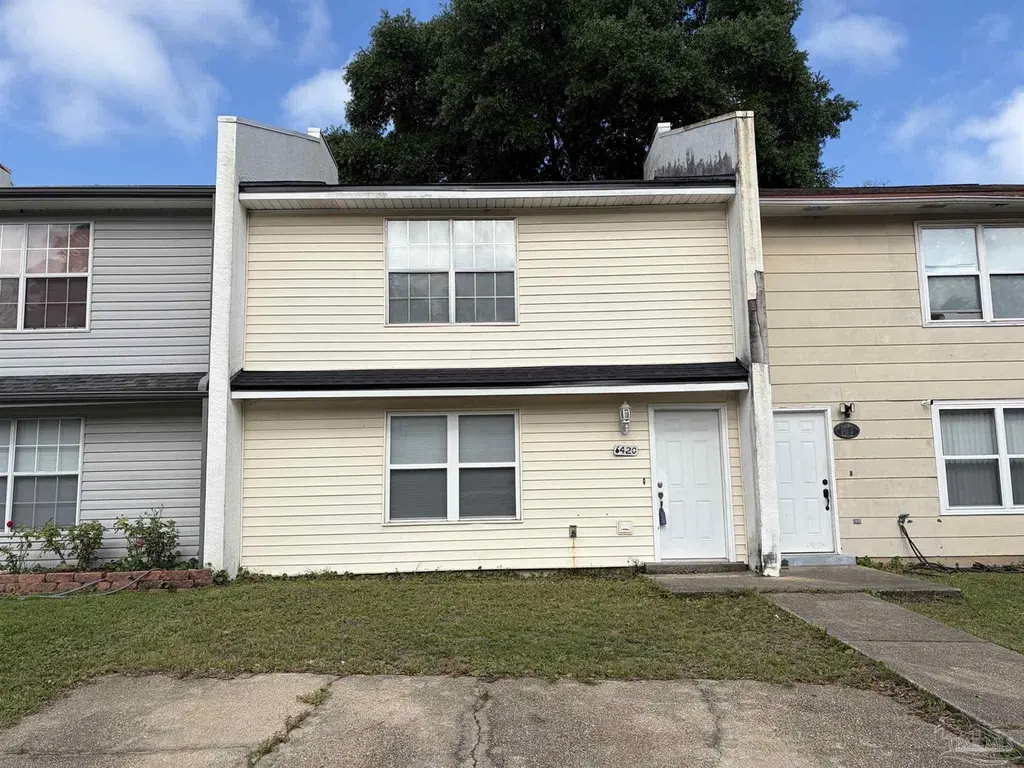
6420 Concord Way · Ferry Pass, FL
Flood risk 6/10 · Moderate
- FEMA flood zone
- X (unshaded)
- Chance of flooding over 30 yrs
- 0.72%
- Est. flood insurance / yr
- $507 – $1,088
Fire risk 1/10 · Minimal
- Est. fire insurance / yr
- $947 – $1,759
Heat risk 10/10 · Severe
- Hot days now (above 106°F)
- 7 days/yr
- Hot days in 30 yrs
- 23 days/yr
Wind risk 9/10 · Severe
- Chance of severe wind over 30 yrs
- 99.0%
Air-quality risk 1/10 · Minimal
- Unhealthy air days now
- 0 days/yr
- Unhealthy air days in 30 yrs
- 0 days/yr
Risk factors via First Street. Map © Google.
Why this score? — see what drove the D+ grade
The composite is a weighted blend of 9 inputs, each scored 0–100. Each bar is that input's sub-score; the figure is the points it added to the 100-point composite (weight × sub-score).
- Cash flow +19.3/30.0
- ARV discount +6.4/15.0
- DSCR +6.1/10.0
- 1% rule +4.5/10.0
- Schools +3.6/10.0
- Rent growth +3.4/5.0
- Livability +3.2/5.0
- Condition / age +2.5/5.0
- Appreciation +0.0/10.0
$179,000
🖨 Deal sheet 📄 Offer letter ✓ Due diligence
Listing remarks
The location truly couldn’t be more convenient—just minutes from Cordova Mall, Pensacola State College, Sacred Heart Hospital, beautiful beaches, popular restaurants, and the post office. Both bedrooms offer exceptional space, providing comfort and flexibility for any lifestyle. Owner has just completed a fresh paint job, installed new carpet and replaced the roof in 2026.
Key facts
- New carpet
- Fresh paint job
- 2 parking spots
Tags
Property features AI
Finance
- Other: Publicly maintained road
- HOA & community: No association
Exterior
- Parking: 2 spaces per unit
- Utilities: Public water; Public sewer; Electric with circuit breakers
- Home design: Attached property; Two levels
- Construction: Frame construction; Slab foundation; Composition roof; Resale property
- Exterior features: Privacy fencing in the back yard; Interior lot
Interior
- Kitchen: Built-in microwave; Dishwasher; Refrigerator; Electric water heater
- Bedrooms: Master bedroom approx. 13 x 14; Second bedroom located on the second level, approx. 17.9 x 10.8
- Flooring: Tile; Vinyl; Carpet
- Bathrooms: 2 full bathrooms
- Heating & cooling: Central heating; Central air conditioning; Ceiling fans
- Interior features: Blinds on windows; Updated kitchen (paint and appliances within last 1–5 years)
- Laundry & utility: Washer/dryer hookups
Neighborhood map
What this means for you Summary
Snapshot
- This is a 2-bed/2.0-bath townhouse listed at $179k.
Deal economics
- At list price, monthly cash flow is $198 ($2k/yr) — positive.
- The deal already cash-flows at list — no discount required.
- To meet the 1% rule (rent ≥ 1% of price), the offer needs to be $170k (4.9% below list).
- Recommended offer: $170k (4.9% below list) — sets the bar for 1% rule.
- Cap rate 7.6% vs local median 4.4% in Ferry Pass — top-decile yield for the area; either an underpriced asset or a hidden risk that comps aren't pricing in. Stress-test before assuming the spread holds.
Location & tenants
- Location reads 65/100 on livability (#664 in FL) — a middle-class / working-renter tenant base. Strengths: cost of living A+, housing A+; Watch: employment C-, schools D, amenities F.
- Escambia (suburban): math 40% / reading 45% proficiency, ranked #56 of 73 in FL (top 77%) — families likely to look elsewhere, expect single-tenant / working-renter base with shorter leases.
- Market conditions: Rents rising (+3.6%/yr); 172 active listings in the ZIP; 23 comparable units currently listed for rent nearby; rentals at typical pace (median 21d on market — plan ~3-4 weeks tenant-placement turnaround); 1,479 units permitted in Escambia County in 2024 (0 in 5+ unit buildings).
Forward outlook
- Local home prices are declining (-3.0%/yr); year-one equity from $1k of loan paydown is wiped out by about $5k of value loss. Plan a longer hold.
- Escambia County population projected at +13% by 2050 — modest demand growth; plan on rents tracking national, not racing it.
Negotiation context
- It's been on market 30 days — a 2% lower offer ($176k) is reasonable based on typical stale-listing flexibility.
- 3 sale attempts since 2y ago with the ask held roughly flat each time — persistent listings suggest the price (not the market) is what's stuck; bring a comps-based counter.
- Current owner paid $32k; list at $179k implies a 459% gain — meaningful room to come down on a strong offer.
Risks & watch-outs
- Climate carrying-cost: major flood risk; severe wind risk, 99% chance of damaging wind over 30y; extreme-heat days projected 7→23/yr by 2055 (HVAC capex compounding) — expect insurance premiums to compound above CPI over the hold.
Questions for the listing agent
- Is there a deadline driving the sale (1031 exchange, divorce, estate, relocation)? That informs how much negotiation room exists.
- Schools are D-rated, which usually means shorter tenancies and higher turnover. Who's the typical renter profile here, and what's been the actual vacancy rate?
- The area grade is low — what's the realistic commute time and amenity access for the typical tenant pool here? Any planned neighborhood developments (good or bad) we should know about?
- What's the average days-on-market for RENTAL listings here right now (not sales)? A rising rental-DOM trend means longer vacancies and softer asking-rent achievability than the comps imply.
- What's the recent tenant-quality profile in this submarket — average credit score on applications, eviction rate, late-payment / NSF rate, and stable-employment percentage? A property-management company in the area should have these aggregated.
- How much new for-sale + rental construction is in the pipeline within 1–3 miles? Heavy new supply typically softens prices + rents 12–24 months out; constrained supply supports both.
Investment metrics
- 1% rule
- 0.95% ✗
- Cap rate
- 7.62%
- Cash-on-cash
- 4.74%
- DSCR
- 1.21
- GRM
- 8.8
CMA / ARV
- ARV (on-the-fly)
- $174,760
- Comps found
- 12
Show comp detail 12 sales within ~0.75 mi
| Address | Dist | Beds/Ba | Sqft | Sold | Price | $/sf | Match |
|---|---|---|---|---|---|---|---|
| 2838 Villager Cir | 0.55mi | 2/2.0 | 1,290 (+0%) | 5mo | $199,000 | $154 | 69 |
| 1873 Loyola Ave | 0.38mi | 3/1.5 (+1) | 1,288 (+0%) | 11mo | $160,000 | $124 | 66 |
| 6308 Long St | 0.50mi | 2/2.0 | 1,290 (+0%) | 14mo | $170,000 | $132 | 65 |
| 2827 Villager Cir | 0.51mi | 2/2.0 | 1,290 (+0%) | 14mo | $210,000 | $163 | 64 |
| 6303 Harvard Ct | 0.41mi | 3/1.5 (+1) | 1,308 (+2%) | 10mo | $148,000 | $113 | 63 |
| 1951 Creighton Rd | 0.44mi | 3/1.5 (+1) | 1,330 (+4%) | 6mo | $166,000 | $125 | 62 |
| 6301 Langley Place Rd | 0.60mi | 2/2.0 | 1,180 (-8%) | 1mo | $176,500 | $150 | 58 |
| 2813 Langley Ave Unit E209 | 0.60mi | 3/2.0 (+1) | 1,358 (+6%) | 5mo | $135,000 | $99 | 53 |
| 6152 Chablis Ln | 0.70mi | 2/2.0 | 1,214 (-6%) | 10mo | $195,000 | $161 | 49 |
| 6400 Long St #5 | 0.50mi | 2/2.0 | 1,128 (-12%) | 10mo | $125,000 | $111 | 47 |
| 6255 Kirsten Dr | 0.71mi | 3/1.5 (+1) | 1,246 (-3%) | 18mo | $178,000 | $143 | 40 |
| 6120 The Oaks Ln | 0.57mi | 3/2.5 (+1) | 1,470 (+14%) | 6mo | $200,000 | $136 | 37 |
Match score weights: distance 35% · size 25% · config 20% · recency 20%. Top-matched comps best support the ARV.
Projected returns pro-forma
-3.0% appreciation · 3.63% rent growth · sell at horizon
- IRR
- -8.3%
- Equity multiple
- 0.69×
- Total profit
- $-15,336
- Equity at exit
- $26,689
- IRR
- 2.0%
- Equity multiple
- 1.15×
- Total profit
- $7,278
- Equity at exit
- $15,477
Cash invested: $50,120 (down + closing). Projections, not guarantees.
Landlord ↔ Tenant lean methodology
- Overall (STATE)
- 87 Strongly Landlord-Friendly
- State Florida
- 87 Strongly Landlord-Friendly · R+3
- County
- — inherits STATE
- City
- — inherits STATE
ZIP-level market 32504
- Home prices YoY
- -30.9%
- Rents YoY
- 3.6%
- Active inventory
- 172
- Price-to-rent
- 8.8×
Monthly cashflow live
- Estimated rent
- $1,702 high interval (Pro) →
- Mortgage (P&I)
- −$939
- Tax from tax record
- −$133 /mo · $1,595/yr
- Insurance
- −$75
- HOA
- −$0
- Vacancy / Maint / Mgmt
- −$357
- Net cashflow
- $198
Break-even live
UW: 25.0% down · 7.5% · 30yr · 1.5% tax · 5.0% vac · 8.0% maint · 8.0% mgmt
Financing live
Cash to close
- Down payment
- $44,750
- Closing costs
- $5,370
- Reserves months
- —
- Total cash needed
- —
Loan-product check · same deal, 3 products live
Conventional
25% down · 7.5% · 30yr
- Down + closing
- —
- Monthly P&I
- —
- Monthly cashflow
- —
- DSCR
- —
- Eligible?
- —
Personal DTI + credit; lowest rate.
DSCR
20% down · 8.5% · 30yr
- Down + closing
- —
- Monthly P&I
- —
- Monthly cashflow
- —
- DSCR
- —
- Eligible?
- —
No personal income docs; deal must DSCR.
Hard money
10% down · 12.0% · 12mo
- Down + closing
- —
- Monthly P&I
- —
- Monthly cashflow
- —
- DSCR
- —
- Eligible?
- —
Short-term bridge; refi at stabilization.
Rent comps 23 comps
| Address | Beds | Baths | Sqft | Rent | $/sqft | DOM | Units | Dist |
|---|---|---|---|---|---|---|---|---|
| 6409 Concord Way Pensacola, FL | 2.0 | 2.0 | 990 | $2,100 | $2.12 | 23d | 1 | 0.04mi |
| 2106 Schwab Ct Unit B Pensacola, FL | 2.0 | 1.5 | 960 | $1,595 | $1.66 | 13d | 1 | 0.28mi |
| 1843 San Dollar Cir Unit 1843 Pensacola, FL | 2.0 | 1.0 | 920 | $1,400 | $1.52 | 23d | 1 | 0.47mi |
| 2813 Langley Ave Pensacola, FL | 2.0 | 2.0 | 1078 | $1,450 | $1.35 | 23d | 1 | 0.59mi |
| 7074 Javelin Ct Pensacola, FL | 3.0 | 2.5 | 1543 | $1,850 | $1.20 | 13d | 30 | 0.69mi |
| 711 Underwood Ave Pensacola, FL | 3.0 | 1.0–2.5 | 950 | $1,472 | $1.55 | 13d | 25 | 0.71mi |
| 700 College Blvd Pensacola, FL | 1.0–2.0 | 1.0–2.0 | 850 | $1,381 | $1.62 | 13d | 9 | 0.76mi |
| 7155 N 9th Ave Pensacola, FL | 1.0–2.0 | 1.0 | 850 | $1,575 | $1.85 | 13d | 4 | 0.85mi |
| 7104 Cedar Grove Way Ferry Pass, FL | 3.0 | 2.5 | 1534 | $1,850 | $1.21 | 13d | 37 | 0.88mi |
| 7171 N 9th Ave Unit D6 Pensacola, FL | 2.0 | 2.0 | 1204 | $1,450 | $1.20 | 13d | 1 | 0.93mi |
| 7322 Mangum Dr Unit 7322 Pensacola, FL | 2.0 | 2.0 | 1100 | $1,450 | $1.32 | 23d | 1 | 0.99mi |
| 7650 Kipling St Unit 1 Pensacola, FL | 3.0 | 2.0 | 1200 | $1,300 | $1.08 | 23d | 1 | 1.09mi |
| 3730 Forest Glen Dr Pensacola, FL | 3.0 | 2.0 | 1107 | $1,660 | $1.50 | 23d | 1 | 1.13mi |
| 3795 Summer Dr Pensacola, FL | 3.0 | 2.0 | 1650 | $2,600 | $1.58 | 23d | 1 | 1.15mi |
| 7601 N 9th Ave Pensacola, FL | 1.0–2.0 | 1.0–2.0 | 855 | $1,467 | $1.72 | 13d | 7 | 1.23mi |
| 3205 E Olive Rd Pensacola, FL | 1.0–2.0 | 1.0–2.0 | 900 | $1,540 | $1.71 | 13d | 8 | 1.26mi |
| 8053 Malibu Cir Pensacola, FL | 3.0 | 2.0 | 1575 | $1,810 | $1.15 | 13d | 1 | 1.32mi |
| 7101 Joy St Unit I5 Pensacola, FL | 3.0 | 2.0 | 1183 | $1,950 | $1.65 | 23d | 1 | 1.39mi |
| 5941 Leesway Blvd Pensacola, FL | 3.0 | 2.0 | 1549 | $1,975 | $1.28 | 21d | 1 | 1.43mi |
| 6016 Sewell St Pensacola, FL | 3.0 | 1.5 | 1377 | $1,650 | $1.20 | 23d | 1 | 1.47mi |
| 4140 April Rd Pensacola, FL | 3.0 | 2.0 | 1506 | $1,800 | $1.20 | 21d | 1 | 1.48mi |
| 4051 E Olive Rd Pensacola, FL | 1.0–2.0 | 1.0–2.0 | 855 | $1,425 | $1.67 | 23d | 37 | 1.49mi |
| 8108 Ridgefield Rd Pensacola, FL | 3.0 | 2.0 | 1485 | $2,000 | $1.35 | 13d | 1 | 1.50mi |
Listing history 30 events
-
2026-06-18days on market $179,000 Active 30 DOM
-
2026-06-17days on market $179,000 Active 29 DOM
-
2026-06-16days on market $179,000 Active 28 DOM
-
2026-06-15days on market $179,000 Active 27 DOM
-
2026-06-14days on market $179,000 Active 25 DOM
-
2026-06-10days on market $179,000 Active 22 DOM
-
2026-06-09days on market $179,000 Active 21 DOM
-
2026-06-08days on market $179,000 Active 20 DOM
-
2026-06-07days on market $179,000 Active 19 DOM
-
2026-06-03days on market $179,000 Active 15 DOM
-
2026-06-02days on market $179,000 Active 14 DOM
-
2026-06-01days on market $179,000 Active 13 DOM
-
2026-05-31days on market $179,000 Active 12 DOM
-
2026-05-31days on market $179,000 Active 11 DOM
-
2026-05-19$179,000 Active
-
2025-03-21historical $1,250
-
2025-03-04price $1,250
-
2025-02-01price $1,300
-
2024-12-12price $1,350
-
2024-11-27price $1,400
-
2024-11-14price $1,425
-
2024-11-01$1,450
-
2024-05-29historical $1,400
-
2024-05-15price $1,400
-
2024-04-30price $1,425
-
2024-04-03price $1,450
-
2024-03-21price $1,500
-
2024-03-01$1,550
-
1996-05-29soldstatus $32,000
-
1985-10-01soldstatus $42,900
ⓘ Source: listings_history table (triggers on properties + properties_extension) + one-shot
backfill from property_details.listing_events for pre-trigger history.
Tax reassessment forecast FL · Resets to sale price
- Current annual tax
- $1,595 · $133/mo
- Projected year-2 tax
- $1,595 · $133/mo
- Expected delta
- $0/yr ($0/mo · 0.0%)
ⓘ Screening estimate from a state-policy table — verify with the county assessor before closing.
Climate risk First Street
- Flood 6/10 Major FEMA zone X (unshaded) · 72% chance over 30 yrs
- Wildfire 1/10 Low
- Heat 10/10 Extreme 7 d/yr ≥106°F today · 23 d/yr by 30 yrs out
- Wind 9/10 Extreme 99% chance of damaging wind over 30 yrs
- Air quality 1/10 Low 0 unhealthy d/yr today · 0 by 30 yrs out
Nearby sold comps map
Loading sold comps map…
Walkable amenities ~0.75 mi
Loading nearby amenities…
Taxation est. · year 1
- Rental income
- $20,419
- − Mortgage interest
- −$10,027
- − Property taxes
- −$1,595
- − Insurance
- −$895
- − Repairs & maintenance
- −$1,633
- − Management
- −$1,633
- − Depreciation
- −$5,207
- Taxable loss
- −$572
- Est. tax savings @ 24.0%
- +$137
- After-tax cash flow
- $2,514/yr
For passive investors: Depreciation is non-cash, so a rental often shows a tax loss while cash-flowing — sheltering income. Rental losses are passive: they offset passive income freely, and up to $25,000/yr can offset ordinary (W-2) income if you actively participate and your MAGI is under $100k (phasing out to $0 by $150k); unused losses carry forward. On sale, claimed depreciation is recaptured at up to 25%, and gains may owe capital-gains tax (a 1031 exchange can defer both). Figures are a year-1 estimate at your 24.0% rate — not tax advice; consult a CPA.
Schools (NCES district)
- District
- Escambia
- NCES district ID
- 1200510
- Math proficiency
- 40% ▼ -9.00%
- Reading proficiency
- 45% ▼ -4.00%
- Median HH income
- $44,649
- Composite
- 36.04/100
- National rank
- #4773
- State rank
- #56 of 73 in FL
Livability — Ferry Pass
- Score
- 65/100
- State rank
- #664
- US rank
- #13543
Category grades
Schools grade is shown separately in the Schools card above.
Census & demographics
- Census place
- Ferry Pass, FL
- County
- Escambia County · 301,722 people
- City population
- 43,072
- Metro
- Pensacola-Ferry Pass-Brent, FL
- Population (ZIP)
- 22,153
- Household income
- $72,672
- Rent vs Own
- Severe rent burden
- 533.0
Population outlook (Escambia County) Hauer SSP2
- Today (2025)
- 334,637 people
- By 2030
- 345,779 · +3.3%
- By 2040
- 364,828 · +9.0%
- By 2050
- 378,514 · +13.1%
- By 2075
- 403,220 · +20.5%
- By 2100
- 386,125 · +15.4%
Race, ethnicity, and origin ACS 2023
- Neighborhood character
- Predominantly White (69%)
- Race & ethnicity
- White 69% Black 13% Two or more races 10% Hispanic / Latino 6% Asian 4%
- Hispanic origin (detail)
- Mexican 2%
- Common ancestry
- Lithuanian 3% Italian 2% Slovak 2%
- Foreign-born
- 7% · Canada, China, Jamaica
- Languages at home
- 92% English-only · Spanish 2% Chinese 2% Other Indo-European 1%
Political lean MEDSL · Escambia
- 2024 margin
- R (+19.5) · D 39.7% · R 59.2% · Other 1.1%
- 2008→2024 swing
- -0.2pp no change · 2008: -19.3pp · 2024: -19.5pp
- All cycles
- 2024: R+19.5 2020: R+15.1 2016: R+20.6 2012: R+20.6 2008: R+19.3
Not yet ingested
- Civics
- —
Market trends
- HPI YoY
- ▼ -119.75%
- Current HPI
- 268.2214
- Rent YoY
- ▲ 3.63%
- Metro
- Pensacola-Ferry Pass-Brent, FL
- State GDP YoY
- ▲ 3.28%
- F500 in state
- 36
Industry mix (Fortune 500 HQ in FL)
| Industry | F500 HQs | Revenue |
|---|---|---|
| Industrial Technology | 2 | $29B |
|
||
| Insurance | 2 | $17B |
|
||
| Retail | 1 | $60B |
|
||
| Technology Distribution | 1 | $58B |
|
||
| Homebuilding | 1 | $35B |
|
||
| Technology Manufacturing | 1 | $35B |
|
||
Price history
+317.2% since first listed16 events — show timeline
- 2026-05-19 Listed $179,000 PARMLS
- 2025-03-21 Rental Removed $1,250 PARMLS
- 2025-03-04 Price Changed $1,250 PARMLS
- 2025-02-01 Price Changed $1,300 PARMLS
- 2024-12-12 Price Changed $1,350 PARMLS
- 2024-11-27 Price Changed $1,400 PARMLS
- 2024-11-14 Price Changed $1,425 PARMLS
- 2024-11-01 Listed for Rent $1,450 PARMLS
- 2024-05-29 Rental Removed $1,400 PARMLS
- 2024-05-15 Price Changed $1,400 PARMLS
- 2024-04-30 Price Changed $1,425 PARMLS
- 2024-04-03 Price Changed $1,450 PARMLS
- 2024-03-21 Price Changed $1,500 PARMLS
- 2024-03-01 Listed for Rent $1,550 PARMLS
- 1996-05-29 Sold (Public Records) $32,000 Public Records
- 1985-10-01 Sold (Public Records) $42,900 Public Records
Property tax history
+7.1%/yrLatest (2025): $1,595 · +17.2% YoY. Source: county tax records.
Cash-flow waterfall
monthlySold comps — $/sqft
last 12 mo · ≤1 miLoading sold comps…