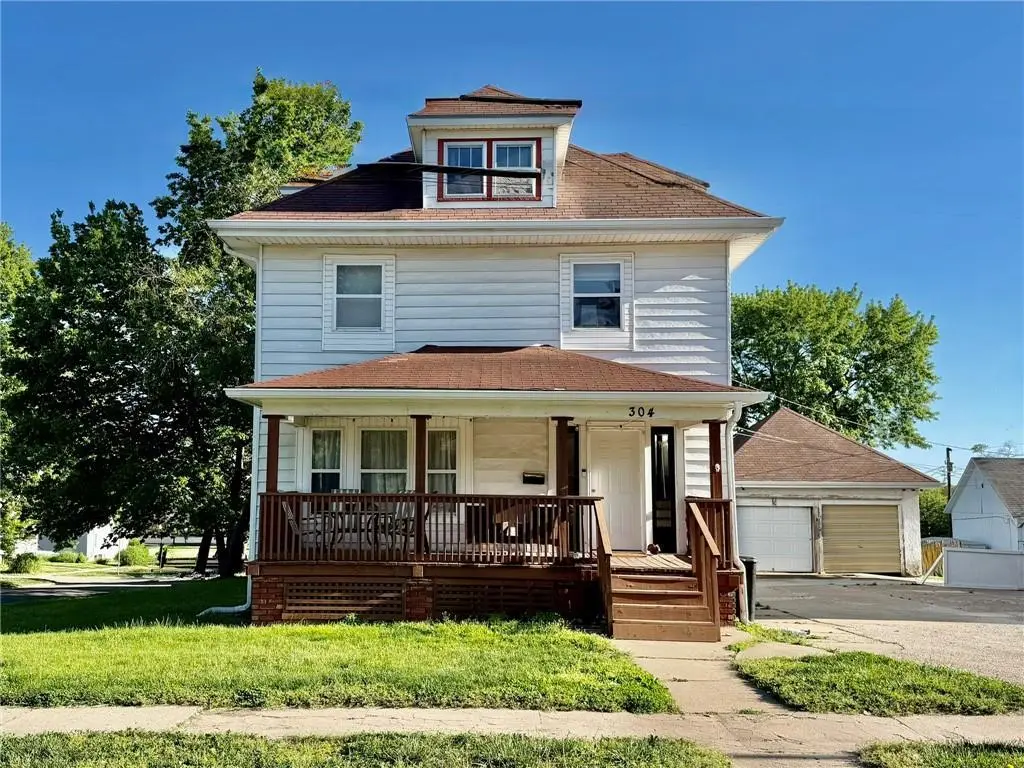
304 W 7th St · Maryville, MO
Flood risk 1/10 · Minimal
- FEMA flood zone
- X (unshaded)
- Chance of flooding over 30 yrs
- 0.0%
- Est. flood insurance / yr
- $507 – $1,088
Fire risk 2/10 · Minimal
- Est. fire insurance / yr
- $1,054 – $1,958
Heat risk 3/10 · Minor
- Hot days now (above 105°F)
- 7 days/yr
- Hot days in 30 yrs
- 15 days/yr
Wind risk 2/10 · Minimal
- Chance of severe wind over 30 yrs
- —
Air-quality risk 2/10 · Minimal
- Unhealthy air days now
- 1 days/yr
- Unhealthy air days in 30 yrs
- 1 days/yr
Risk factors via First Street. Map © Google.
Why this score? — see what drove the F grade
The composite is a weighted blend of 9 inputs, each scored 0–100. Each bar is that input's sub-score; the figure is the points it added to the 100-point composite (weight × sub-score).
- Cash flow +8.1/30.0
- ARV discount +7.5/15.0
- Livability +4.0/5.0
- Schools +3.9/10.0
- Rent growth +2.5/5.0
- Condition / age +2.5/5.0
- DSCR +2.2/10.0
- 1% rule +1.5/10.0
- Appreciation +0.0/10.0
$184,000
🖨 Deal sheet (PDF) 📄 Offer letter ✓ Due diligence
Listing remarks
BEAUTIFUL, BRIGHT, & PROFITABLE !! This Investment Property is located just 2 blocks from campus! This spacious 5-bed 2.5-bath, with a one-car garage, is perfect for communal living! Your rental is leased for $1,850 per month ($21,600 Annually) through April 2027 and has been rented, gap-free, to this sorority for 10 years. There is no end in sight. Whether this will be your first dip in the rental world or just a sure thing added to your portfolio, this kind of peace of mind is priceless. Showings require coordination with all tenants, so my advice is to take the exclusive VIRTUAL TOUR via the link provided before you schedule. Your realtor will have access to all P/L statements &am
Key facts
- 5,227 sq ft lot
- Garage
- Built 1930
Property features AI
Finance
- Other: Lot dimensions approximately 66 x 82 (5,227 sq ft); Not in a flood plain; Agent-provided living area: 2,417; Age: approximately 76–100 years
- HOA & community: No association fees
Exterior
- Parking: Detached garage; Off-street parking; 1 garage space
- Utilities: Public water; Public sewer
- Home design: Single family residence; Residential property; 2.5 stories; Faces north; Inside city limits
- Construction: Metal siding; Composition roof; Has basement
- Exterior features: Porch
Interior
- Kitchen: Microwave; Refrigerator; Electric range
- Bedrooms: 5 bedrooms (located on upper/second levels)
- Flooring: Carpet; Ceramic tile; Vinyl; Wood
- Bathrooms: 3 full bathrooms (located on first, second and basement levels)
- Heating & cooling: Natural gas heating; Electric cooling (has central cooling)
- Interior features: Window coverings; Thermal windows; Formal dining area; Concrete basement
- Laundry & utility: Laundry room in basement
Neighborhood map
What this means for you Summary
Snapshot
- This is a 5-bed/3.0-bath other listed at $184k.
Deal economics
- At list price, monthly cash flow is $-176 ($-2k/yr) — negative.
- To cash-flow at today's rent, offer at most $153k (16.9% below list).
- To meet the 1% rule (rent ≥ 1% of price), the offer needs to be $119k (35.1% below list).
- Recommended offer: $119k (35.1% below list) — sets the bar for 1% rule.
- Cap rate 5.1% vs local median 4.2% in Maryville — meaningfully above typical; check what's discounted (condition, days-on-market, listing class) to confirm the premium yield is real.
Location & tenants
- Location reads 79/100 on livability (#23 in MO, #2,122 nationally) — a middle-class / working-renter tenant base. Strengths: cost of living A+, health & safety A+, housing B+; Watch: employment D, commute F.
- Maryville R-II (town): math 42% / reading 53% proficiency, ranked #79 of 324 in MO (top 24%) — families likely to look elsewhere, expect single-tenant / working-renter base with shorter leases.
- Zoned schools: Eugene Field Elem. (math 47% / reading 52%, grade D, #284 of 1,115 statewide, top 30%, 318 students, 52% FRL); Maryville Middle (math 41% / reading 50%, grade D+, #105 of 391 statewide, top 27%, 442 students, 40% FRL); Maryville High (math 42% / reading 72%, grade C, #51 of 521 statewide, top 11%, 506 students, 31% FRL) — zoned schools average 41% FRL vs 25% district-wide (16 pts higher); higher-poverty schools than district average — tighter screening recommended.
- Market conditions: 133 active listings in the ZIP; 49 units permitted in Nodaway County in 2024 (0 in 5+ unit buildings).
Forward outlook
- Local home prices are declining (-3.0%/yr); year-one equity from $1k of loan paydown is wiped out by about $6k of value loss. Plan a longer hold.
- Nodaway County population projected at -13% by 2050 — secular population decline; favor cash flow + early exit over multi-decade hold.
Negotiation context
- It's been on market 98 days — a 9% lower offer ($167k) is reasonable based on typical stale-listing flexibility.
Risks & watch-outs
- Watch-outs: built in 1930 — expect roof / HVAC / electrical / plumbing capex.
Questions for the listing agent
- What do current leases actually rent for vs. the listed asking? Can we see a recent rent roll and the last 12 months of T-12 income?
- It's been on market 98 days. Have you received any prior offers? Is the seller open to a 35% concession, seller financing, or rate buy-down credit?
- Built in 1930 — when were the roof, HVAC, electrical panel, plumbing, and water heater last replaced?
- Why hasn't it sold? Are there any deal-killer items the seller is aware of (foundation, flood, title, zoning, code violations)?
- Is there a deadline driving the sale (1031 exchange, divorce, estate, relocation)? That informs how much negotiation room exists.
- Schools are B-rated — typically a magnet for longer-tenancy family renters. What's the average tenant stay here, and is there a school-zone premium baked into asking?
- The area grade is low — what's the realistic commute time and amenity access for the typical tenant pool here? Any planned neighborhood developments (good or bad) we should know about?
- What's the average days-on-market for RENTAL listings here right now (not sales)? A rising rental-DOM trend means longer vacancies and softer asking-rent achievability than the comps imply.
- What's the recent tenant-quality profile in this submarket — average credit score on applications, eviction rate, late-payment / NSF rate, and stable-employment percentage? A property-management company in the area should have these aggregated.
- How much new for-sale + rental construction is in the pipeline within 1–3 miles? Heavy new supply typically softens prices + rents 12–24 months out; constrained supply supports both.
Investment metrics
- 1% rule
- 0.65% ✗
- Cap rate
- 5.14%
- Cash-on-cash
- -4.11%
- DSCR
- 0.82
- GRM
- 12.8
CMA / ARV
No comps found within radius.
Projected returns pro-forma
-3.0% appreciation · 3.0% rent growth · sell at horizon
- IRR
- -23.3%
- Equity multiple
- 0.20×
- Total profit
- $-41,121
- Equity at exit
- $27,435
- IRR
- -18.1%
- Equity multiple
- 0.02×
- Total profit
- $-50,575
- Equity at exit
- $15,909
Cash invested: $51,520 (down + closing). Projections, not guarantees.
Landlord ↔ Tenant lean methodology
- Overall (STATE)
- 81 Strongly Landlord-Friendly
- State Missouri
- 81 Strongly Landlord-Friendly · R+10
- County
- — inherits STATE
- City
- — inherits STATE
ZIP-level market 64468
- Home prices YoY
- -25.4%
- Active inventory
- 133
- Price-to-rent
- 12.8×
Monthly cashflow live
- Estimated rent
- $1,194 medium interval (Pro) →
- Mortgage (P&I)
- −$965
- Tax from tax record
- −$78 /mo · $932/yr
- Insurance
- −$77
- HOA
- −$0
- Vacancy / Maint / Mgmt
- −$251
- Net cashflow
- $-176
Break-even live
Sensitivity live
| Price | -10% $-72 | -5% $-124 | +0% $-176 | +5% $-228 | +10% $-280 |
|---|---|---|---|---|---|
| Rent | -10% $-271 | -5% $-223 | +0% $-176 | +5% $-129 | +10% $-82 |
| Rate | -1.0pp $-84 | -0.5pp $-130 | base $-176 | +0.5pp $-224 | +1.0pp $-273 |
UW: 25.0% down · 7.5% · 30yr · 1.5% tax · 5.0% vac · 8.0% maint · 8.0% mgmt
Financing live
Cash to close
- Down payment
- $46,000
- Closing costs
- $5,520
- Reserves months
- —
- Total cash needed
- —
Loan-product check · same deal, 3 products live
Conventional
25% down · 7.5% · 30yr
- Down + closing
- —
- Monthly P&I
- —
- Monthly cashflow
- —
- DSCR
- —
- Eligible?
- —
Personal DTI + credit; lowest rate.
DSCR
20% down · 8.5% · 30yr
- Down + closing
- —
- Monthly P&I
- —
- Monthly cashflow
- —
- DSCR
- —
- Eligible?
- —
No personal income docs; deal must DSCR.
Hard money
10% down · 12.0% · 12mo
- Down + closing
- —
- Monthly P&I
- —
- Monthly cashflow
- —
- DSCR
- —
- Eligible?
- —
Short-term bridge; refi at stabilization.
Listing history 21 events
-
2026-06-22days on market $184,000 Active 98 DOM
-
2026-06-21days on market $184,000 Active 97 DOM
-
2026-06-21days on market $184,000 Active 96 DOM
-
2026-06-18days on market $184,000 Active 94 DOM
-
2026-06-17days on market $184,000 Active 93 DOM
-
2026-06-16days on market $184,000 Active 92 DOM
-
2026-06-15days on market $184,000 Active 91 DOM
-
2026-06-13days on market $184,000 Active 89 DOM
-
2026-06-12days on market $184,000 Active 88 DOM
-
2026-06-09days on market $184,000 Active 85 DOM
-
2026-06-08days on market $184,000 Active 84 DOM
-
2026-06-07days on market $184,000 Active 83 DOM
-
2026-06-07days on market $184,000 Active 82 DOM
-
2026-06-04days on market $184,000 Active 79 DOM
-
2026-06-02days on market $184,000 Active 78 DOM
-
2026-06-01days on market $184,000 Active 77 DOM
-
2026-05-31days on market $184,000 Active 76 DOM
-
2026-04-16price $184,000
-
2026-04-01price $194,000
-
2026-03-17price $204,000
-
2026-03-16$225,000 Active
ⓘ Source: listings_history table (triggers on properties + properties_extension) + one-shot
backfill from property_details.listing_events for pre-trigger history.
Tax reassessment forecast MO · Resets to sale price
- Current annual tax
- $932 · $78/mo
- Projected year-2 tax
- $1,785 · $149/mo
- Expected delta
- +$853/yr (+$71/mo · 91.5%)
ⓘ Screening estimate from a state-policy table — verify with the county assessor before closing.
Climate risk First Street
- Flood 1/10 Low FEMA zone X (unshaded) · 0% chance over 30 yrs
- Wildfire 2/10 Low
- Heat 3/10 Moderate 7 d/yr ≥105°F today · 15 d/yr by 30 yrs out
- Wind 2/10 Low
- Air quality 2/10 Low 1 unhealthy d/yr today · 1 by 30 yrs out
Nearby sold comps map
Loading sold comps map…
Walkable amenities ~0.75 mi
Loading nearby amenities…
Taxation est. · year 1
- Rental income
- $14,323
- − Mortgage interest
- −$10,307
- − Property taxes
- −$932
- − Insurance
- −$920
- − Repairs & maintenance
- −$1,146
- − Management
- −$1,146
- − Depreciation
- −$5,353
- Taxable loss
- −$5,480
- Est. tax savings @ 24.0%
- +$1,315
- After-tax cash flow
- $-801/yr
For passive investors: Depreciation is non-cash, so a rental often shows a tax loss while cash-flowing — sheltering income. Rental losses are passive: they offset passive income freely, and up to $25,000/yr can offset ordinary (W-2) income if you actively participate and your MAGI is under $100k (phasing out to $0 by $150k); unused losses carry forward. On sale, claimed depreciation is recaptured at up to 25%, and gains may owe capital-gains tax (a 1031 exchange can defer both). Figures are a year-1 estimate at your 24.0% rate — not tax advice; consult a CPA.
Schools (NCES district)
- District
- Maryville R-II
- NCES district ID
- 2920490
- Math proficiency
- 42% ▼ -5.00%
- Reading proficiency
- 53% ▼ -2.00%
- Median HH income
- $35,045
- Composite
- 39.24/100
- National rank
- #4005
- State rank
- #79 of 324 in MO
Livability — Maryville
- Score
- 79/100
- State rank
- #23
- US rank
- #2122
Category grades
Schools grade is shown separately in the Schools card above.
Census & demographics
- Census place
- Maryville, MO
- City population
- 14,315
- Population (ZIP)
- 14,315
Population outlook (Nodaway County) Hauer SSP2
- Today (2025)
- 22,010 people
- By 2030
- 21,531 · -2.2%
- By 2040
- 20,360 · -7.5%
- By 2050
- 19,210 · -12.7%
- By 2075
- 17,711 · -19.5%
- By 2100
- 16,796 · -23.7%
Race, ethnicity, and origin ACS 2023
- Neighborhood character
- Predominantly White (90%)
- Race & ethnicity
- White 90% Black 3% Hispanic / Latino 3% Two or more races 2% Asian 2%
- Common ancestry
- Slovak 3% Italian 3% Lithuanian 2%
- Foreign-born
- 3% · Canada
- Languages at home
- 97% English-only · Spanish 1% Other Asian/Pacific 1% German/W. Germanic 0%
Political lean MEDSL · Nodaway
- 2024 margin
- Solid R (+43.7) · D 27.6% · R 71.4% · Other 1.0%
- 2008→2024 swing
- -33.2pp toward R · 2008: -10.5pp · 2024: -43.7pp
- All cycles
- 2024: R+43.7 2020: R+40.5 2016: R+40.8 2012: R+27.0 2008: R+10.5
Not yet ingested
- Civics
- —
Market trends
- HPI YoY
- ▼ -65.91%
- Current HPI
- 193.2735
- Rent YoY
- —
- Metro
- —
- State GDP YoY
- ▲ 1.84%
- F500 in state
- 20
Industry mix (Fortune 500 HQ in MO)
| Industry | F500 HQs | Revenue |
|---|---|---|
| Healthcare | 1 | $163B |
|
||
| Insurance | 1 | $21B |
|
||
| Industrial Technology | 1 | $17B |
|
||
| Retail | 1 | $16B |
|
||
| Industrial Distribution | 1 | $10B |
|
||
| Utilities | 1 | $9B |
|
||
Price history
-18.2% since first listed4 events — show timeline
- 2026-04-16 Price Changed $184,000 Heartland MLS as Distributed by MLS Grid
- 2026-04-01 Price Changed $194,000 Heartland MLS as Distributed by MLS Grid
- 2026-03-17 Price Changed $204,000 Heartland MLS as Distributed by MLS Grid
- 2026-03-16 Listed $225,000 Heartland MLS as Distributed by MLS Grid
Property tax history
+1.4%/yrLatest (2025): $932 · +3.5% YoY. Source: county tax records.
Cash-flow waterfall
monthlySold comps — $/sqft
last 12 mo · ≤1 miLoading sold comps…