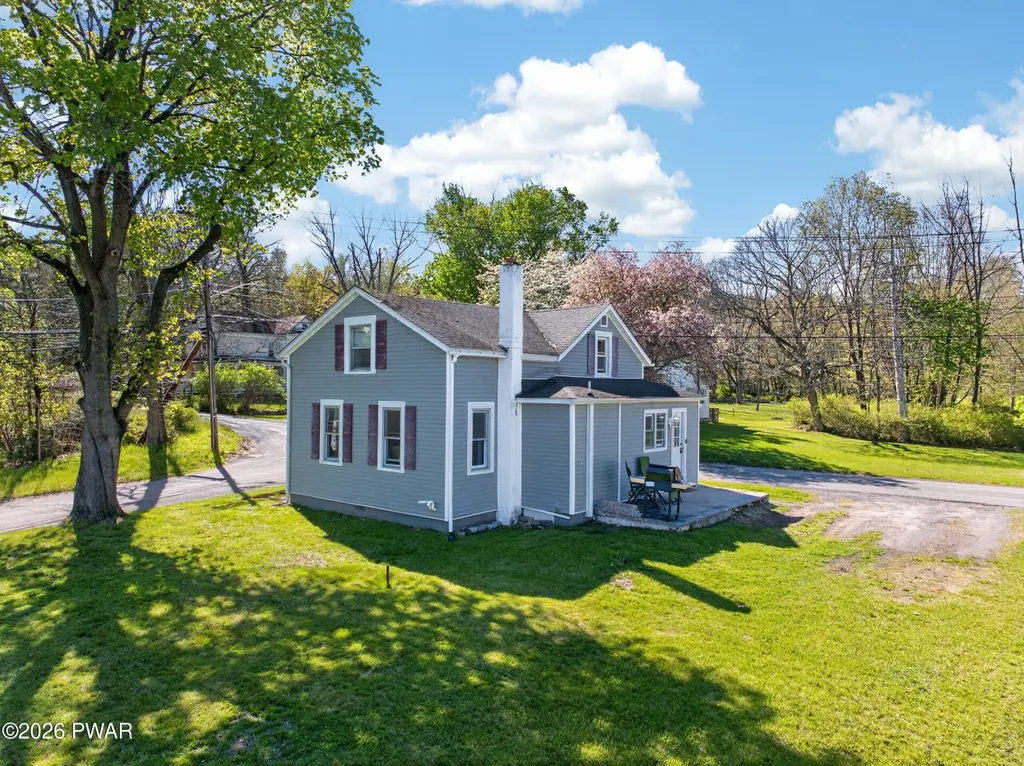
204 Avenue B · Matamoras, PA
Flood risk 4/10 · Minor
- FEMA flood zone
- X (unshaded)
- Chance of flooding over 30 yrs
- 0.24%
- Est. flood insurance / yr
- $473 – $860
Fire risk 4/10 · Minor
- Est. fire insurance / yr
- $511 – $949
Heat risk 4/10 · Minor
- Hot days now (above 97°F)
- 8 days/yr
- Hot days in 30 yrs
- 17 days/yr
Wind risk 3/10 · Minor
- Chance of severe wind over 30 yrs
- 8.0%
Air-quality risk 2/10 · Minimal
- Unhealthy air days now
- 1 days/yr
- Unhealthy air days in 30 yrs
- 2 days/yr
Risk factors via First Street. Map © Google.
Why this score? — see what drove the D grade
The composite is a weighted blend of 9 inputs, each scored 0–100. Each bar is that input's sub-score; the figure is the points it added to the 100-point composite (weight × sub-score).
- ARV discount +12.8/15.0
- Cash flow +11.9/30.0
- Schools +4.7/10.0
- Livability +4.0/5.0
- DSCR +3.5/10.0
- 1% rule +2.8/10.0
- Rent growth +2.5/5.0
- Condition / age +2.5/5.0
- Appreciation +0.0/10.0
$249,000
🖨 Deal sheet (PDF) 📄 Offer letter ✓ Due diligence
Listing remarks MLS
2 bedroom 1 bath. Nice corner lot, Beds Description: 2+BED 2nd, Baths: 1 Bath Level 1, Eating Area: Dining Area
Key facts
- Natural gas stove
- Back deck
- Corner lot
Tags
Property features AI
Exterior
- Parking: Gravel parking
- Home design: Single-family residence; Two levels / 2 stories
- Construction: Vinyl siding
- Exterior features: Front porch; Corner lot
Interior
- Kitchen: Dishwasher; Gas cooktop; Gas oven; Refrigerator; Stainless steel appliances
- Bedrooms: 5 total rooms (bedroom count not specified)
- Flooring: Hardwood
- Bathrooms: 1 full bathroom
- Heating & cooling: Natural gas heating
- Interior features: Hardwood flooring; Unfinished basement
- Laundry & utility: Washer; Dryer; Laundry on main level
Neighborhood map
What this means for you Summary
Snapshot
- This is a 3-bed/1.0-bath single-family listed at $249k.
Deal economics
- At list price, monthly cash flow is $-64 ($-765/yr) — negative.
- To cash-flow at today's rent, offer at most $238k (4.5% below list).
- To meet the 1% rule (rent ≥ 1% of price), the offer needs to be $195k (21.5% below list).
- Recommended offer: $195k (21.5% below list) — sets the bar for 1% rule.
Location & tenants
- Location reads 81/100 on livability (#185 in PA, #1,557 nationally) — a professional / high-income tenant draw. Strengths: crime A+, housing A+, health & safety A+; Watch: commute F.
- Delaware Valley SD (rural): math 41% / reading 66% proficiency, ranked #121 of 539 in PA (top 22%) — acceptable for families but not a draw, mixed tenant base, ~2y average lease.
- Zoned schools: Delaware Valley El Sch (math 42% / reading 67%, grade C, #504 of 1,518 statewide, top 37%, 457 students, 44% FRL); Delaware Valley Ms (math 33% / reading 70%, grade C, #109 of 512 statewide, top 22%, 479 students, 38% FRL); Delaware Valley Hs (math 77% / reading 75%, grade A-, #25 of 437 statewide, top 6%, 1,418 students, 37% FRL).
- Market conditions: 22 active listings in the ZIP; 15 comparable units currently listed for rent nearby; rentals at typical pace (median 16d on market — plan ~3-4 weeks tenant-placement turnaround); 213 units permitted in Pike County in 2024 (0 in 5+ unit buildings).
Forward outlook
- Local home prices are declining (-3.0%/yr); year-one equity from $2k of loan paydown is wiped out by about $7k of value loss. Plan a longer hold.
- Pike County population projected at -25% by 2050 — secular population decline; favor cash flow + early exit over multi-decade hold.
Negotiation context
- Only 4 days on market — expect competitive offers; lowballing is unlikely to land.
- 6 sale attempts since 20y ago with the ask held roughly flat each time — persistent listings suggest the price (not the market) is what's stuck; bring a comps-based counter.
- Current owner paid $202k; 23% above their basis — modest negotiation headroom, anchor on the comps not their cost.
Risks & watch-outs
- Watch-outs: built in 1901 — expect roof / HVAC / electrical / plumbing capex.
Questions for the listing agent
- What do current leases actually rent for vs. the listed asking? Can we see a recent rent roll and the last 12 months of T-12 income?
- Built in 1901 — when were the roof, HVAC, electrical panel, plumbing, and water heater last replaced?
- Is there a deadline driving the sale (1031 exchange, divorce, estate, relocation)? That informs how much negotiation room exists.
- Schools are B-rated — typically a magnet for longer-tenancy family renters. What's the average tenant stay here, and is there a school-zone premium baked into asking?
- The area grade is low — what's the realistic commute time and amenity access for the typical tenant pool here? Any planned neighborhood developments (good or bad) we should know about?
- What's the average days-on-market for RENTAL listings here right now (not sales)? A rising rental-DOM trend means longer vacancies and softer asking-rent achievability than the comps imply.
- What's the recent tenant-quality profile in this submarket — average credit score on applications, eviction rate, late-payment / NSF rate, and stable-employment percentage? A property-management company in the area should have these aggregated.
- How much new for-sale + rental construction is in the pipeline within 1–3 miles? Heavy new supply typically softens prices + rents 12–24 months out; constrained supply supports both.
Investment metrics
- 1% rule
- 0.78% ✗
- Cap rate
- 5.99%
- Cash-on-cash
- -1.10%
- DSCR
- 0.95
- GRM
- 10.6
CMA / ARV
- ARV (median comp)
- $282,327
- List price
- $249,000
- Delta
- -11.80%
- Verdict
- UNDERPRICED
- Comps
- 20 within 1.0 mi
Show comp detail 12 sales within ~0.75 mi
| Address | Dist | Beds/Ba | Sqft | Sold | Price | $/sf | Match |
|---|---|---|---|---|---|---|---|
| 605 5th St | 0.24mi | 2/2.0 (-1) | 960 (-13%) | 1mo | $309,900 | $323 | 57 |
| 204 Avenue M | 0.59mi | 3/1.0 | 1,150 (+4%) | 12mo | $275,000 | $239 | 56 |
| 201 Ave. N | 0.61mi | 2/1.5 (-1) | 1,104 (-0%) | 10mo | $335,000 | $303 | 56 |
| 83 W Main St | 0.63mi | 3/1.0 | 1,170 (+6%) | 8mo | $194,900 | $167 | 55 |
| 605 5th St #605 | 0.24mi | 2/2.0 (-1) | 960 (-13%) | 6mo | $184,100 | $192 | 53 |
| 29 Thompson St | 0.58mi | 3/1.0 | 1,200 (+8%) | 9mo | $270,000 | $225 | 51 |
| 20 Buckley St | 0.51mi | 2/1.5 (-1) | 1,192 (+8%) | 8mo | $170,000 | $143 | 50 |
| 906 Avenue I | 0.64mi | 3/1.5 | 1,224 (+11%) | 2mo | $375,000 | $306 | 49 |
| 506 9th St | 0.50mi | 2/1.0 (-1) | 960 (-13%) | 4mo | $285,000 | $297 | 46 |
| 407 Avenue L | 0.54mi | 2/2.0 (-1) | 1,248 (+13%) | 8mo | $235,000 | $188 | 37 |
| 505 Penna Ave | 0.52mi | 2/2.0 (-1) | 970 (-12%) | 11mo | $170,000 | $175 | 37 |
| 200 Avenue L | 0.54mi | 2/2.0 (-1) | 1,255 (+13%) | 8mo | $373,750 | $298 | 36 |
Match score weights: distance 35% · size 25% · config 20% · recency 20%. Top-matched comps best support the ARV.
Projected returns pro-forma
-3.0% appreciation · 3.0% rent growth · sell at horizon
- IRR
- -18.1%
- Equity multiple
- 0.36×
- Total profit
- $-44,449
- Equity at exit
- $37,127
- IRR
- -10.4%
- Equity multiple
- 0.37×
- Total profit
- $-44,096
- Equity at exit
- $21,529
Cash invested: $69,720 (down + closing). Projections, not guarantees.
Landlord ↔ Tenant lean methodology
- Overall (STATE)
- 62 Landlord-Friendly
- State Pennsylvania
- 62 Landlord-Friendly · EVEN
- County
- — inherits STATE
- City
- — inherits STATE
ZIP-level market 18336
- Home prices YoY
- -15.8%
- Active inventory
- 22
- Price-to-rent
- 10.6×
Monthly cashflow live
- Estimated rent
- $1,955 high interval (Pro) →
- Mortgage (P&I)
- −$1,306
- Tax from tax record
- −$198 /mo · $2,380/yr
- Insurance
- −$104
- HOA
- −$0
- Vacancy / Maint / Mgmt
- −$410
- Net cashflow
- $-64
Break-even live
Sensitivity live
| Price | -10% $77 | -5% $7 | +0% $-64 | +5% $-134 | +10% $-205 |
|---|---|---|---|---|---|
| Rent | -10% $-218 | -5% $-141 | +0% $-64 | +5% $13 | +10% $91 |
| Rate | -1.0pp $62 | -0.5pp $0 | base $-64 | +0.5pp $-128 | +1.0pp $-194 |
UW: 25.0% down · 7.5% · 30yr · 1.5% tax · 5.0% vac · 8.0% maint · 8.0% mgmt
Financing live
Cash to close
- Down payment
- $62,250
- Closing costs
- $7,470
- Reserves months
- —
- Total cash needed
- —
Loan-product check · same deal, 3 products live
Conventional
25% down · 7.5% · 30yr
- Down + closing
- —
- Monthly P&I
- —
- Monthly cashflow
- —
- DSCR
- —
- Eligible?
- —
Personal DTI + credit; lowest rate.
DSCR
20% down · 8.5% · 30yr
- Down + closing
- —
- Monthly P&I
- —
- Monthly cashflow
- —
- DSCR
- —
- Eligible?
- —
No personal income docs; deal must DSCR.
Hard money
10% down · 12.0% · 12mo
- Down + closing
- —
- Monthly P&I
- —
- Monthly cashflow
- —
- DSCR
- —
- Eligible?
- —
Short-term bridge; refi at stabilization.
Rent comps 15 comps
| Address | Beds | Baths | Sqft | Rent | $/sqft | DOM | Units | Dist |
|---|---|---|---|---|---|---|---|---|
| 7 King St Port Jervis, NY | 3.0 | 1.0 | 1300 | $2,400 | $1.85 | 22d | 1 | 0.52mi |
| 7 King St Port Jervis, NY | 3.0 | 1.0 | 1300 | $2,200 | $1.69 | 15d | 1 | 0.52mi |
| 9 King St Port Jervis, NY | 2.0 | 1.0 | 1080 | $1,950 | $1.81 | 21d | 1 | 0.53mi |
| 14 Liberty St Unit B Port Jervis, NY | 2.0 | 1.0 | 1032 | $1,700 | $1.65 | 15d | 1 | 0.62mi |
| 2 Dervend Cir Matamoras, PA | 2.0 | 1.0 | 960 | $1,750 | $1.82 | 0d | 1 | 0.77mi |
| 20 Delaware St Unit B Port Jervis, NY | 2.0 | 1.0 | 950 | $1,800 | $1.89 | 1d | 1 | 0.81mi |
| 20 Delaware St Unit A Port Jervis, NY | 2.0 | 1.0 | 1000 | $2,000 | $2.00 | 25d | 1 | 0.81mi |
| 131 Front St Port Jervis, NY | 3.0 | 1.0 | 1200 | $2,100 | $1.75 | 24d | 1 | 1.00mi |
| 30 Seward Ave Port Jervis, NY | 3.0 | 1.0 | 1500 | $2,100 | $1.40 | 1d | 1 | 1.03mi |
| 106 Ball St #1 Port Jervis, NY | 2.0 | 1.0 | 1062 | $2,000 | $1.88 | 45d | 1 | 1.04mi |
| 106 Ball St Unit 2 Port Jervis, NY | 2.0 | 1.0 | 800 | $1,875 | $2.34 | 12d | 1 | 1.04mi |
| 144 Jersey Ave Unit 2 Port Jervis, NY | 2.0 | 1.0 | 960 | $1,790 | $1.86 | 19d | 1 | 1.09mi |
| 125 Hammond St Unit A Port Jervis, NY | 3.0 | 1.0 | 1300 | $1,750 | $1.35 | 15d | 1 | 1.10mi |
| 39 Church St #22 Port Jervis, NY | 2.0 | 1.0 | 879 | $1,700 | $1.93 | 23d | 1 | 1.11mi |
| 39 Church St Port Jervis, NY | 1.0–2.0 | 1.0 | 685 | $1,700 | $2.48 | 16d | 2 | 1.11mi |
Listing history 16 events
-
2026-05-03status Pending 1073-char remark
-
2026-04-29$249,000 Active 1073-char remark
-
2021-07-15soldstatus $202,000
-
2020-03-24soldstatus $78,350
-
2020-03-23soldstatus $78,350 112-char remark
Show marketing remark (33 chars)
2 bedroom 1 bath. Nice corner lot
-
2020-03-23soldstatus
Show marketing remark (33 chars)
2 bedroom 1 bath. Nice corner lot
-
2020-02-22$85,000 112-char remark
Show marketing remark (33 chars)
2 bedroom 1 bath. Nice corner lot
-
2020-02-22$85,000
Show marketing remark (33 chars)
2 bedroom 1 bath. Nice corner lot
-
2017-08-23soldstatus $584,000
-
2016-08-31soldstatus $52,000
-
2016-08-31soldstatus $52,000
-
2016-03-15$54,500
-
2016-03-15$54,500
-
2006-11-14soldstatus $122,000
-
2006-11-13soldstatus $122,000
-
2006-05-31$149,900
ⓘ Source: listings_history table (triggers on properties + properties_extension) + one-shot
backfill from property_details.listing_events for pre-trigger history.
Tax reassessment forecast PA · Partial reset (capped growth)
- Current annual tax
- $2,380 · $198/mo
- Projected year-2 tax
- $3,157 · $263/mo
- Expected delta
- +$777/yr (+$65/mo · 32.7%)
ⓘ Screening estimate from a state-policy table — verify with the county assessor before closing.
Climate risk First Street
- Flood 4/10 Moderate FEMA zone X (unshaded) · 24% chance over 30 yrs
- Wildfire 4/10 Moderate
- Heat 4/10 Moderate 8 d/yr ≥97°F today · 17 d/yr by 30 yrs out
- Wind 3/10 Moderate 8% chance of damaging wind over 30 yrs
- Air quality 2/10 Low 1 unhealthy d/yr today · 2 by 30 yrs out
Nearby sold comps map
Loading sold comps map…
Walkable amenities ~0.75 mi
Loading nearby amenities…
Taxation est. · year 1
- Rental income
- $23,454
- − Mortgage interest
- −$13,948
- − Property taxes
- −$2,380
- − Insurance
- −$1,245
- − Repairs & maintenance
- −$1,876
- − Management
- −$1,876
- − Depreciation
- −$7,244
- Taxable loss
- −$5,114
- Est. tax savings @ 24.0%
- +$1,227
- After-tax cash flow
- $462/yr
For passive investors: Depreciation is non-cash, so a rental often shows a tax loss while cash-flowing — sheltering income. Rental losses are passive: they offset passive income freely, and up to $25,000/yr can offset ordinary (W-2) income if you actively participate and your MAGI is under $100k (phasing out to $0 by $150k); unused losses carry forward. On sale, claimed depreciation is recaptured at up to 25%, and gains may owe capital-gains tax (a 1031 exchange can defer both). Figures are a year-1 estimate at your 24.0% rate — not tax advice; consult a CPA.
Schools (NCES district)
- District
- Delaware Valley SD
- NCES district ID
- 4207530
- Math proficiency
- 41% ▼ -12.00%
- Reading proficiency
- 66% ▼ -9.00%
- Median HH income
- $64,202
- Composite
- 46.95/100
- National rank
- #2359
- State rank
- #121 of 539 in PA
Livability — Matamoras
- Score
- 81/100
- State rank
- #185
- US rank
- #1557
Category grades
Schools grade is shown separately in the Schools card above.
Census & demographics
- Census place
- Matamoras, PA
- Population (ZIP)
- 4,133
Population outlook (Pike County) Hauer SSP2
- Today (2025)
- 53,548 people
- By 2030
- 51,622 · -3.6%
- By 2040
- 46,490 · -13.2%
- By 2050
- 40,372 · -24.6%
- By 2075
- 31,951 · -40.3%
- By 2100
- 26,821 · -49.9%
Race, ethnicity, and origin ACS 2023
- Neighborhood character
- Predominantly White (81%)
- Race & ethnicity
- White 81% Hispanic / Latino 11% Two or more races 7% Asian 4% Black 2%
- Hispanic origin (detail)
- Puerto Rican 9%
- Common ancestry
- Romanian 3% Slovak 2% Iranian 2%
- Foreign-born
- 6% · Canada, China
- Languages at home
- 90% English-only · Spanish 4% Other Indo-European 3% German/W. Germanic 1%
Political lean MEDSL · Pike
- 2024 margin
- Strong R (+24.1) · D 37.6% · R 61.6%
- 2008→2024 swing
- -19.8pp toward R · 2008: -4.2pp · 2024: -24.1pp
- All cycles
- 2024: R+24.1 2020: R+19.0 2016: R+26.0 2012: R+11.0 2008: R+4.2
Not yet ingested
- Civics
- —
Market trends
- HPI YoY
- ▼ -43.00%
- Current HPI
- 229.7694
- Rent YoY
- —
- Metro
- —
- State GDP YoY
- ▲ 1.68%
- F500 in state
- 34
Industry mix (Fortune 500 HQ in PA)
| Industry | F500 HQs | Revenue |
|---|---|---|
| Healthcare | 2 | $309B |
|
||
| Insurance | 2 | $27B |
|
||
| Telecommunications / Media | 1 | $124B |
|
||
| Industrial Distribution | 1 | $22B |
|
||
| Financial Services | 1 | $20B |
|
||
| Chemicals / Materials | 1 | $18B |
|
||
Price history
+66.1% since first listed16 events — show timeline
- 2026-05-03 Pending — PWMLS
- 2026-04-29 Listed $249,000 PWMLS
- 2021-07-15 Sold (Public Records) $202,000 Public Records
- 2020-03-24 Sold (Public Records) $78,350 Public Records
- 2020-03-23 Sold (MLS) — PWMLS
- 2020-03-23 Sold (MLS) $78,350 PWMLS
- 2020-02-22 Listed $85,000 PWMLS
- 2020-02-22 Listed $85,000 PWMLS
- 2017-08-23 Sold (Public Records) $584,000 Public Records
- 2016-08-31 Sold (MLS) $52,000 PMAR
- 2016-08-31 Sold (MLS) $52,000 PWMLS
- 2016-03-15 Listed $54,500 PMAR
- 2016-03-15 Listed $54,500 PWMLS
- 2006-11-14 Sold (Public Records) $122,000 Public Records
- 2006-11-13 Sold (MLS) $122,000 PMAR
- 2006-05-31 Listed $149,900 PMAR
Property tax history
+1.2%/yrLatest (2026): $2,380 · +2.4% YoY. Source: county tax records.
Cash-flow waterfall
monthlySold comps — $/sqft
last 12 mo · ≤1 miLoading sold comps…