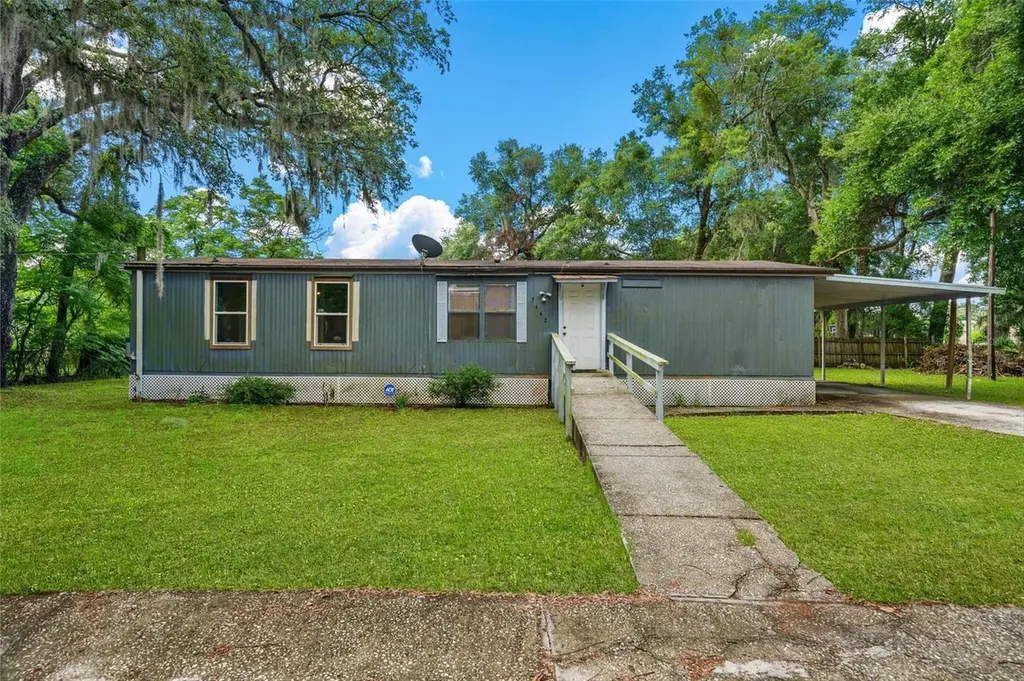
3442 Dew Berry Ave · Apopka, FL
Flood risk 1/10 · Minimal
- FEMA flood zone
- X (unshaded)
- Chance of flooding over 30 yrs
- 0.0%
- Est. flood insurance / yr
- $507 – $1,088
Fire risk 4/10 · Minor
- Est. fire insurance / yr
- $947 – $1,759
Heat risk 8/10 · Major
- Hot days now (above 108°F)
- 7 days/yr
- Hot days in 30 yrs
- 22 days/yr
Wind risk 9/10 · Severe
- Chance of severe wind over 30 yrs
- 99.0%
Air-quality risk 1/10 · Minimal
- Unhealthy air days now
- 0 days/yr
- Unhealthy air days in 30 yrs
- 0 days/yr
Risk factors via First Street. Map © Google.
Why this score? — see what drove the B- grade
The composite is a weighted blend of 9 inputs, each scored 0–100. Each bar is that input's sub-score; the figure is the points it added to the 100-point composite (weight × sub-score).
- Cash flow +30.0/30.0
- DSCR +10.0/10.0
- 1% rule +9.0/10.0
- ARV discount +7.5/15.0
- Schools +4.1/10.0
- Livability +3.3/5.0
- Condition / age +2.5/5.0
- Rent growth +2.0/5.0
- Appreciation +0.0/10.0
$175,000
🖨 Deal sheet 📄 Offer letter ✓ Due diligence
Listing remarks
Under contract-accepting backup offers. * * NO HOA * * FULLY FURNISHED * * MOVE IN READY * * ALMOST HALF ACRE * * POTENTIAL TO DIVIDE LOT & BUILD TWO HOMES * * Welcome to 3442 Dew Berry Ave — a rare opportunity to own a fully furnished, move-in ready property in the heart of Apopka with NO HOA and endless flexibility! Situated on an oversized 0.42-acre lot, this beautifully maintained 3-bedroom, 2-bath double-wide manufactured home offers the perfect blend of comfort, privacy, and incredible investment potential. Whether you're searching for a primary residence, seasonal Florida retreat, rental property, or turnkey investment, this home checks every box. Step inside
Key facts
- Almost half acre
- Ample parking
- Covered carport
Tags
Property features AI
Finance
- Other: Furnished; Approximately 0.42 acre lot (0.25 to <0.5 acre)
Exterior
- Parking: Carport with 2 spaces
- Utilities: Public water; Septic tank; Electricity connected
- Home design: Manufactured double wide home; Single-story; North-facing entry
- Construction: Metal siding; Other roof; Crawlspace foundation; Built as a manufactured home
- Exterior features: Sidewalk
Interior
- Kitchen: Range; Microwave; Refrigerator; Electric water heater
- Bedrooms: 3 bedrooms
- Flooring: Carpet
- Bathrooms: 2 full bathrooms
- Heating & cooling: Ductless heating; Mini-split cooling; Wall/window unit cooling
- Interior features: Washer and Dryer included; Electric water heater; Microwave; Range; Refrigerator; Carpet flooring; Ductless heating
- Laundry & utility: Inside laundry room; Washer; Dryer
Neighborhood map
What this means for you Summary
Snapshot
- This is a 3-bed/2.0-bath single-family listed at $175k.
Deal economics
- At list price, monthly cash flow is $803 ($10k/yr) — positive.
- The deal already cash-flows at list — no discount required.
- Meets the 1% rule at list price ($2k rent vs $175k).
- Cap rate 11.8% vs local median 3.7% in Apopka — top-decile yield for the area; either an underpriced asset or a hidden risk that comps aren't pricing in. Stress-test before assuming the spread holds.
Location & tenants
- Location reads 66/100 on livability (#594 in FL) — a middle-class / working-renter tenant base. Strengths: housing A+, cost of living B+, employment B; Watch: crime D-, amenities F, commute F.
- Orange (suburban): math 46% / reading 51% proficiency, ranked #43 of 73 in FL (top 59%) — families likely to look elsewhere, expect single-tenant / working-renter base with shorter leases.
- Zoned schools: Wolf Lake Elementary (math 67% / reading 68%, grade B+, #435 of 2,144 statewide, top 21%, 733 students, 49% FRL); Apopka High (math 19% / reading 47%, grade F, #406 of 667 statewide, top 61%, 3,507 students, 42% FRL).
- Market conditions: Rents soft (-2.1%/yr); 662 active listings in the ZIP; 5 comparable units currently listed for rent nearby; rentals leasing fast (median 12d on market — plan ~1-2 weeks tenant-placement turnaround); solid renter incomes; 8,053 units permitted in Orange County in 2024 (3,133 in 5+ unit buildings).
Forward outlook
- Local home prices are declining (-3.0%/yr); year-one equity from $1k of loan paydown is wiped out by about $5k of value loss. Plan a longer hold.
- Orange County population projected at +52% by 2050 — long-run rental-demand tailwind backs the buy-and-hold thesis.
- At projected returns (-3.0% appreciation + 0.0% rent growth), your $49k cash investment doubles in ~8 years — after that, you're playing with house money.
Negotiation context
- Only 13 days on market — expect competitive offers; lowballing is unlikely to land.
- 5 sale attempts since 19y ago with the ask held roughly flat each time — persistent listings suggest the price (not the market) is what's stuck; bring a comps-based counter.
- Current owner paid $90k; list at $175k implies a 94% gain — meaningful room to come down on a strong offer.
Risks & watch-outs
- Climate carrying-cost: severe wind risk, 99% chance of damaging wind over 30y; extreme-heat days projected 7→22/yr by 2055 (HVAC capex compounding) — expect insurance premiums to compound above CPI over the hold.
Questions for the listing agent
- Is there a deadline driving the sale (1031 exchange, divorce, estate, relocation)? That informs how much negotiation room exists.
- Schools are D-rated, which usually means shorter tenancies and higher turnover. Who's the typical renter profile here, and what's been the actual vacancy rate?
- Crime grade is D in this area — have there been break-ins, vandalism, or insurance claims at this property in the last 3 years? What carrier currently insures it and at what premium?
- What's the average days-on-market for RENTAL listings here right now (not sales)? A rising rental-DOM trend means longer vacancies and softer asking-rent achievability than the comps imply.
- What's the recent tenant-quality profile in this submarket — average credit score on applications, eviction rate, late-payment / NSF rate, and stable-employment percentage? A property-management company in the area should have these aggregated.
- How much new for-sale + rental construction is in the pipeline within 1–3 miles? Heavy new supply typically softens prices + rents 12–24 months out; constrained supply supports both.
Investment metrics
- 1% rule
- 1.40% ✓
- Cap rate
- 11.80%
- Cash-on-cash
- 19.68%
- DSCR
- 1.88
- GRM
- 6.0
CMA / ARV
No comps found within radius.
Projected returns pro-forma
-3.0% appreciation · 0.0% rent growth · sell at horizon
- IRR
- 8.4%
- Equity multiple
- 1.32×
- Total profit
- $15,637
- Equity at exit
- $26,093
- IRR
- 15.0%
- Equity multiple
- 2.06×
- Total profit
- $51,771
- Equity at exit
- $15,131
Cash invested: $49,000 (down + closing). Projections, not guarantees.
Landlord ↔ Tenant lean methodology
- Overall (STATE)
- 87 Strongly Landlord-Friendly
- State Florida
- 87 Strongly Landlord-Friendly · R+3
- County
- — inherits STATE
- City
- — inherits STATE
ZIP-level market 32712
- Home prices YoY
- -34.5%
- Rents YoY
- -2.1%
- Active inventory
- 662
- Price-to-rent
- 6.0×
Monthly cashflow live
- Estimated rent
- $2,444 high interval (Pro) →
- Mortgage (P&I)
- −$918
- Tax from tax record
- −$137 /mo · $1,641/yr
- Insurance
- −$73
- HOA
- −$0
- Vacancy / Maint / Mgmt
- −$513
- Net cashflow
- $803
Break-even live
UW: 25.0% down · 7.5% · 30yr · 1.5% tax · 5.0% vac · 8.0% maint · 8.0% mgmt
Financing live
Cash to close
- Down payment
- $43,750
- Closing costs
- $5,250
- Reserves months
- —
- Total cash needed
- —
Loan-product check · same deal, 3 products live
Conventional
25% down · 7.5% · 30yr
- Down + closing
- —
- Monthly P&I
- —
- Monthly cashflow
- —
- DSCR
- —
- Eligible?
- —
Personal DTI + credit; lowest rate.
DSCR
20% down · 8.5% · 30yr
- Down + closing
- —
- Monthly P&I
- —
- Monthly cashflow
- —
- DSCR
- —
- Eligible?
- —
No personal income docs; deal must DSCR.
Hard money
10% down · 12.0% · 12mo
- Down + closing
- —
- Monthly P&I
- —
- Monthly cashflow
- —
- DSCR
- —
- Eligible?
- —
Short-term bridge; refi at stabilization.
Rent comps 5 comps
| Address | Beds | Baths | Sqft | Rent | $/sqft | DOM | Units | Dist |
|---|---|---|---|---|---|---|---|---|
| 818 Hilly Bend Dr Apopka, FL | 3.0 | 2.0 | 1332 | $1,895 | $1.42 | 7d | 1 | 0.96mi |
| 2947 Camellia Flower St Apopka, FL | 4.0 | 2.5 | 1678 | $2,450 | $1.46 | 21d | 1 | 1.37mi |
| 1024 Old Magnolia Cove Dr Apopka, FL | 3.0 | 2.0 | 1795 | $2,200 | $1.23 | 2d | 1 | 1.41mi |
| 2756 Camellia Flower St Apopka, FL | 3.0 | 2.5 | 1625 | $2,499 | $1.54 | 11d | 1 | 1.47mi |
| 3105 Douglas Fir Dr Apopka, FL | 4.0 | 2.5 | 1627 | $2,415 | $1.48 | 14d | 1 | 1.48mi |
Listing history 19 events
-
2026-06-08status $175,000 Pending 13 DOM
-
2026-06-07days on market $175,000 Active 13 DOM
-
2026-06-04days on market $175,000 Active 10 DOM
-
2026-06-03days on market $175,000 Active 9 DOM
-
2026-06-02days on market $175,000 Active 8 DOM
-
2026-06-01days on market $175,000 Active 7 DOM
-
2026-05-31days on market $175,000 Active 6 DOM
-
2026-05-25$175,000 Active
-
2025-09-30historical
-
2025-04-17status Active
-
2025-04-03status Pending
-
2025-03-28$225,000 Active
-
2024-08-25historical
-
2024-03-25price $265,000
-
2024-02-25$280,000 Active
-
2008-12-12soldstatus $90,000
-
2007-06-15soldstatus $90,000
-
2007-05-08$90,000
-
1995-02-22soldstatus $20,000
ⓘ Source: listings_history table (triggers on properties + properties_extension) + one-shot
backfill from property_details.listing_events for pre-trigger history.
Tax reassessment forecast FL · Resets to sale price
- Current annual tax
- $1,641 · $137/mo
- Projected year-2 tax
- $1,641 · $137/mo
- Expected delta
- $0/yr ($0/mo · 0.0%)
ⓘ Screening estimate from a state-policy table — verify with the county assessor before closing.
Climate risk First Street
- Flood 1/10 Low FEMA zone X (unshaded) · 0% chance over 30 yrs
- Wildfire 4/10 Moderate
- Heat 8/10 Severe 7 d/yr ≥108°F today · 22 d/yr by 30 yrs out
- Wind 9/10 Extreme 99% chance of damaging wind over 30 yrs
- Air quality 1/10 Low 0 unhealthy d/yr today · 0 by 30 yrs out
Nearby sold comps map
Loading sold comps map…
Walkable amenities ~0.75 mi
Loading nearby amenities…
Taxation est. · year 1
- Rental income
- $29,329
- − Mortgage interest
- −$9,803
- − Property taxes
- −$1,641
- − Insurance
- −$875
- − Repairs & maintenance
- −$2,346
- − Management
- −$2,346
- − Depreciation
- −$5,091
- Taxable income
- $7,227
- Est. tax owed @ 24.0%
- −$1,734
- After-tax cash flow
- $7,907/yr
For passive investors: Depreciation is non-cash, so a rental often shows a tax loss while cash-flowing — sheltering income. Rental losses are passive: they offset passive income freely, and up to $25,000/yr can offset ordinary (W-2) income if you actively participate and your MAGI is under $100k (phasing out to $0 by $150k); unused losses carry forward. On sale, claimed depreciation is recaptured at up to 25%, and gains may owe capital-gains tax (a 1031 exchange can defer both). Figures are a year-1 estimate at your 24.0% rate — not tax advice; consult a CPA.
Schools (NCES district)
- District
- Orange
- NCES district ID
- 1201440
- Math proficiency
- 46% ▼ -9.00%
- Reading proficiency
- 51% ▼ -2.00%
- Median HH income
- $49,350
- Composite
- 41.47/100
- National rank
- #3461
- State rank
- #43 of 73 in FL
Livability — Apopka
- Score
- 66/100
- State rank
- #594
- US rank
- #11020
Category grades
Schools grade is shown separately in the Schools card above.
Census & demographics
- County
- Orange County · 1,471,359 people
- City population
- 109,852
- Metro
- Orlando-Kissimmee-Sanford, FL
- Population (ZIP)
- 50,583
- Household income
- $108,734
- Rent vs Own
- Severe rent burden
- 876.0
Population outlook (Orange County) Hauer SSP2
- Today (2025)
- 1,618,226 people
- By 2030
- 1,787,404 · +10.5%
- By 2040
- 2,125,621 · +31.4%
- By 2050
- 2,454,016 · +51.6%
- By 2075
- 3,173,711 · +96.1%
- By 2100
- 3,607,781 · +122.9%
Race, ethnicity, and origin ACS 2023
- Neighborhood character
- Diverse neighborhood (Simpson 0.67)
- Race & ethnicity
- White 48% Hispanic / Latino 26% Two or more races 19% Black 16% Asian 4%
- Hispanic origin (detail)
- Mexican 6% Puerto Rican 7% Cuban 2% Dominican 1%
- Common ancestry
- Romanian 2% Lithuanian 1% Slovak 1%
- Foreign-born
- 19% · Canada, Jamaica, China
- Languages at home
- 73% English-only · Spanish 21% Other Indo-European 1% French/Haitian/Cajun 1%
Political lean MEDSL · Orange
- 2024 margin
- D (+13.6) · D 56.1% · R 42.5% · Other 1.3%
- 2008→2024 swing
- -5.0pp toward R · 2008: 18.6pp · 2024: 13.6pp
- All cycles
- 2024: D+13.6 2020: D+23.1 2016: D+24.6 2012: D+18.2 2008: D+18.6
Not yet ingested
- Civics
- —
Market trends
- HPI YoY
- ▼ -149.12%
- Current HPI
- 283.4441
- Rent YoY
- ▼ -2.09%
- Metro
- Orlando-Kissimmee-Sanford, FL
- State GDP YoY
- ▲ 3.28%
- F500 in state
- 36
Industry mix (Fortune 500 HQ in FL)
| Industry | F500 HQs | Revenue |
|---|---|---|
| Industrial Technology | 2 | $29B |
|
||
| Insurance | 2 | $17B |
|
||
| Retail | 1 | $60B |
|
||
| Technology Distribution | 1 | $58B |
|
||
| Homebuilding | 1 | $35B |
|
||
| Technology Manufacturing | 1 | $35B |
|
||
Price history
+775.0% since first listed12 events — show timeline
- 2026-05-25 Listed $175,000 Stellar MLS as Distributed by MLS Grid
- 2025-09-30 Listing Removed — Stellar MLS as Distributed by MLS Grid
- 2025-04-17 Relisted — Stellar MLS as Distributed by MLS Grid
- 2025-04-03 Pending — Stellar MLS as Distributed by MLS Grid
- 2025-03-28 Listed $225,000 Stellar MLS as Distributed by MLS Grid
- 2024-08-25 Listing Removed — Stellar MLS as Distributed by MLS Grid
- 2024-03-25 Price Changed $265,000 Stellar MLS as Distributed by MLS Grid
- 2024-02-25 Listed $280,000 Stellar MLS as Distributed by MLS Grid
- 2008-12-12 Sold (Public Records) $90,000 Public Records
- 2007-06-15 Sold (MLS) $90,000 Stellar MLS as Distributed by MLS Grid
- 2007-05-08 Listed $90,000 Stellar MLS as Distributed by MLS Grid
- 1995-02-22 Sold (Public Records) $20,000 Public Records
Property tax history
+6.7%/yrLatest (2025): $1,641 · +11.6% YoY. Source: county tax records.
Cash-flow waterfall
monthlySold comps — $/sqft
last 12 mo · ≤1 miLoading sold comps…