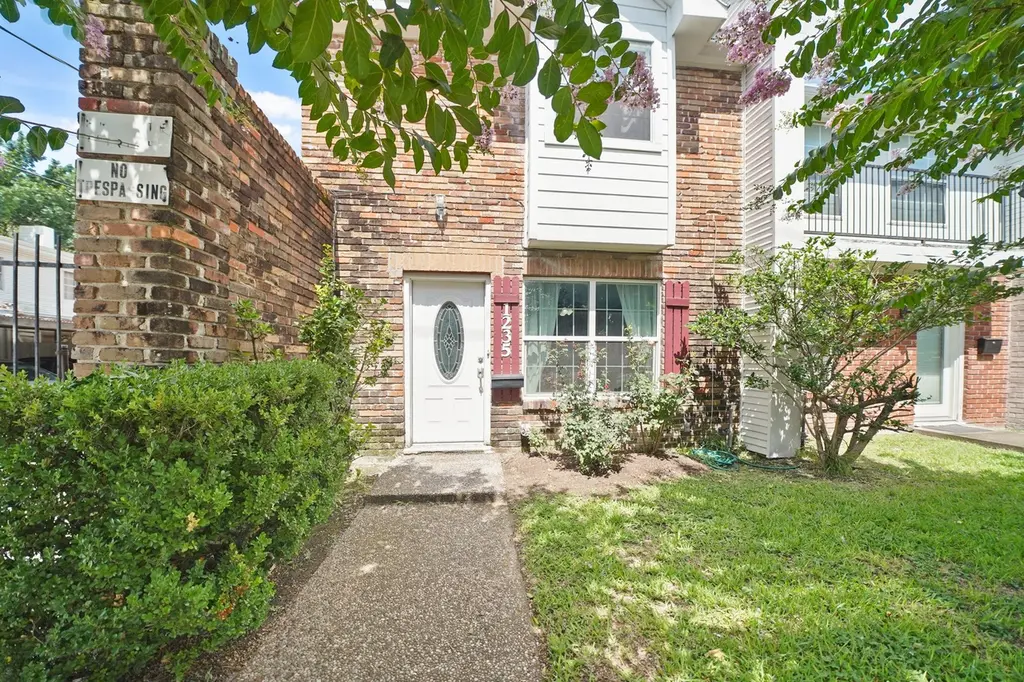
1235 Witte Rd #8 · Houston, TX
Flood risk 6/10 · Moderate
- FEMA flood zone
- X (unshaded)
- Chance of flooding over 30 yrs
- 0.75%
- Est. flood insurance / yr
- $507 – $1,088
Fire risk 1/10 · Minimal
- Est. fire insurance / yr
- $1,222 – $2,270
Heat risk 9/10 · Severe
- Hot days now (above 109°F)
- 7 days/yr
- Hot days in 30 yrs
- 23 days/yr
Wind risk 9/10 · Severe
- Chance of severe wind over 30 yrs
- 99.0%
Air-quality risk 3/10 · Minor
- Unhealthy air days now
- 3 days/yr
- Unhealthy air days in 30 yrs
- 3 days/yr
Risk factors via First Street. Map © Google.
Why this score? — see what drove the C+ grade
The composite is a weighted blend of 9 inputs, each scored 0–100. Each bar is that input's sub-score; the figure is the points it added to the 100-point composite (weight × sub-score).
- Cash flow +20.3/30.0
- ARV discount +12.7/15.0
- 1% rule +9.9/10.0
- DSCR +6.5/10.0
- Schools +4.1/10.0
- Livability +3.7/5.0
- Rent growth +2.9/5.0
- Condition / age +2.5/5.0
- Appreciation +0.0/10.0
$165,000
🖨 Deal sheet 📄 Offer letter ✓ Due diligence
Listing remarks MLS
Welcome to 1235 Witte Rd., a beautifully maintained 3-bedroom, 2.5-bathroom residence located in the highly sought-after Spring Branch neighborhood of Houston. This spacious home offers a perfect blend of comfort, style, and convenience, ideal for families or anyone looking for easy access to city life with a touch of suburban tranquility. Step inside to discover an open-concept layout with abundant natural light, updated flooring, and neutral tones that create a warm and inviting atmosphere. The kitchen features modern appliances, ample cabinet space, and a breakfast bar, opening into a generously sized living and dining area, perfect for entertaining guests or relaxing with loved ones. A convenient half bath adds extra functionality for guests. With a location just minutes from top-rated schools, major highways, Memorial City Mall, and Houston’s Energy Corridor, this home offers both comfort and connectivity.
Key facts
- $512 HOA
- 2 parking spots
- Built 1966
Neighborhood map
What this means for you Summary
Snapshot
- This is a 3-bed/2.5-bath condo listed at $165k.
Deal economics
- At list price, monthly cash flow is $213 ($3k/yr) — positive.
- The deal already cash-flows at list — no discount required.
- Meets the 1% rule at list price ($2k rent vs $165k).
- Recommended offer: $145k (12.0% below list) — sets the bar for market timing.
- Cap rate 7.8% vs local median 3.2% in Houston — top-decile yield for the area; either an underpriced asset or a hidden risk that comps aren't pricing in. Stress-test before assuming the spread holds.
Location & tenants
- Location reads 74/100 on livability (#184 in TX, #4,771 nationally) — a middle-class / working-renter tenant base. Strengths: amenities A+, cost of living A+, housing A+; Watch: schools D, crime F.
- Spring Branch ISD (urban): math 47% / reading 46% proficiency, ranked #215 of 826 in TX (top 26%) — families likely to look elsewhere, expect single-tenant / working-renter base with shorter leases.
- Market conditions: Rents rising (+1.4%/yr); 441 active listings in the ZIP; 40 comparable units currently listed for rent nearby; rentals leasing fast (median 10d on market — plan ~1-2 weeks tenant-placement turnaround); 29,883 units permitted in Harris County in 2024 (8,621 in 5+ unit buildings).
- This rent runs 40% of the median local income ($74k/yr) — at the standard rent-burdened threshold; future hikes will face affordability resistance.
Forward outlook
- Local home prices are declining (-3.0%/yr); year-one equity from $1k of loan paydown is wiped out by about $5k of value loss. Plan a longer hold.
- Harris County population projected at +47% by 2050 — long-run rental-demand tailwind backs the buy-and-hold thesis.
Negotiation context
- It's been on market 163 days — a 12% lower offer ($145k) is reasonable based on typical stale-listing flexibility.
- 8 sale attempts since 19y ago; this cycle's ask has dropped $10k (6%) from the opening price — seller is motivated, your offer sets the floor, not the list.
Risks & watch-outs
- Watch-outs: HOA is 21% of rent.
- Climate carrying-cost: major flood risk; severe wind risk, 99% chance of damaging wind over 30y; extreme-heat days projected 7→23/yr by 2055 (HVAC capex compounding) — expect insurance premiums to compound above CPI over the hold.
Questions for the listing agent
- It's been on market 163 days. Have you received any prior offers? Is the seller open to a 12% concession, seller financing, or rate buy-down credit?
- Built in 1966 — when were the roof, HVAC, electrical panel, plumbing, and water heater last replaced?
- What does the HOA fee cover, when was the last increase, and are there any pending special assessments or reserve-fund shortfalls?
- Any open or pending special assessments — roof, HVAC, plumbing, elevator, façade? What's the per-unit balance and payoff schedule, and is the seller paying it off at close or rolling it to the buyer?
- Why hasn't it sold? Are there any deal-killer items the seller is aware of (foundation, flood, title, zoning, code violations)?
- Is there a deadline driving the sale (1031 exchange, divorce, estate, relocation)? That informs how much negotiation room exists.
- Schools are D-rated, which usually means shorter tenancies and higher turnover. Who's the typical renter profile here, and what's been the actual vacancy rate?
- Crime grade is F in this area — have there been break-ins, vandalism, or insurance claims at this property in the last 3 years? What carrier currently insures it and at what premium?
- What's the average days-on-market for RENTAL listings here right now (not sales)? A rising rental-DOM trend means longer vacancies and softer asking-rent achievability than the comps imply.
- What's the recent tenant-quality profile in this submarket — average credit score on applications, eviction rate, late-payment / NSF rate, and stable-employment percentage? A property-management company in the area should have these aggregated.
- How much new apartment / multifamily construction is in the pipeline within 1–3 miles? Heavy new supply (>2% of stock underway) typically softens rents 12–24 months out; light construction supports rent growth.
Investment metrics
- 1% rule
- 1.49% ✓
- Cap rate
- 7.84%
- Cash-on-cash
- 5.53%
- DSCR
- 1.25
- GRM
- 5.6
CMA / ARV
- ARV (median comp)
- $186,412
- List price
- $165,000
- Delta
- -11.49%
- Verdict
- UNDERPRICED
- Comps
- 20 within 1.0 mi
Projected returns pro-forma
-3.0% appreciation · 1.41% rent growth · sell at horizon
- IRR
- -10.1%
- Equity multiple
- 0.64×
- Total profit
- $-16,644
- Equity at exit
- $24,602
- IRR
- -3.9%
- Equity multiple
- 0.77×
- Total profit
- $-10,770
- Equity at exit
- $14,266
Cash invested: $46,200 (down + closing). Projections, not guarantees.
Landlord ↔ Tenant lean methodology
- Overall (STATE)
- 87 Strongly Landlord-Friendly
- State Texas
- 87 Strongly Landlord-Friendly · R+5
- County
- — inherits STATE
- City
- — inherits STATE
ZIP-level market 77055
- Rents YoY
- 1.4%
- Active inventory
- 441
- Price-to-rent
- 5.6×
Monthly cashflow live
- Estimated rent
- $2,451 high interval (Pro) →
- Mortgage (P&I)
- −$865
- Tax from tax record
- −$277 /mo · $3,325/yr
- Insurance
- −$69
- HOA
- −$512
- Vacancy / Maint / Mgmt
- −$515
- Net cashflow
- $213
Break-even live
UW: 25.0% down · 7.5% · 30yr · 1.5% tax · 5.0% vac · 8.0% maint · 8.0% mgmt
Financing live
Cash to close
- Down payment
- $41,250
- Closing costs
- $4,950
- Reserves months
- —
- Total cash needed
- —
Loan-product check · same deal, 3 products live
Conventional
25% down · 7.5% · 30yr
- Down + closing
- —
- Monthly P&I
- —
- Monthly cashflow
- —
- DSCR
- —
- Eligible?
- —
Personal DTI + credit; lowest rate.
DSCR
20% down · 8.5% · 30yr
- Down + closing
- —
- Monthly P&I
- —
- Monthly cashflow
- —
- DSCR
- —
- Eligible?
- —
No personal income docs; deal must DSCR.
Hard money
10% down · 12.0% · 12mo
- Down + closing
- —
- Monthly P&I
- —
- Monthly cashflow
- —
- DSCR
- —
- Eligible?
- —
Short-term bridge; refi at stabilization.
Rent comps 40 comps
| Address | Beds | Baths | Sqft | Rent | $/sqft | DOM | Units | Dist |
|---|---|---|---|---|---|---|---|---|
| 1500 Witte Rd Houston, TX | 1.0–3.0 | 1.5–2.5 | 1085 | $1,639 | $1.51 | 2d | 13 | 0.46mi |
| 1506 Witte Rd Unit 16 Houston, TX | 3.0 | 2.0 | 1350 | $1,549 | $1.15 | 43d | 1 | 0.51mi |
| 9807 Katy Fwy Ste 140 Houston, TX | 2.0 | 2.0 | 1357 | $2,362 | $1.74 | 43d | 1 | 0.56mi |
| 1562 Gessner Rd Houston, TX | 3.0 | 2.0 | 1130 | $1,425 | $1.26 | 14d | 1 | 0.62mi |
| 9789 Katy Fwy Houston, TX | 2.0 | 1.0–2.0 | 1038 | $4,794 | $4.62 | 1d | 13 | 0.66mi |
| 976 Bunker Hill Rd Houston, TX | 3.0 | 2.0 | 1380 | $1,990 | $1.44 | 20d | 1 | 0.70mi |
| 976 Bunker Hill Rd Houston, TX | 3.0 | 2.0 | 1380 | $1,990 | $1.44 | 43d | 1 | 0.70mi |
| 1477 Springrock Ln Unit SP99 Houston, TX | 2.0 | 2.5 | 1260 | $1,725 | $1.37 | 5d | 1 | 0.71mi |
| 9757 Katy Fwy Unit 9790 Houston, TX | 3.0 | 2.0 | 1750 | $5,462 | $3.12 | 13d | 1 | 0.72mi |
| 9757 Katy Fwy Unit 2165 Houston, TX | 2.0 | 2.0 | 1238 | $4,442 | $3.59 | 2d | 1 | 0.72mi |
| 9757 Katy Fwy Unit 421 Houston, TX | 2.0 | 2.0 | 1238 | $4,450 | $3.59 | 5d | 1 | 0.72mi |
| 9757 Katy Fwy Unit 9780 Houston, TX | 2.0 | 2.0 | 1238 | $4,474 | $3.61 | 10d | 1 | 0.72mi |
| 966 Bunker Hill Rd Houston, TX | 2.0 | 2.0 | 1249 | $2,952 | $2.36 | 11d | 1 | 0.78mi |
| 970 Bunker Hill Rd Unit 3174 Houston, TX | 3.0 | 2.0 | 1460 | $2,193 | $1.50 | 10d | 1 | 0.79mi |
| 970 Bunker Hill Rd Unit 3148 Houston, TX | 3.0 | 2.0 | 1460 | $2,161 | $1.48 | 2d | 1 | 0.79mi |
| 970 Bunker Hill Rd Unit 1003 Houston, TX | 3.0 | 2.0 | 1460 | $2,204 | $1.51 | 43d | 1 | 0.79mi |
| 10300 Katy Fwy Houston, TX | 1.0–2.0 | 1.0–2.0 | 903 | $1,961 | $2.17 | 1d | 23 | 0.84mi |
| 12000 Barryknoll Ln Unit 12023 Houston, TX | 2.0 | 2.0 | 1166 | $2,772 | $2.38 | 10d | 1 | 0.86mi |
| 12000 Barryknoll Ln Unit 12033 Houston, TX | 3.0 | 2.0 | 1821 | $4,604 | $2.53 | 10d | 1 | 0.86mi |
| 12000 Barryknoll Ln Unit 2162 Houston, TX | 2.0 | 2.0 | 1166 | $2,748 | $2.36 | 5d | 1 | 0.86mi |
| 12000 Barryknoll Ln Unit 3165 Houston, TX | 3.0 | 2.0 | 1821 | $4,572 | $2.51 | 2d | 1 | 0.86mi |
| 12000 Barryknoll Ln Unit 12037 Houston, TX | 2.0 | 2.0 | 1166 | $2,715 | $2.33 | 43d | 1 | 0.86mi |
| 12000 Barryknoll Ln Unit 2165 Houston, TX | 2.0 | 2.0 | 1166 | $2,740 | $2.35 | 2d | 1 | 0.86mi |
| 878 Bettina Ct Houston, TX | 3.0 | 2.0 | 1200 | $1,740 | $1.45 | 24d | 1 | 0.86mi |
| 12006 Barryknoll Ln Houston, TX | 2.0 | 2.0 | 1166 | $2,880 | $2.47 | 43d | 1 | 0.87mi |
| 10214 Londonderry Dr Houston, TX | 3.0 | 2.0 | 1606 | $2,600 | $1.62 | 43d | 1 | 0.92mi |
| 9550 Long Point Rd Houston, TX | 2.0–4.0 | 1.0–2.0 | 1130 | $1,150 | $1.02 | 1d | 10 | 0.93mi |
| 1776 Gessner Rd Houston, TX | 1.0–4.0 | 1.0–2.0 | 934 | $1,232 | $1.32 | 43d | 11 | 0.97mi |
| 1403 Blalock Rd Houston, TX | 2.0 | 1.5–2.0 | 1276 | $1,525 | $1.20 | 43d | 4 | 1.01mi |
| 1111 Blalock Rd Unit 3047 Houston, TX | 3.0 | 2.0 | 1566 | $2,040 | $1.30 | 10d | 1 | 1.03mi |
| 1217 Blalock Rd Houston, TX | 3.0 | 1.0–2.0 | 818 | $1,162 | $1.42 | 5d | 15 | 1.04mi |
| 1111 Blalock Rd Unit 525 Houston, TX | 3.0 | 2.0 | 1566 | $1,997 | $1.28 | 2d | 1 | 1.05mi |
| 1111 Blalock Rd Unit 1144 Houston, TX | 3.0 | 2.0 | 1566 | $2,029 | $1.30 | 10d | 1 | 1.05mi |
| 1111 Blalock Rd Houston, TX | 2.0 | 2.0 | 1070 | $1,378 | $1.29 | 43d | 1 | 1.06mi |
| 10408 Town & Country Way Houston, TX | 2.0 | 2.0 | 1098 | $2,285 | $2.08 | 43d | 1 | 1.07mi |
| 10402 Town & Country Way Unit 10425 Houston, TX | 2.0 | 2.0 | 1486 | $2,965 | $2.00 | 43d | 1 | 1.08mi |
| 10402 Town & Country Way Unit 2174 Houston, TX | 2.0 | 2.0 | 1278 | $2,641 | $2.07 | 10d | 1 | 1.08mi |
| 10402 Town & Country Way Unit 2162 Houston, TX | 2.0 | 2.0 | 1278 | $2,617 | $2.05 | 5d | 1 | 1.08mi |
| 10402 Town & Country Way Unit 2187 Houston, TX | 2.0 | 2.0 | 1278 | $2,609 | $2.04 | 2d | 1 | 1.08mi |
| 10401 Town and Country Way Houston, TX | 2.0 | 2.0 | 1511 | $3,248 | $2.15 | 24d | 1 | 1.10mi |
HOA detail condo
- Monthly dues
- $512 · $6,144/yr
- Assessments
- None detected in remarks — confirm with the listing agent.
Listing history 38 events
-
2026-06-18days on market $165,000 Active 163 DOM
-
2026-06-17days on market $165,000 Active 162 DOM
-
2026-06-16days on market $165,000 Active 161 DOM
-
2026-06-15days on market $165,000 Active 160 DOM
-
2026-06-13days on market $165,000 Active 158 DOM
-
2026-06-09days on market $165,000 Active 154 DOM
-
2026-06-08days on market $165,000 Active 153 DOM
-
2026-06-07days on market $165,000 Active 152 DOM
-
2026-06-04days on market $165,000 Active 149 DOM
-
2026-06-03days on market $165,000 Active 148 DOM
-
2026-06-02days on market $165,000 Active 147 DOM
-
2026-06-01days on market $165,000 Active 146 DOM
-
2026-05-31days on market $165,000 Active 145 DOM
-
2026-04-03price $165,000 930-char remark
Show marketing remark (930 chars)
Welcome to 1235 Witte Rd., a beautifully maintained 3-bedroom, 2.5-bathroom residence located in the highly sought-after Spring Branch neighborhood of Houston. This spacious home offers a perfect blend of comfort, style, and convenience, ideal for families or anyone looking for easy access to city life with a touch of suburban tranquility. Step inside to discover an open-concept layout with abundant natural light, updated flooring, and neutral tones that create a warm and inviting atmosphere. The kitchen features modern appliances, ample cabinet space, and a breakfast bar, opening into a generously sized living and dining area, perfect for entertaining guests or relaxing with loved ones. A convenient half bath adds extra functionality for guests. With a location just minutes from top-rated schools, major highways, Memorial City Mall, and Houston’s Energy Corridor, this home offers both comfort and connectivity.
-
2026-01-06$175,000 Active 930-char remark
Show marketing remark (930 chars)
Welcome to 1235 Witte Rd., a beautifully maintained 3-bedroom, 2.5-bathroom residence located in the highly sought-after Spring Branch neighborhood of Houston. This spacious home offers a perfect blend of comfort, style, and convenience, ideal for families or anyone looking for easy access to city life with a touch of suburban tranquility. Step inside to discover an open-concept layout with abundant natural light, updated flooring, and neutral tones that create a warm and inviting atmosphere. The kitchen features modern appliances, ample cabinet space, and a breakfast bar, opening into a generously sized living and dining area, perfect for entertaining guests or relaxing with loved ones. A convenient half bath adds extra functionality for guests. With a location just minutes from top-rated schools, major highways, Memorial City Mall, and Houston’s Energy Corridor, this home offers both comfort and connectivity.
-
2025-12-15status Active
-
2025-10-31historical
-
2025-10-19status Pending
-
2025-10-10historical
-
2025-08-11price $159,000
-
2025-08-11price $161,910
-
2025-06-26$179,900 Active
-
2014-03-12soldstatus
-
2014-03-07soldstatus Sold
-
2014-02-01status Pending, Continue to Show
-
2014-01-19status Option Pending
-
2014-01-08status Active
-
2014-01-02status Option Pending
-
2013-12-07price $66,500
-
2013-11-18$70,000 Active
-
2010-07-08historical
-
2009-01-07$54,000
-
2009-01-06historical
-
2008-04-07$88,500
-
2008-01-30historical
-
2007-11-10$74,500
-
2002-12-30soldstatus
-
2001-03-12soldstatus
ⓘ Source: listings_history table (triggers on properties + properties_extension) + one-shot
backfill from property_details.listing_events for pre-trigger history.
Tax reassessment forecast TX · Resets to sale price
- Current annual tax
- $3,325 · $277/mo
- Projected year-2 tax
- $3,325 · $277/mo
- Expected delta
- $0/yr ($0/mo · 0.0%)
ⓘ Screening estimate from a state-policy table — verify with the county assessor before closing.
Climate risk First Street
- Flood 6/10 Major FEMA zone X (unshaded) · 75% chance over 30 yrs
- Wildfire 1/10 Low
- Heat 9/10 Extreme 7 d/yr ≥109°F today · 23 d/yr by 30 yrs out
- Wind 9/10 Extreme 99% chance of damaging wind over 30 yrs
- Air quality 3/10 Moderate 3 unhealthy d/yr today · 3 by 30 yrs out
Nearby sold comps map
Loading sold comps map…
Walkable amenities ~0.75 mi
Loading nearby amenities…
Taxation est. · year 1
- Rental income
- $29,408
- − Mortgage interest
- −$9,243
- − Property taxes
- −$3,325
- − Insurance
- −$825
- − Repairs & maintenance
- −$2,353
- − Management
- −$2,353
- − HOA
- −$6,144
- − Depreciation
- −$4,800
- Taxable income
- $365
- Est. tax owed @ 24.0%
- −$88
- After-tax cash flow
- $2,467/yr
For passive investors: Depreciation is non-cash, so a rental often shows a tax loss while cash-flowing — sheltering income. Rental losses are passive: they offset passive income freely, and up to $25,000/yr can offset ordinary (W-2) income if you actively participate and your MAGI is under $100k (phasing out to $0 by $150k); unused losses carry forward. On sale, claimed depreciation is recaptured at up to 25%, and gains may owe capital-gains tax (a 1031 exchange can defer both). Figures are a year-1 estimate at your 24.0% rate — not tax advice; consult a CPA.
Schools (NCES district)
- District
- Spring Branch ISD
- NCES district ID
- 4841100
- Math proficiency
- 47% ▼ -4.00%
- Reading proficiency
- 46% ▼ -1.00%
- Median HH income
- $60,311
- Composite
- 40.88/100
- National rank
- #3624
- State rank
- #215 of 826 in TX
Livability — Houston
- Score
- 74/100
- State rank
- #184
- US rank
- #4771
Category grades
Schools grade is shown separately in the Schools card above.
Census & demographics
- Census place
- Houston, TX
- County
- Harris County · 4,702,590 people
- City population
- 3,226,434
- Metro
- Houston-The Woodlands-Sugar Land, TX
- Population (ZIP)
- 45,435
- Household income
- $74,369
- Rent vs Own
- Severe rent burden
- 2571.0
Population outlook (Harris County) Hauer SSP2
- Today (2025)
- 5,571,493 people
- By 2030
- 6,089,821 · +9.3%
- By 2040
- 7,142,806 · +28.2%
- By 2050
- 8,185,864 · +46.9%
- By 2075
- 10,574,329 · +89.8%
- By 2100
- 12,109,958 · +117.4%
Race, ethnicity, and origin ACS 2023
- Neighborhood character
- Diverse neighborhood (Simpson 0.61)
- Race & ethnicity
- Hispanic / Latino 53% White 33% Two or more races 18% Asian 6% Black 5% Native American 2%
- Hispanic origin (detail)
- Mexican 32%
- Common ancestry
- Lithuanian 2% Italian 1% Serbian 1%
- Foreign-born
- 34% · Canada, China, Vietnam
- Languages at home
- 46% English-only · Spanish 45% Chinese 2% Arabic 2%
Political lean MEDSL · Harris
- 2024 margin
- Lean D (+5.5) · D 52.0% · R 46.4% · Other 1.6%
- 2008→2024 swing
- +3.9pp toward D · 2008: 1.6pp · 2024: 5.5pp
- All cycles
- 2024: D+5.5 2020: D+13.3 2016: D+12.4 2012: D+0.1 2008: D+1.6
Not yet ingested
- Civics
- —
Market trends
- HPI YoY
- ▼ -488.83%
- Current HPI
- 251.807
- Rent YoY
- ▲ 1.41%
- Metro
- Houston-The Woodlands-Sugar Land, TX
- State GDP YoY
- ▲ 3.95%
- F500 in state
- 110
Industry mix (Fortune 500 HQ in TX)
| Industry | F500 HQs | Revenue |
|---|---|---|
| Energy | 16 | $1,198B |
|
||
| Technology | 5 | $198B |
|
||
| Engineering / Construction | 4 | $72B |
|
||
| Energy Services | 3 | $60B |
|
||
| Utilities | 3 | $41B |
|
||
| Healthcare | 2 | $330B |
|
||
Price history
+121.5% since first listed25 events — show timeline
- 2026-04-03 Price Changed $165,000 HARMLS
- 2026-01-06 Listed $175,000 HARMLS
- 2025-12-15 Relisted — HARMLS
- 2025-10-31 Listing Removed — HARMLS
- 2025-10-19 Pending — HARMLS
- 2025-10-10 Listing Removed — HARMLS
- 2025-08-11 Price Changed $159,000 HARMLS
- 2025-08-11 Price Changed $161,910 HARMLS
- 2025-06-26 Listed $179,900 HARMLS
- 2014-03-12 Sold (Public Records) — Public Records
- 2014-03-07 Sold (MLS) — HARMLS
- 2014-02-01 Pending — HARMLS
- 2014-01-19 Pending — HARMLS
- 2014-01-08 Relisted — HARMLS
- 2014-01-02 Pending — HARMLS
- 2013-12-07 Price Changed $66,500 HARMLS
- 2013-11-18 Listed $70,000 HARMLS
- 2010-07-08 Listing Removed — HARMLS
- 2009-01-07 Listed $54,000 HARMLS
- 2009-01-06 Listing Removed — HARMLS
- 2008-04-07 Listed $88,500 HARMLS
- 2008-01-30 Listing Removed — HARMLS
- 2007-11-10 Listed $74,500 HARMLS
- 2002-12-30 Sold (Public Records) — Public Records
- 2001-03-12 Sold (Public Records) — Public Records
Property tax history
+8.6%/yrLatest (2025): $3,325 · +8.4% YoY. Source: county tax records.
Cash-flow waterfall
monthlySold comps — $/sqft
last 12 mo · ≤1 miLoading sold comps…